Join our fan page
- Views:
- 22960
- Rating:
- Published:
- Updated:
-
Need a robot or indicator based on this code? Order it on Freelance Go to Freelance
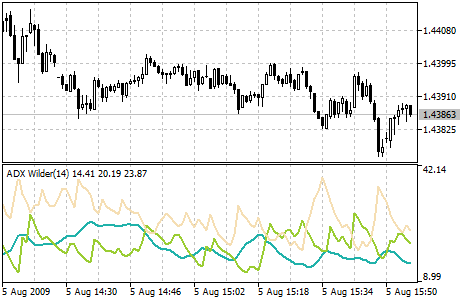
Average Directional Movement Index Wilder (ADX Wilder) helps to determine if there is a market trend.
This technical indicator is constructed as a strict correspondence with the algorithm described by Welles
Wilder in his book "New concepts in technical trading systems".
Trading rules of this indicator are described in the Average Directional Movement Index.

Calculation:
First positive (dm_plus) and negative (dm_minus) changes at each bar are calculated, as well as the true range tr:
If Low(i-1) - Low(i) > 0 dm_minus(i) = Low(i-1) - Low(i), otherwise dm_minus(i) = 0.
tr(i) = Max(ABS(High(i) - Low(i)), ABS(High(i) - Close(i-1)), ABS(Low(i) - Close(i-1)))
where:
- High(i) - maximum price of the current bar;
- Low(i) - minimum price of the current bar;
- High(i-1) - maximum price of the previous bar;
- Low(i-1) - minimum price of the previous bar;
- Close(i-1) - close price of the previous bar;
- Max (a, b , c) - maximum value out of three numbers: a, b и c;
- ABS(X) - absolute value of the X.
After that the smoothed values are calculated: Plus_D(i), Minus_D(i) and ATR():
Plus_D(i) = SMMA(dm_plus, Period_ADX,i)/ATR(i)*100
Minus_D(i) = SMMA(dm_minus, Period_ADX,i)/ATR(i)*100
where:
- SMMA(X, N, i) - Smoothed Moving Average of X series on the current bar;
- Perod_ADX - number of bars, used for calculation.
Now Directional Movement Index - DX(i) - is calculated:
After preliminary calculations we obtain the value of the ADX(i) indicator on the current bar by smoothing DX index values:
Translated from Russian by MetaQuotes Ltd.
Original code: https://www.mql5.com/ru/code/8
 Class CalcFrac - Number of bars before and after the current High / Low (calculated fractal)
Calculates fractals and lets you specify the number of bars separately before and after the current High / Low (fractal).
 Average Directional Movement Index (ADX)
The Average Directional Movement Index Indicator (ADX) helps to determine if there is a price trend.
 Adaptive Moving Average (AMA)
The Adaptive Moving Average Indicator is used for constructing a moving average with low sensitivity to price series noises and is characterized by the minimal lag for trend detection.
 Accumulation Swing Index (ASI)
ASI was created by Wales Wilder as an ordinary fluctuations indicator that gets signals from previous maximums and minimums of price.