Join our fan page
- Views:
- 32145
- Rating:
- Published:
- Updated:
-
 You are missing trading opportunities:
- Free trading apps
- Over 8,000 signals for copying
- Economic news for exploring financial markets
Registration Log inYou agree to website policy and terms of use
If you do not have an account, please register -
 Need a robot or indicator based on this code? Order it on Freelance
Go to Freelance
Need a robot or indicator based on this code? Order it on Freelance
Go to Freelance
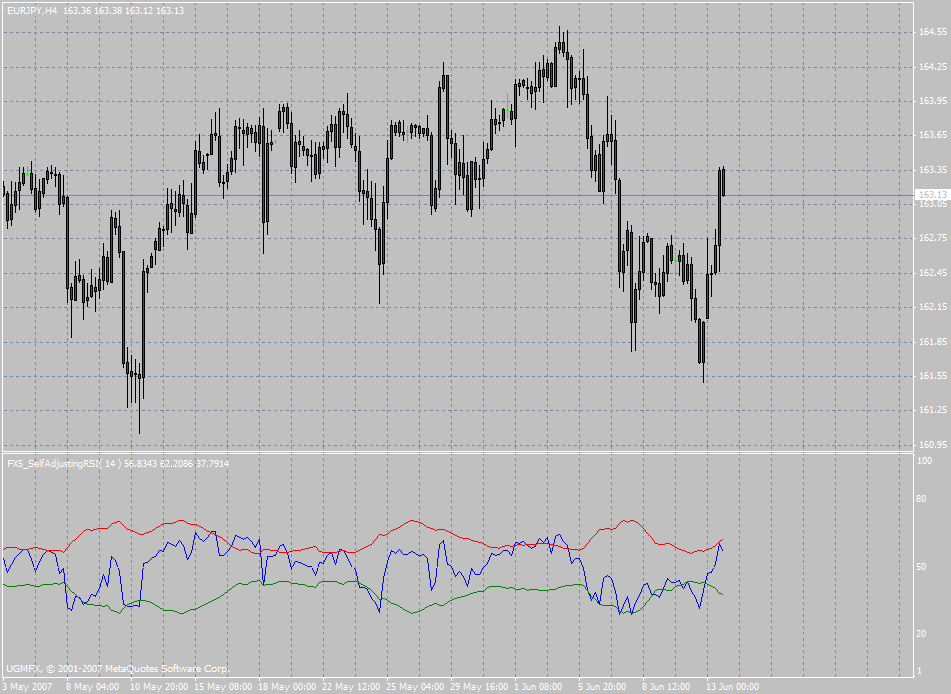
In February issue of Technical Analysis of STOCKS & COMMODITIES magazine David Sepiashvili presented a new idea for adjusting RSI overbought-oversold levels. The advantage of this approached is that it could be applied to multiple market conditions without regard to the calculation period. This standardization facilitates the usage of the indicator in Multiframe analysis.
The article contained two different algorithms for of adjusting the width of the overbought and oversold bands for the RSI. This indicator draws RSI and the self-adjusting overbought-overslold levels.
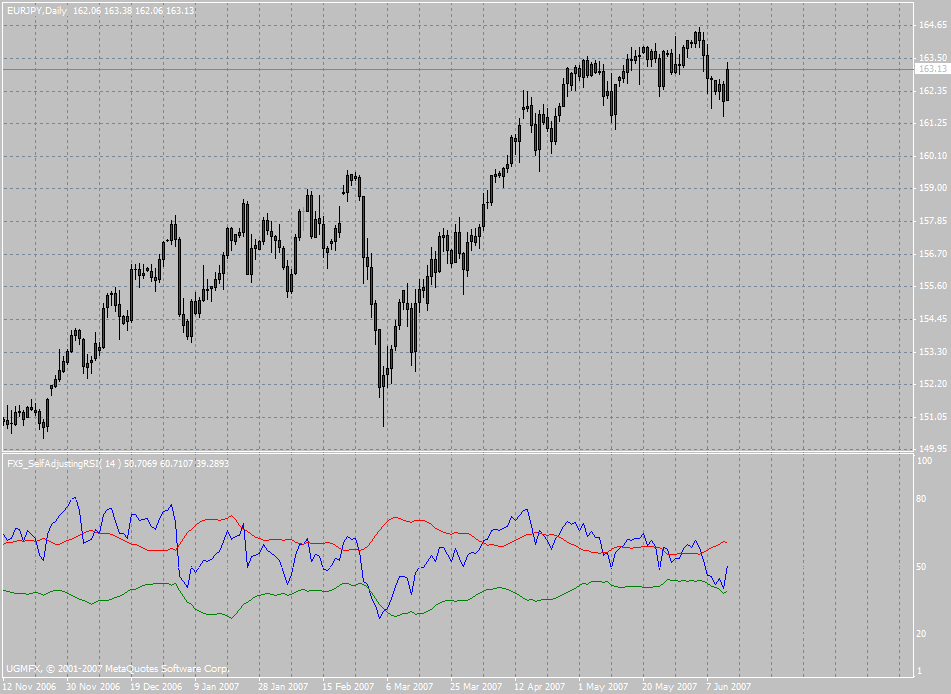
If the parameter MA-Method is set to true the bands are calculted by moveing average based algorithm. If it is set to false the altarnative standard diviation algorithm will be used.
 FX5_MACD_Divergence
This is another flavour of the original divergence indicator. It detects divergence between price and MACD indicator and gives Buy or Sell signals according to the divergence type.
i-AMA-Optimum
Kaufman's AMA with optimization for the long periods.
Waddah Attar Buy Sell Vol
This indicator separate Buy Volume and Sell Volume .. you never see like this before
Waddah Attar Strong Level
This indicator is very powerful .. It draws Month - Week - Day - H4 Level or Range. with backtest true or false.