Join our fan page
- Views:
- 152798
- Rating:
- Published:
- Updated:
-
Need a robot or indicator based on this code? Order it on Freelance Go to Freelance
After the success of the original indicator, I decided to write more indicators for detecting divergence between price and other indicator.

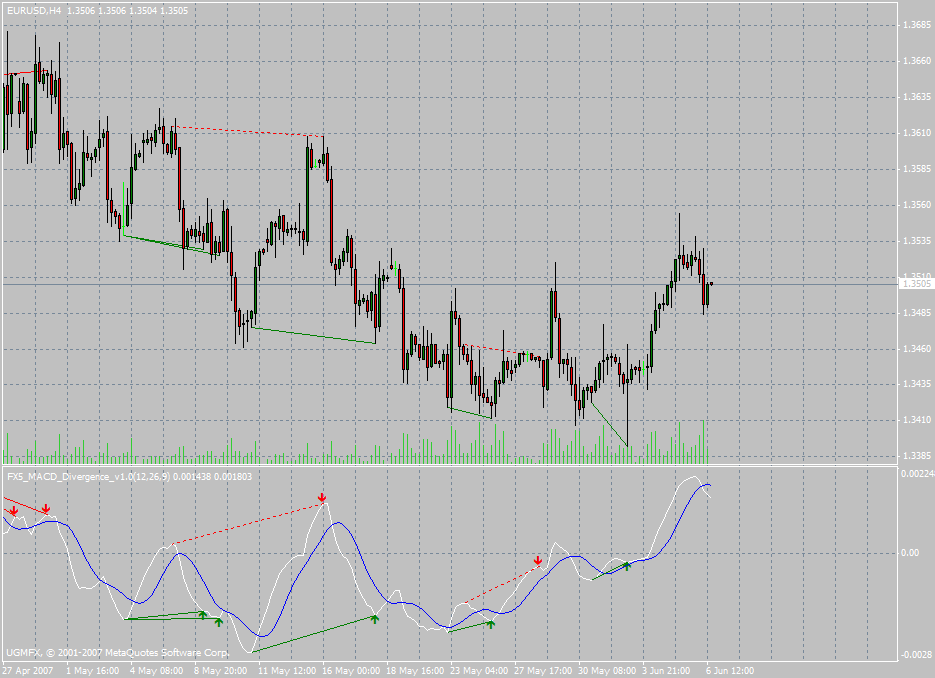
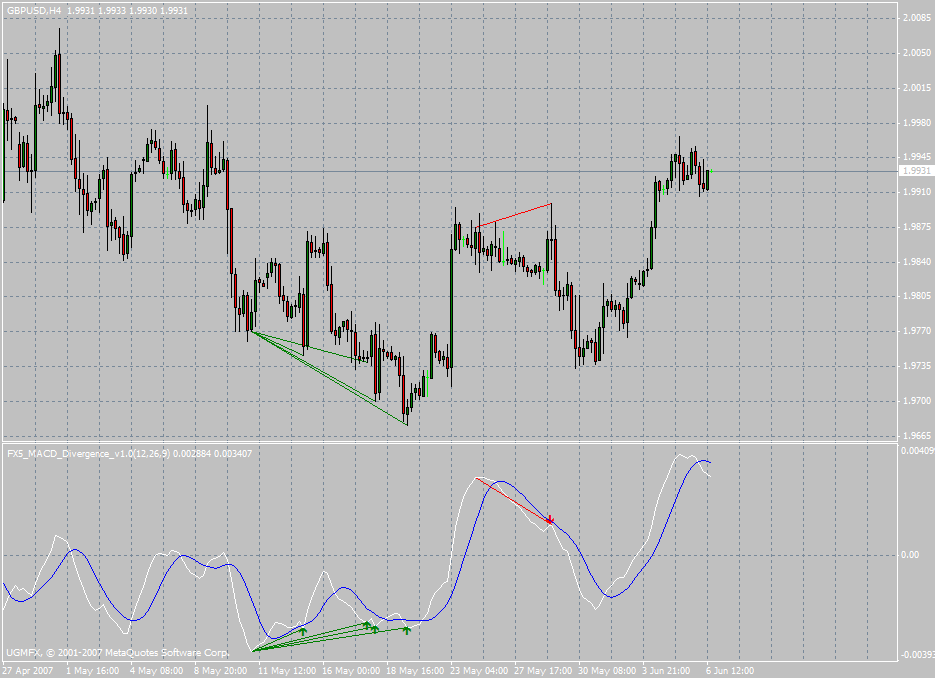
This indicator will plot divergence lines on the MACD indicator and will give buy and sell signal by displaying green and red arrows. It also has a built-in alert function. As the original indicator, bullish divergence is plotted in green lines while bearish divergence is plotted in red. If the divergence is classic the line will be solid and if the type is reversed the line will be interrupted.

I hope you gets the most benedfit from this indicator.
Changes to verion 1.1:
- This version is directed to traders who do not want repainted singals. The signals are not repainted buy they are delayed one candle.
 i-AMA-Optimum
Kaufman's AMA with optimization for the long periods.
 FX5_Divergence
This indicator will detect divergence between the price and OsMA indicator. It will give buy or sell signal according to the type of divergence that was detected.
 FX5_SelfAdjustingRSI
This FX5_SelfAdjustingRSI idicator draws RSI self adjusting overbought-oversold that were suggested by David Sepiashvili.
 Waddah Attar Buy Sell Vol
This indicator separate Buy Volume and Sell Volume .. you never see like this before