Join our fan page
- Views:
- 15026
- Rating:
- Published:
- Updated:
-
Need a robot or indicator based on this code? Order it on Freelance Go to Freelance
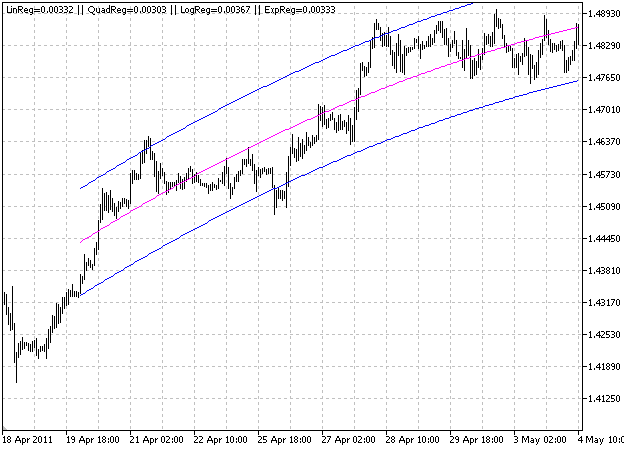
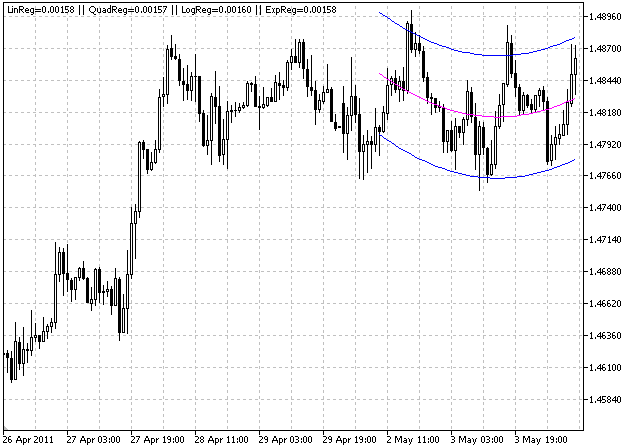
This indicator compares four types of regression (linear, quadratic, logarithmic and exponential) and chooses the one that best fits the data analyzed.
This analysis is done every time there is a new tick.
//--- input parameters
// dp_limiter  It should be >2 . If not it will be autoset to default value
input ushort         dp_limiter  =100;     // Number of data points
input uint           endpos      =0;      // Last value position
input double         multStdDev  =1.96;    // Bands separation
input inputs_switch  comments   =On;     // Comments switch
input inputs_switch  record     =Off;    // Record info into a file text
In the left top corner of the chart four values are displayed.
These values represent the dispersion of data regarding to its regression, so the smallest value indicates the best option.


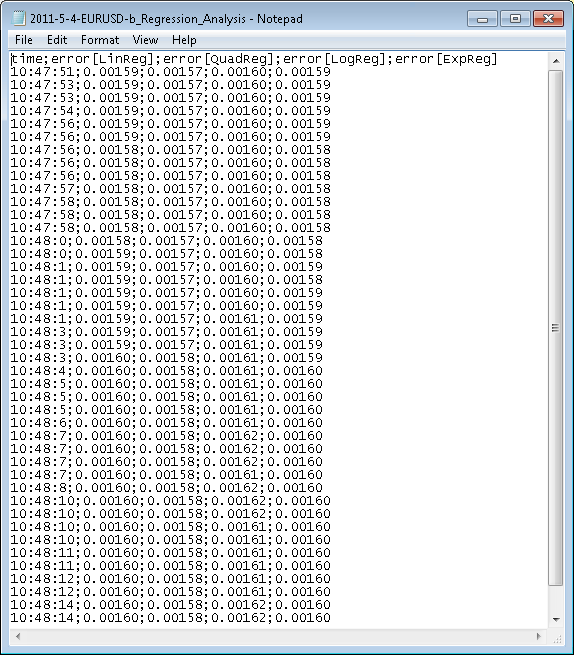
Additionally, the indicator allows recording these values into a text file for further analysis.

 Kaufman Efficiency Ratio
Kaufman Efficiency Ratio (also called "generalized fractal efficiency") according to Perry Kaufman books "Smarter Trading" and "New Trading Systems & Methods".
 Kaufman Volatility
Kaufman Volatility indicator according to Perry Kaufman book "Smarter Trading: Improving Performance in Changing Markets".
 sTimeToVariables
The script converts the time, represented as datetime variable into the year, month, day, hour, minutes and seconds.
 Exposure
This script reads all opened position and calculates their exposure for each currency.