Join our fan page
- Views:
- 4735
- Rating:
- Published:
- Updated:
-
Need a robot or indicator based on this code? Order it on Freelance Go to Freelance
Real author:
lukas1
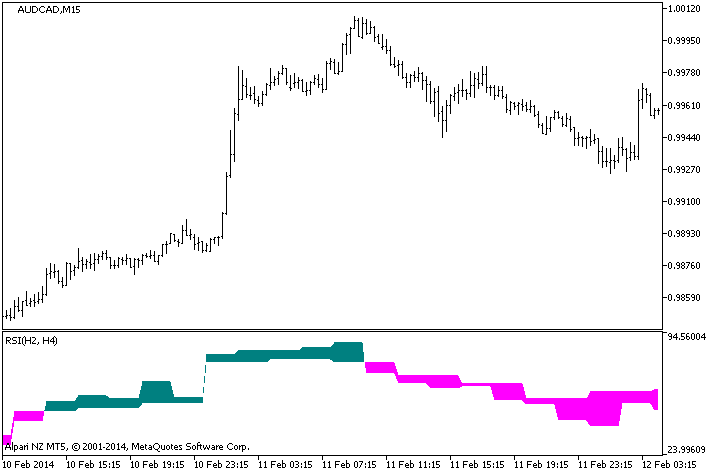
A colored cloud formed by two RSI (Relative Strength Index) oscillators with different timeframes.

Fig.1. RSI_2HTF Indicator
Translated from Russian by MetaQuotes Ltd.
Original code: https://www.mql5.com/ru/code/2425
 MA_2HTF
A colored cloud formed by two moving averages with different timeframes.
 BlauHLM_HTF
The BlauHLM indicator with the timeframe selection option available in input parameters.
 Simple Continuous ParabolicSAR
Unlike ParabolicSAR this indicator is continuous and more precise. Indicator's calculation is also very easy.
 ColorCCI
The classic CCI with the colored signal levels. For the moments of time, when the CCI indicator is in oversold and overbought zones, there are change of the indicator color corresponding to the trend direction. The growing trend colors the indicator in lettuce green, the falling into the red one.