Join our fan page

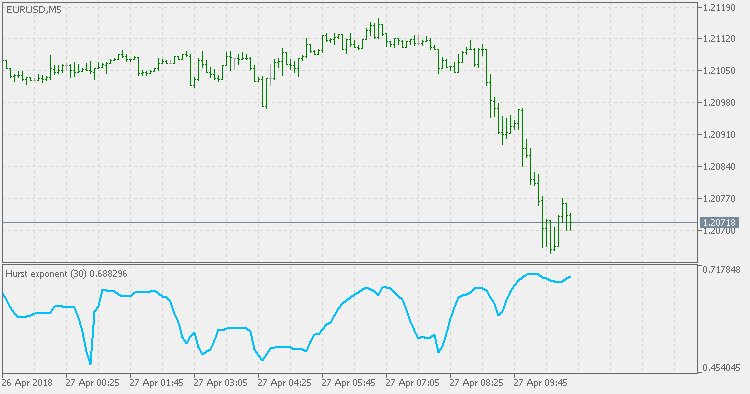
Hurst Exponent - indicator for MetaTrader 5

- Views:
- 15142
- Rating:
- Published:
-
 You are missing trading opportunities:
- Free trading apps
- Over 8,000 signals for copying
- Economic news for exploring financial markets
Registration Log inYou agree to website policy and terms of use
If you do not have an account, please register -
 Need a robot or indicator based on this code? Order it on Freelance
Go to Freelance
Need a robot or indicator based on this code? Order it on Freelance
Go to Freelance
The Hurst Exponent is used as a measure of long-term memory of time series. It relates to the autocorrelations of the time series, and the rate at which these decrease as the lag between pairs of values increases. Studies involving the Hurst exponent were originally developed in hydrology for the practical matter of determining optimum dam sizing for the Nile river's volatile rain and drought conditions that had been observed over a long period of time. The name "Hurst exponent", or "Hurst coefficient", derives from Harold Edwin Hurst (1880 - 1978), who was the lead researcher in these studies; the use of the standard notation H for the coefficient relates to his name also.
The Hurst exponent is referred to as the "index of dependence" or "index of long-range dependence". It quantifies the relative tendency of a time series either to regress strongly to the mean or to cluster in a direction.
- A value of H in the range 0.5 - 1 indicates a time series with long-term positive autocorrelation, meaning both that a high value in the series will probably be followed by another high value and that the values a long time into the future will also tend to be high.
- A value of H in the range 0 - 0.5 indicates a time series with long-term switching between high and low values in adjacent pairs, meaning that a single high value will probably be followed by a low value and that the value after that will tend to be high, with this tendency to switch between high and low values lasting a long time into the future.
- A value of H = 0.5 can indicate a completely uncorrelated series, but in fact it is the value applicable to series for which the autocorrelations at small time lags can be positive or negative but where the absolute values of the autocorrelations decay exponentially quickly to zero. This in contrast to the typically power law decay for the 0.5 < H < 1 and 0 < H < 0.5 cases.
Fractal Dimension - Jurik
Fractal Dimension from Mark Jurik is much smoother than the others but the general rule is the same: it is not a directional indicator, but is attempting to determine if there is a trend in the current market price changes or not, and it should be used bearing that in mind.
Fractal dimension index (Sevcik/Matulich)
Mandelbrot describes the Fractal Dimension Index (FDI) as a way to measure "how convoluted and irregular" something is. The FDI can be used as a stock market indicator. The closer prices move in a one-dimensional straight line, the closer the FDI moves to 1.0. The more closely prices resemble a two-dimensional plane, the closer the FDI moves to 2.0.
WSP & WRO
WSO (Widner Support Oscillator) and WRO (Widner Resistance Oscillator).
WSO & WRO Channel
This version of WSO (Widner Support Oscillator) and WRO (Widner Resistance Oscillator) shows channel on chart instead of displaying oscillator values in a separate window.