Join our fan page

Fractal Dimension - Jurik - indicator for MetaTrader 5

- Views:
- 7571
- Rating:
- Published:
- Updated:
-
 You are missing trading opportunities:
- Free trading apps
- Over 8,000 signals for copying
- Economic news for exploring financial markets
Registration Log inYou agree to website policy and terms of use
If you do not have an account, please register -
 Need a robot or indicator based on this code? Order it on Freelance
Go to Freelance
Need a robot or indicator based on this code? Order it on Freelance
Go to Freelance
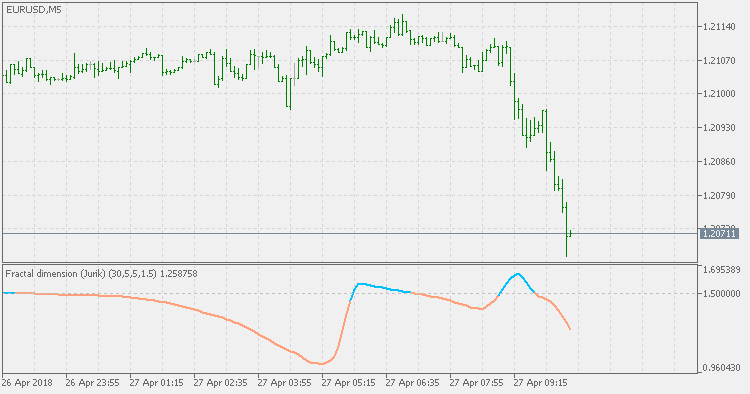
A lot of people have attempted to build indicator that assesses if there is a trend going on or the market is ranging. One of them was Mark Jurik too.
This is his version of fractal dimension. Version from Mark Jurik is much smoother than the others but the general rule is the same: it is not a directional indicator, but is attempting to determine if there is a trend in the current market price changes or not, and it should be used bearing that in mind.
Fractal dimension index (Sevcik/Matulich)
Mandelbrot describes the Fractal Dimension Index (FDI) as a way to measure "how convoluted and irregular" something is. The FDI can be used as a stock market indicator. The closer prices move in a one-dimensional straight line, the closer the FDI moves to 1.0. The more closely prices resemble a two-dimensional plane, the closer the FDI moves to 2.0.
Fractal dimension - Ehlers
By it's nature, fractal dimension index indicator is not directional. Instead it is showing if there is a trend or not. If the value of the FDI is less than the target threshold, then there is no trend (the market is ranging). If the value is above that threshold then the market is trending.
Hurst Exponent
The Hurst exponent is referred to as the "index of dependence" or "index of long-range dependence". It quantifies the relative tendency of a time series either to regress strongly to the mean or to cluster in a direction.
WSP & WRO
WSO (Widner Support Oscillator) and WRO (Widner Resistance Oscillator).