Join our fan page

Glitch Index - indicator for MetaTrader 5

- Views:
- 8304
- Rating:
- Published:
-
 You are missing trading opportunities:
- Free trading apps
- Over 8,000 signals for copying
- Economic news for exploring financial markets
Registration Log inYou agree to website policy and terms of use
If you do not have an account, please register -
 Need a robot or indicator based on this code? Order it on Freelance
Go to Freelance
Need a robot or indicator based on this code? Order it on Freelance
Go to Freelance
Source of this on is February 2004, Active Trader magazine.
System concept
This system was inspired by the more successful stock systems that have appeared in the Trading System Lab. These strategies share a common timing technique - they attempt to take advantage of minor extreme price movements.
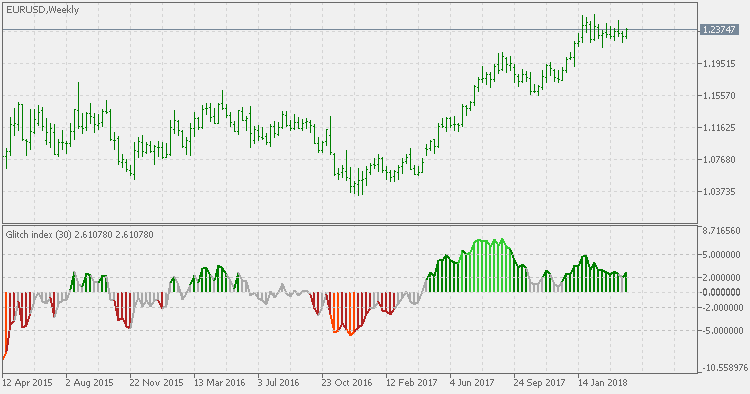
This system detects when price has deviated significantly from its norm by measuring how far it moves above and below a "detrended" Simple Moving Average (SMA). The resulting indicator is called the "Glitch Index," which represents the percentage move price has made above or below the detrended SMA. The theory is price will move back to its norm, and we can profit by taking advantage of the temporary deviation.
The formula for calculating the Glitch Index is:
where:
Diff = Closing Price - SMAMult
RocSMA = Rate of Change(SMA) * 0.1 + 1
SMAMult = SMA* RocSMA
The system buys when the Glitch Index goes below -2 and sells when it swings back up above +2. However, the system will not enter a long trade if the highest Glitch Index value within a 30-bar period is greater than 5. This prevents the system from entering when prices snap back from an extremely overbought level, such as a blow-off at the top of a strong bull rally.
The color of the Glitch Index (GI) indicator bars helps illustrate what the system is doing.
- Light green bars indicate a GI greater than 5, which means long trades are forbidden for the next 30 bars even if an entry signal occurs.
- Dark green bars indicate a GI of greater than 2 (the sell zone).
- Red bars indicate areas that are within the "no sell" zone (GI < -5).
- Dark red bars indicate the buy zone (i.e., GI < -2).
The system does not sell short.
Entry
- The Glitch Index must be less than -2.
- The highest Glitch Index reading within the last 30 bars must be less than +5.
- If these two conditions are met, buy the next bar at the market.
Exit
- If the Glitch Index is greater than +2, exit next bar at the market.
Money management
- Each trade was sized to equal 6 percent of the current account equity.
PS: the system is designed for daily and weekly time frames. For lower time frames the levels have to be adjusted.
Congestion index
The Congestion Index attempts to identify the market's character by dividing the actual percentage that the market has changed in the past x days by the extreme range.
Dsl - CMO bars
Chande Momentum Oscillator with added Discontinued Signal Lines instead of using static levels for trends displayed on the main chart as bars (if the current chart style is bars or line) or candles (it is done automatically).
Double Smoothed EMA
Unlike the similar attempts of smoothing existing indicators, the Double smoothed EMA indicator is not lagging when compared to "regular" EMA.
Triple DSEMA
This version uses double smoothed EMA instead of using Hull average, and since double smoothed EMA is never overshooting, that issue is solved. Being a very smooth average too, double smoothed EMA is really a good filter/average to be used in the "triple" series.