Join our fan page
- Views:
- 3793
- Rating:
- Published:
-
Need a robot or indicator based on this code? Order it on Freelance Go to Freelance
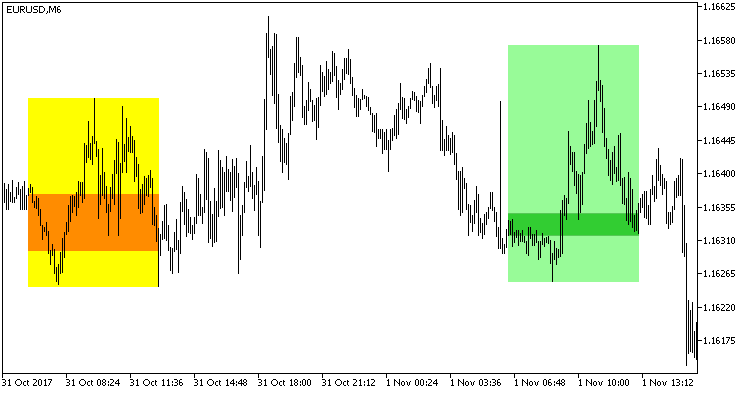
The indicator marks the time period specified in the indicator settings using colored rectangles. The middle rectangle is drawn based on the open and close prices of the trading period (the body of the resulting candlestick of the specified period), while the upper and lower rectangles represent the candlestick shadows.
Growing candlesticks are colored in lime-green, and falling candlesticks are of yellow-brick colors. The indicator is drawn using the DRAW_FILLING style.

Fig.1. The ShadeOpen indicator.
Translated from Russian by MetaQuotes Ltd.
Original code: https://www.mql5.com/ru/code/19339
 Alert Crossing Moving Average Nth Bar
An alert (an audio alert, email and push notification) is generated when the iMA (Moving Average, MA) indicator crosses the bar with index N.
 MAMACD
A strategy based on iMA (Moving Average, MA) and iMACD (Moving Average Convergence/Divergence, MACD).
 ShadeOpenX
The indicator marks the current day's time period specified in the indicator settings using colored rectangles.
 Disaster
Works with pending Buy Stop and Sell Stop orders. The EA uses the iMA (Moving Average, MA) indicator with a VERY large period equal to 590.