 MetaTrader 5
 Experts
 Indicators
 Scripts
 Libraries
 Storage
Watch how to download trading robots for free
Find us on Twitter!
Join our fan page
Join our fan page
You liked the script? Try it in the MetaTrader 5 terminal

- Published by:
- Views:
- 8300
- Rating:
- Published:
- Updated:
-
 You are missing trading opportunities:
- Free trading apps
- Over 8,000 signals for copying
- Economic news for exploring financial markets
Registration Log inYou agree to website policy and terms of use
If you do not have an account, please register -
 Need a robot or indicator based on this code? Order it on Freelance
Go to Freelance

Indicator lines show the accumulated sums of bulls and bears power for the user-defined period.
Method of Calculation
Bulls power is calculated by the following formula:
BullsPower(i) = SUM(Close(i) - Close(i + 1), N) / BUN
where the following applies:
- BullsPower(i) - the current bulls power.
- Close(i) - the Close price of the current bar.
- Close(i + 1) - the Close price of the previous bar.
- N - indicator calculation period.
- BUN - the number of positive increments of Close prices over N bars. The sum includes only positive increments.
Accordingly, the following formula is used for calculating the bears power:
BearsPower(i) = SUM(Close(i + 1) - Close(i), N) / BEN
where the following applies:
- BearsPower(i) - the current bears power.
- BEN - the number of negative increments of Close prices over N bars. The sum includes only negative increments.
Parameters
- Calculate period - the number of past bars used for the calculation of indicator values (specified as N in the formulas).
- The number of bars to display - the number of past bars, on which the indicator values will be displayed. To display the indicator on the whole available history, enter any unnatural number (0 or less). The parameter does not affect the indicator quality.
Interpretation
The red indicator line shows the bears power, and the blue line indicates the bulls power. The higher line shows the stronger side. The intersection of lines indicates trend change and is a good moment for opening a deal in the direction of the power that appeared to be above the other one.
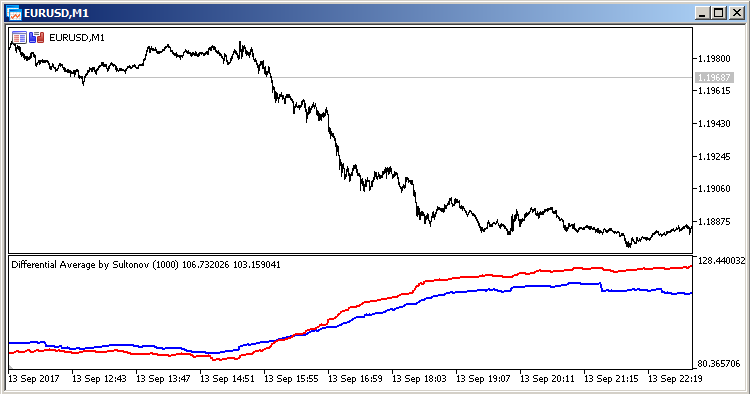
Fig. 1. Change of an uptrend to a downtrend.
Update 22.09.2017
- The error in recognizing the Russian language of the terminal has been fixed.
Translated from Russian by MetaQuotes Ltd.
Original code: https://www.mql5.com/ru/code/19142
 Current Next Futures
The script has three independent functions for determining the current FORTS futures.
 Vortex Indicator System
A trading system based on the Vortex indicator signals.
Flat Channel
The Expert Advisor trades in a channel. When a flat channel is found or when the market slows down, the EA places a pending order expecting the channel breakout.
HarVesteR
The Expert Advisor uses the following indicators: Moving Average Convergence/Divergence, MACD; Moving Average, MA; Average Directional Movement Index, ADX. It closes half of the profitable position.