Join our fan page

PDFma - indicator for MetaTrader 5

- Views:
- 9458
- Rating:
- Published:
- Updated:
-
 You are missing trading opportunities:
- Free trading apps
- Over 8,000 signals for copying
- Economic news for exploring financial markets
Registration Log inYou agree to website policy and terms of use
If you do not have an account, please register -
 Need a robot or indicator based on this code? Order it on Freelance
Go to Freelance
Need a robot or indicator based on this code? Order it on Freelance
Go to Freelance
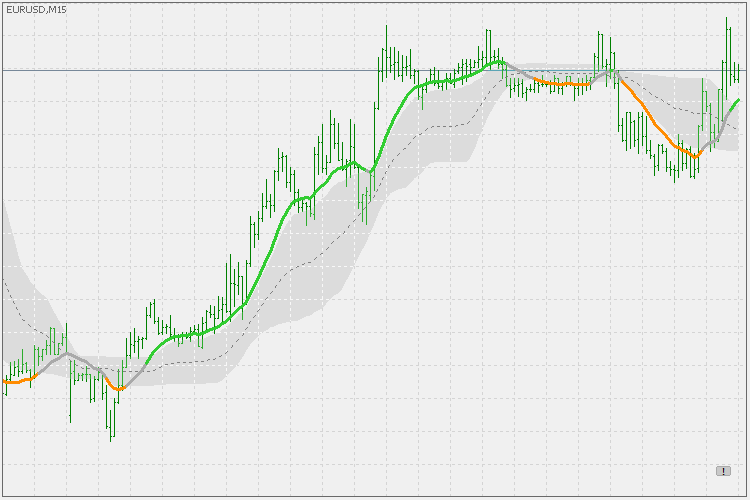
In short, this is a kind of weighted average (or a digital filter, depends how somebody prefers to call it) that is using probability density function to calculate the coefficients and the average. The short description of PDF is :
In probability theory, a probability density function (PDF), or density of a continuous random variable, is a function, whose value at any given sample (or point) in the sample space (the set of possible values taken by the random variable) can be interpreted as providing a relative likelihood that the value of the random variable would equal that sample. In other words, while the absolute likelihood for a continuous random variable to take on any particular value is 0 (since there are an infinite set of possible values to begin with), the value of the PDF at two different samples can be used to infer that, in any particular draw of the random variable, how much more likely it is that the random variable would equal one sample compared to the other sample.
More information here : https://en.wikipedia.org/wiki/Probability_density_function
Indicator has the usual set of options - 3 types of levels :
- floating
- quantile
- or no levels (when it switches to "on slope" mode)
Color (and alerts) choices :
- on outer levels cross
- on middle levels cross
- on slope change
It uses the usual set of prices + heiken ashi prices and i multi time frame already.
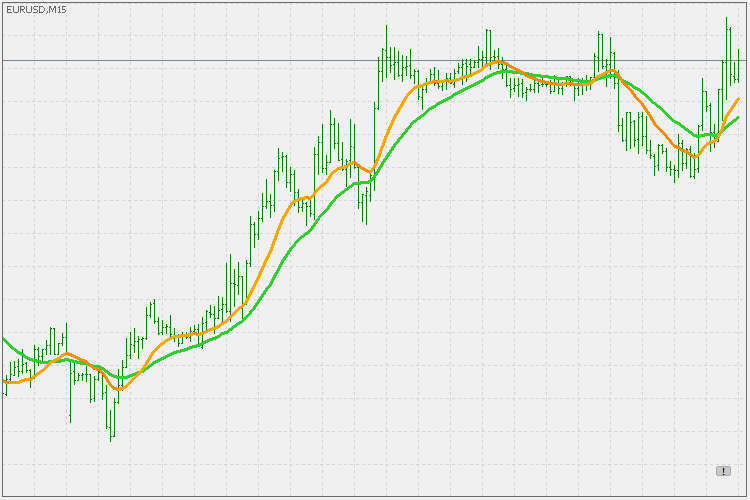
What might be obscure are the variance and mean parameter.
In general both are affecting the "speed" of the PDFma. Variance can be used in a range from 0 to 1. the smaller the variance the "faster" (and less smooth) the PDFma is (lower example is using variance 1 for the green value and variance 0.5 for orange value).
Mean is doing similar, except it uses values in a range from -1 to 1. Lower example green is using mean value of 1 and the orange is using mean -1.
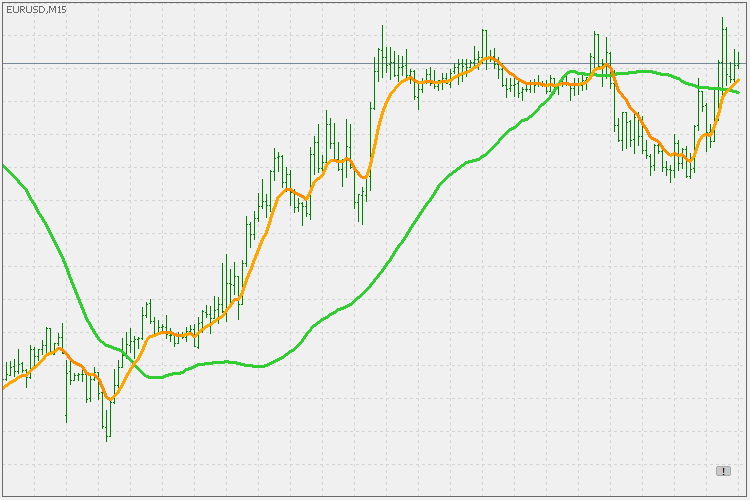
In any case there is a plenty of room for experimenting with this type of filter/average.
Elliot oscillator
Elliot oscillator indicator.
Recursive (double) smoothed stochastic
Recursive (double) smoothed stochastic - allows calculating double smoothed stochastic up to depth 15.
Balance of market power
Balance of market power (using improved Jurik filter for calculation).
AdxVma trend
AdxVma trend.