Join our fan page
- Views:
- 9931
- Rating:
- Published:
- Updated:
-
Need a robot or indicator based on this code? Order it on Freelance Go to Freelance
Demonstration of three-dimensional visualization possibilities in MetaTrader 5.
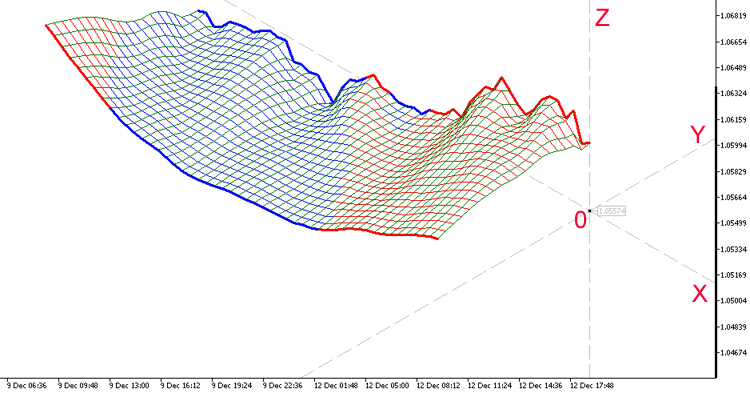
A surface is generated using a series of iMA indicators. The surface is displayed in a three-dimensional coordinate system.
The coordinate system can be rotated about the vertical Z axis by changing the slope of the X or Y axes. Moving the center of coordinates along the Z axis will change the coloring of the grid lines: red color — nodes are above the XY plane, blue means they are below the plane.

Fig. 1. Demonstration of the 3D Moving Average
Note:- Formation of a 3D surface requires some time.
- Select the minimum chart scale.
Translated from Russian by MetaQuotes Ltd.
Original code: https://www.mql5.com/ru/code/17183
 Fractal_WeightOscillator_HTF
The Fractal_WeightOscillator indicator with the timeframe selection option available in input parameters.
 Aroon oscillator 2
Aroon oscillator, next version.
 JK BullP AutoTrader
The Expert Advisor uses the iBullsPower (Bulls Power) indicator.
 Gandalf_PRO
The creation of the Expert Advisor stems from the topic "Neural networks - where to start studying them".