Join our fan page
- Views:
- 7607
- Rating:
- Published:
- Updated:
-
Need a robot or indicator based on this code? Order it on Freelance Go to Freelance
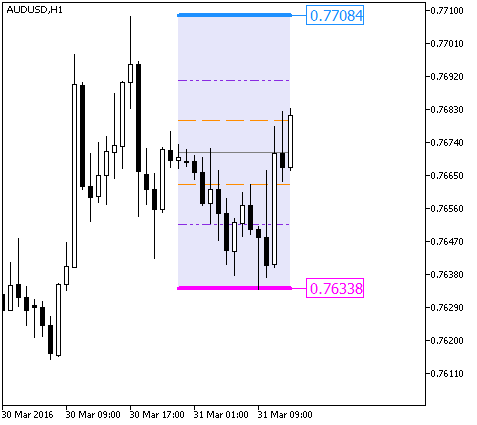
The indicator displays a price momentum for a symbol accompanied by Fibo retracement markup. Pink and blue lines are displayed on a chart, as well as Fibo retracement markup indicating a market entry direction. Sell if the price breaks through the lower line and buy if it pierces the upper one. The indicator works best on H1 and higher. Support/resistance lines are calculated as local extreme values per the number of bars defined by iPeriod input parameter.
input uint iPeriod=24; //price extremums searching period
The countdown for searching extreme values starts from the bar set in SignalBar.
input uint SignalBar=1; //bar index for searching extremums

Fig.1. ResSupFibo
Translated from Russian by MetaQuotes Ltd.
Original code: https://www.mql5.com/ru/code/15271
 ResSup
The indicator displays a symbol price momentum.
 Elliott_Wave_Oscillator_Sign
Semaphore signal indicator based on the Elliott_Wave_Oscillator indicator algorithm.
 AML_StDev_HTF
AML_StDev indicator with the timeframe selection option available in input parameters.
 Elliott_Wave_Oscillator_HTF_Signal
Elliott_Wave_Oscillator_HTF_Signal shows a trend direction or a signal for performing a deal generated by Elliott_Wave_Oscillator_Sign indicator at the chosen bar as a graphic object with colored trend indication or deal direction and sends alerts or audio signals in case of a market entry moment.