Join our fan page
- Views:
- 4426
- Rating:
- Published:
- Updated:
-
Need a robot or indicator based on this code? Order it on Freelance Go to Freelance
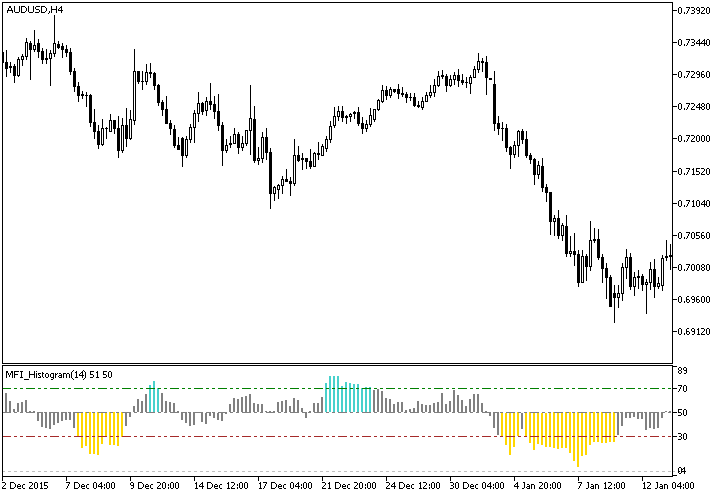
The classical MFI indicator implemented as a histogram with a color indication of entering the overbought and oversold areas.

Fig.1. The MFI_Histogram indicator
Translated from Russian by MetaQuotes Ltd.
Original code: https://www.mql5.com/ru/code/14932
 WPR_Histogram
The classical WPR indicator implemented as a histogram with a color indication of entering the overbought and oversold areas.
 DeMarker_Histogram
The classical DeMarker indicator implemented as a histogram with a color indication of entering the overbought and oversold areas.
 Stochastic_Histogram
The classical Stochastic Oscillator implemented as a histogram with a color indication of entering the overbought and oversold areas, as well as a colored cloud between the signal line and the oscillator to indicate the oscillator intersections.
 RVI_Histogram
The classical RVI oscillator implemented as a histogram with a color indication of entering the overbought and oversold areas, as well as a colored cloud between the signal line and the oscillator to indicate the oscillator intersections.