Join our fan page
- Published by:
- Yurij Izyumov
- Views:
- 30027
- Rating:
- Published:
- Updated:
-
Need a robot or indicator based on this code? Order it on Freelance Go to Freelance
Real author:
Profitrader, improvement by Tor.
In the futures markets the data on trade volumes is reported with a one-day delay. To compensate for this, many analysts use the tick volume indicator (tick volume™): it allows you to track volume changes during the trading day.
Tick volume indicates the number of deals concluded over a certain intraday period, but does not show the number of contracts per deal. Thus, it can make, for example, 50 deals per hour. But the number of contracts concluded for each deal is not clear from this figure. There could be, for example, 50 one-lot orders or 50 hundred-lot orders. From this point of view, the tick volume does not reflect the true volume. However, it is still a valuable indicator because it is the only one that allows you to measure the volume with less delay, although at the expense of accuracy.
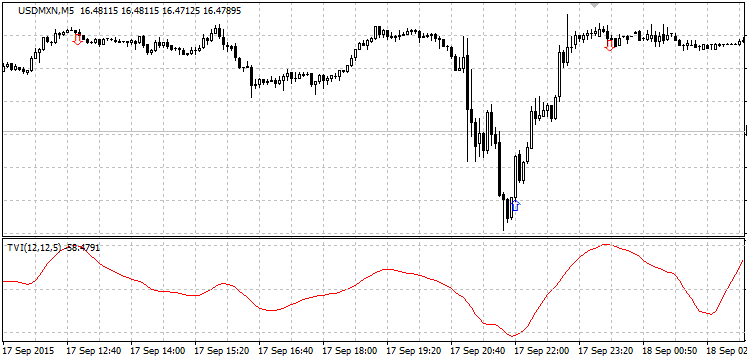
This is the main information on the TVI indicator, I had tinkered with it in many ways and found out how to use it. Because of this, Alerts and drawing arrows on the chart were added to signal the user about the possible entries.

Hints:
It can be used on the major currencies like this: turn on the М5 chart, then the indicator levels are levelUP = 4 and levelDOWN = -4, buy or sell according to them. It is recommended not to go against the trend too much, but in fact a lot of the signals turn out to be against the trend — the so-called corrections, and the indicator also determines the reversals. This can be seen on a history backtest.
For instance, to work with gold — XAUUSD — then on its M5 chart: levelUP = 40 and levelDOWN = -40 (the usual *10).
For the different timeframes the levels are individual. Using MM and averaging makes this a good system. Enter against the trend with caution.
Variables:
extern bool alerts = false;  // alert of supposed deals
extern bool play = false;    // sound notification
extern bool strelka = true;  // draw arrows or not
extern bool searchHight = true; // look for chart fractures
extern bool NaOtkrytieSvechi = true;  // on candlestick opening only
extern bool AllHights = false; // all fractures or (true) only the ones beyond the levels specified in the levelUP and levelDOWN settings
extern int barp = 0; // which candlestick to check: 0 or 1 (1 - not redrawn)
extern int levelUP = 4; // для золота *10
extern int levelDOWN = -4; // *10 for gold
Translated from Russian by MetaQuotes Ltd.
Original code: https://www.mql5.com/ru/code/13999
 Ticks collector
Collection of ticks with writing data to a file and plotting non-standard charts.
 Volatile action
The idea behind the Expert Advisor is based on the volatility explosion in the pulse waves.
 ZigZag Signal
Signal based on the ZigZag indicator.
 ConvertTicksFile
The converter of the tick files created with the Ticks collector into different data representation formats.