Join our fan page
- Views:
- 8191
- Rating:
- Published:
- Updated:
-
Need a robot or indicator based on this code? Order it on Freelance Go to Freelance
Real author:
HgCl2
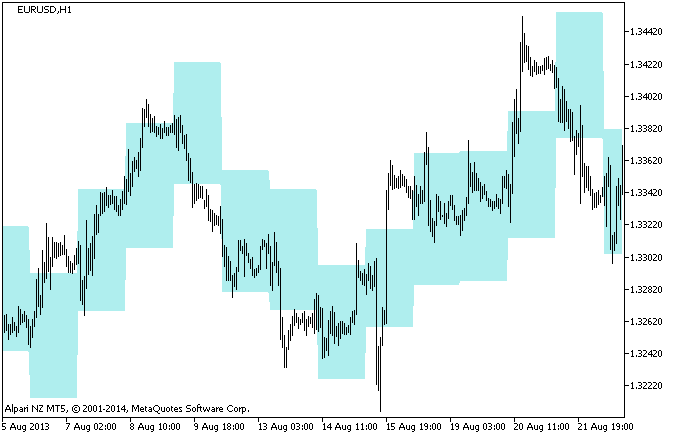
The indicator utilizes the idea of adding to a bar open time the value equal to the average minimum swing from the open price for a few days or weeks, and the standard deviation from the average swing multiplied by a coefficient to determine the possible resistance level. It's vice versa for the support level.
The minimum swing relative to the open price of a day or week is the lowest of the distances High - Open and Open - Low.
Resistance level of the indicator is:
R = Open - k * AV - k_std * Std;
where:
- AV is the average minimum swing from the open price for a few days;
- k - coefficient of the average minimum swing;
- Std - standard deviation from this minimum swing;
- k_std - multiplier coefficient. (is available in the indicator settings).
For the support level:
S = Open + k * AV + k_std * Std;
In contrast to the methods of finding support and resistance levels using GSV ('Long-Term Secretes to Short-Term Trading' by Larry Williams, chapter: 'Greatest Swing Value'), all minimum swings of 4 and 9-day or week bars are used in calculation without separating divergent bars.
The mean swing value and its standard deviation are calculated separately for the period defined in the input parameters, and at the end of calculation the indicator selects the largest sum of the average swing and standard deviation multiplied by the coefficient. This ratio can be modified in the indicator settings window (the default is one, which means that one standard deviation is added to the mean minimal swing as a filter).
In this indicator version you can set any period. It also includes a built-in filter of weekend bars, i.e. weekend bars are combined with Monday bars. The S and R levels for Monday are calculated relativ eto the open price of the weekend bar. If Monday's low is below the weekend bar's low, the Monday's low will be used in calculations, and vice versa. Similarly, for Monday's and weekend bar's highs.
The original indicator was developed in the MQL4 language and published in the CodeBase on 26.08.2013.

Figure 1. The SRm_Cloud indicator
Translated from Russian by MetaQuotes Ltd.
Original code: https://www.mql5.com/ru/code/11320
 SR_Cloud
The indicator utilizes the idea of finding possible resistance and support levels, similar to the use of GSV.
 RD-ForecastOsc_HTF
The RD-ForecastOsc indicator with the timeframe selection option available in input parameters.
 CHOWithFlat
Chaikin Oscillator with the market flat state detection option.
 CHOWithFlat_HTF
The CHOWithFlat indicator with the timeframe selection option available in input parameters.