Anchored VWAP Pullback and Target Zones | Multi-Timeframe & Scanner - Understanding the Logic and How to Use It

1. Indicator introduction
A pullback becomes meaningful when you understand where price is retracing, whether the preceding move had enough strength, and whether price has resumed in the trend direction. Anchored VWAP Pullback and Target Zones connects these elements on one chart: a value line anchored to swing structure, filtered BUY/SELL signals, and an Entry–SL–TP price ladder for tracking what follows a signal.
Rather than treating every touch of a line as an entry, the indicator looks for a pullback after a sufficiently large impulse, waits for price to reclaim AVWAP, and then evaluates setup quality. The Scanner helps monitor multiple symbols and timeframes; Multi-TF lets you reference a selected timeframe on your current chart.
View the details and download the indicator for your platform:
- Download Anchored VWAP Pullback and Target Zones for MT5
- Download Anchored VWAP Pullback and Target Zones for MT4
2. Understanding the logic and reading the indicator
2.1. AVWAP: a value reference starting from a meaningful swing
AVWAP is a weighted average price calculated from an anchor point. The indicator automatically finds swing lows for the bullish side and swing highs for the bearish side; no manual anchor placement is needed. Structural Anchor Swing Lookback (bars), set to 10 by default, determines the number of bars on each side used to confirm a swing. Because subsequent bars are required, a swing is recognized only once confirmation data is available, rather than as soon as a high or low forms.
Each bar's representative price is the average of High, Low and Close. Weighting uses the activity source selected in Applied Volume (Logic and MA/VWMA), with Tick Volume as the default. When usable activity data is unavailable, the logic substitutes the bar's range relative to ATR as a weight. This AVWAP should therefore not be interpreted as the average execution price of the entire market.
With default colors, bullish AVWAP is mint green and bearish AVWAP is rose pink; the two thinner surrounding lines show the value bands. Band width depends on price dispersion from the anchor and the selected filter mode, with a minimum width to prevent excessive contraction. The indicator can replace an anchor when structure changes, the pullback quota is exhausted, or a continuation swing qualifies. An anchor is also invalidated when the close crosses its price or moves too far in the adverse direction.
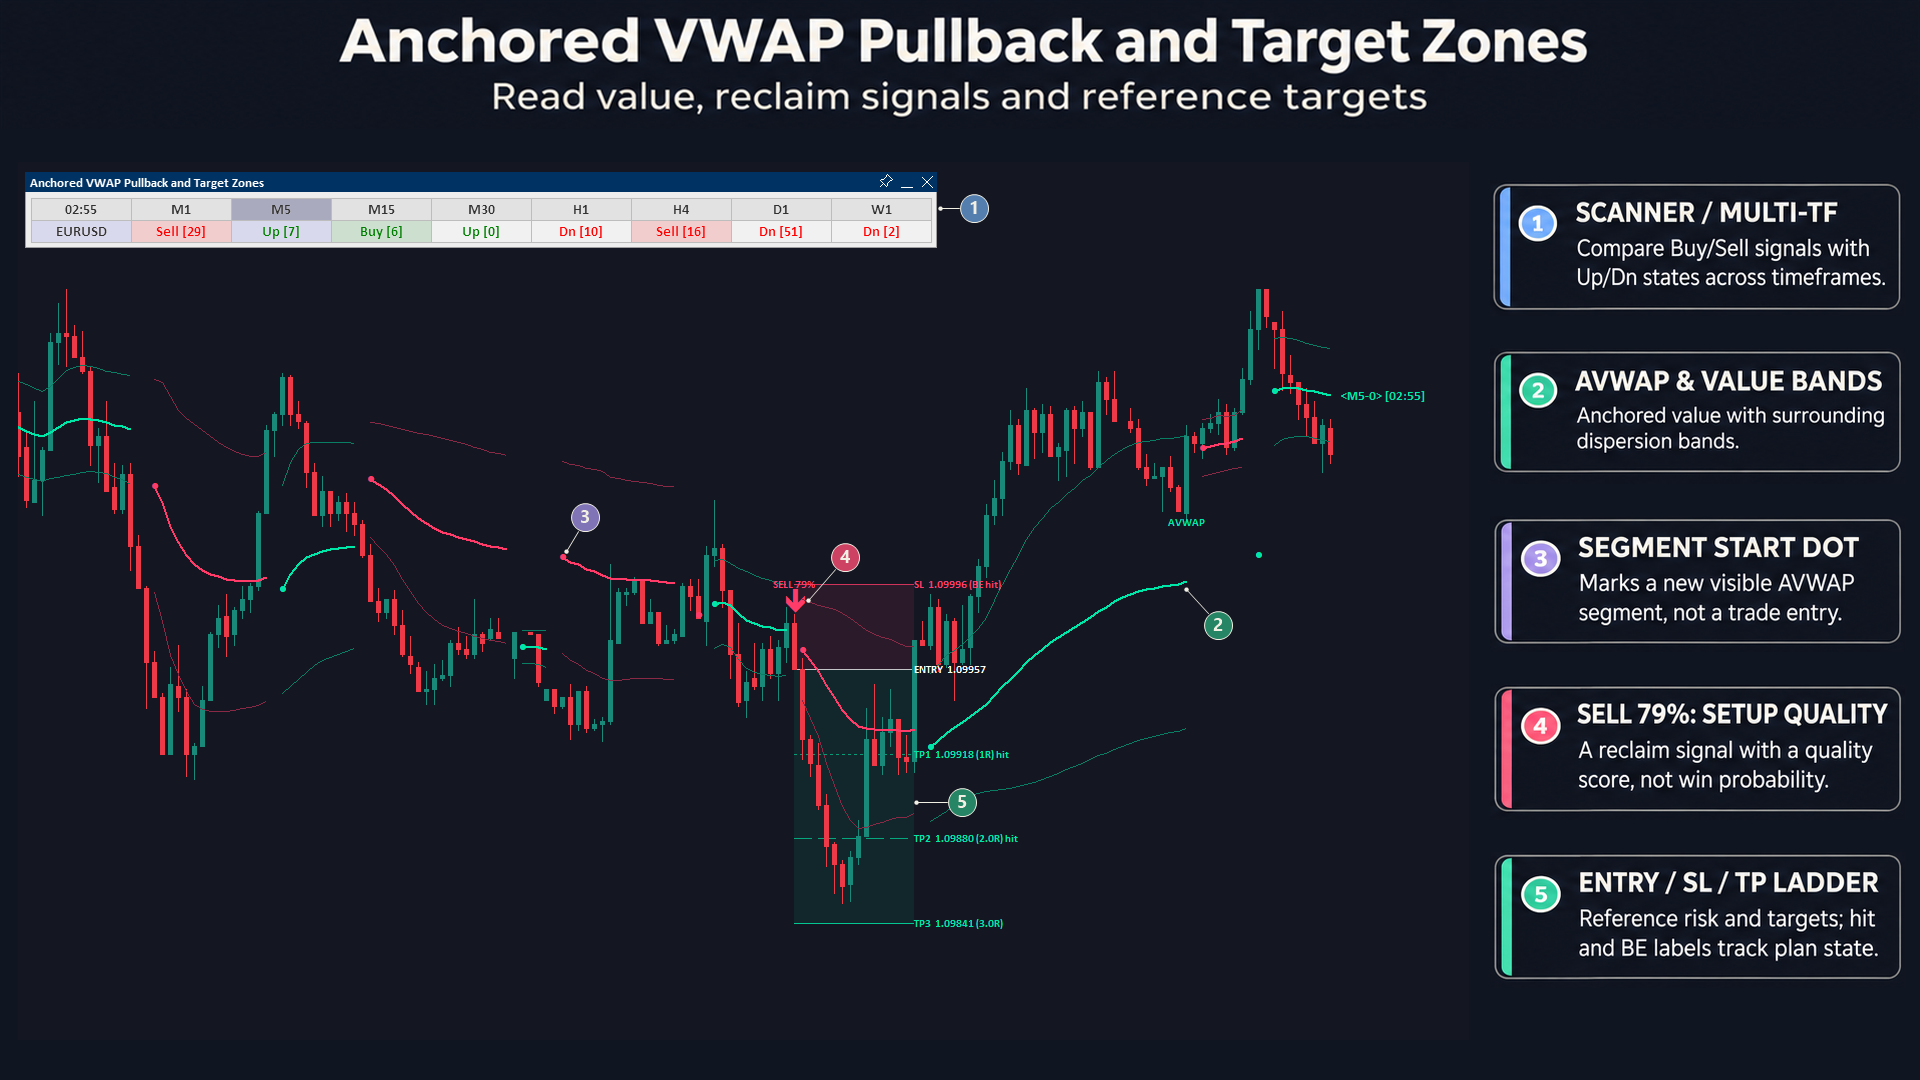
Bullish Dot/Bearish Dot marks the start of a displayed AVWAP segment. A dot helps identify a new line segment; it is a state marker rather than a BUY/SELL entry signal, and does not necessarily identify every anchor replacement.
2.2. BUY/SELL signals: wait for a pullback and an AVWAP reclaim
A BUY setup follows this sequence:
- A bullish anchor remains valid and the upward impulse meets Min Impulse Expansion (ATR), set to 1.40 ATR by default. The number of pullbacks used at the anchor remains below Max Pullbacks Per Trend Anchor, which defaults to 2.
- Price retraces into the value area around AVWAP, still closes above the anchor price, and remains within the filter mode's defensive boundary. The pullback is recorded while the bar has not revisited the impulse high.
- A bullish candle closes back above AVWAP, with its close at least equal to the previous bar's high minus 0.20 ATR.
- The setup passes trend efficiency, quality, relative activity and pullback depth filters. Valid depth is 12%–85% of the impulse; an opposing decline of more than 3.6 ATR over 5 bars, together with a bearish current candle, blocks BUY.
SELL uses the mirrored conditions: a bearish anchor, a sufficiently large downward impulse, a retracement into value, and a bearish candle closing below AVWAP, with its close no higher than the previous bar's low plus 0.20 ATR. The corresponding filters block SELL during an opposing upward surge with a bullish current candle. The indicator does not create another same-direction plan while one remains active; a valid opposite signal can close the previous plan and open a new one.
The BUY arrow sits 0.20 ATR below the bar's low and the SELL arrow 0.20 ATR above its high. Show Filtered (SKIP) Pullbacks displays reclaim candidates rejected by the filters; SKIP is not an opposite-direction trade signal.
2.3. What do BUY/SELL percentage labels actually mean?
The number beside BUY/SELL is a setup quality score on a 0–100 scale. It combines the close's position within the candle range (40%), trend movement efficiency (35%), and relative activity (25%). A candle closing near its favorable extreme, more direct price movement, and stronger activity generally improve the score.
For example, SELL 79% means the sell setup scores approximately 79/100 under this calculation. It is not a 79% win probability, a proportion of sellers, or the filter mode's historical win rate.
Show BUY/SELL Quality Labels toggles the labels; Recent BUY/SELL Labels (0 = all) limits the most recent labels, with the default 0 showing all signals within the processed data. BUY/SELL Label Distance (ATR) defaults to 0.45 to separate labels from arrows. These options control label display without changing signal conditions.
2.4. Choosing a suitable Pullback Filter Mode
Pullback Filter Mode controls pullback area width, efficiency and quality thresholds, and some risk parameters. The modes do more than change arrow frequency:
| Mode | Approach |
|---|---|
| Auto-Optimize | The default. Compares closed-plan statistics for the presets on chart data, using win rate and cumulative R within its built-in selection priorities. The selected mode can change as new outcomes become available. |
| Balanced / Conservative / Aggressive | Presets with balanced, more selective or more flexible thresholds for the value area, efficiency and minimum quality. |
| Shallow Pullback / Deep Value Reclaim | Focus on shallower pullbacks or deeper value areas through their own threshold sets. |
| Volume Climax | Requires relative activity of at least 1.25 times its reference level, alongside the preset's other filters. |
| Custom Thresholds | Uses Custom Min Trend Efficiency (%) and Custom Value Band Width (Sigma), defaulting to 26% and 1.00. These Custom values do not override every other preset. |
Auto-Optimize adapts to internal statistics on loaded data; it does not validate future performance. When Auto changes presets, the value bands and displayed ladder history may change with the selected preset. Signal quality labels are managed separately from the historical ladder count.
2.5. Entry, SL and three target levels
Each valid signal creates a reference plan: Entry at the signal bar's close, and SL derived from the pullback extreme and value boundary with an ATR buffer. Stop Loss Buffer Beyond Pullback (ATR) defaults to 0.20; the effective buffer also depends on a preset multiplier. Risk distance is bounded relative to ATR, so the final SL does not necessarily equal the extreme plus the buffer exactly.
1R is the distance between Entry and the initial SL. In Fixed R Ladder mode, TP1/TP2/TP3 are 1R/2R/3R respectively. The default R Ladder + Impulse High/Low Magnet mode may move TP2 or TP3 to the previous impulse high/low when it falls within the appropriate R interval; MAG identifies a structure-adjusted target. These targets are reference levels, not a guarantee that price will reach them.
Move Stop to Breakeven After TP1 is enabled by default: after TP1 is touched, the logic tracks the active stop at Entry. The SL line remains at the initial stop price; the (BE) or (BE hit) label indicates breakeven status, so that line should not be read as a stop order automatically moved in your account. The word hit marks targets touched according to bar data.
Plan tracking begins on the bar after the signal and can end at SL/BE, TP3, an opposite signal, or a 60-bar timeout. When one bar touches both the active stop and a target, the logic checks the stop first. This is price-based state tracking; the indicator does not place or manage live orders.
2.6. Keep the chart clear while retaining useful history
- Keep Historical Trade Plans is off by default. When enabled, it retains ladders for the selected preset; Historical Ladders (0 = all) defaults to 3, while 0 removes this option's ladder count limit.
- Only Show Active Ladder When History Is Off applies only when history is off. Enable it to see only an active plan; disable it to keep viewing the latest ladder after its plan ends. When history is on, the history settings take precedence.
- Maximum Boxes/Lines/Labels (0 = unlimited) independently limits drawing counts. Positive limits can reduce displayed objects even with ladder count 0; the available history also depends on Maximum bars to process (0 = all available bars), set to 10000 by default.
3. Scanner and Multi-TF
The Scanner summarizes states across multiple symbols and timeframes so you can identify charts worth examining. Distinguish Buy/Sell from Up/Dn: Buy/Sell corresponds to reclaim signals; Up/Dn corresponds to the start of bullish/bearish AVWAP segments. These represent different types of information.
Multi-TF lets you select a calculation timeframe to display on the current chart and use separate parameters per timeframe when needed. Lines, bands and signal markers provide context; the statistical values in the Data Window apply to the current timeframe. There is no requirement for every timeframe to show the same signal.
For shared setup and operation instructions, see the Multi-TF and Scanner User Guide.
4. Using the indicator with Scanner and Multi-TF
- Read the context first: identify the bullish or bearish AVWAP segment and price's position relative to value. A new dot marks a line segment's start; it does not replace BUY/SELL conditions.
- Examine the pullback: locate the preceding impulse, retracement into value and reclaim candle. Use the quality score to understand the setup rather than as a promise about its outcome.
- Read the plan in R: consider Entry, initial SL, targets and hit/BE status together. Compare them with current price and actual trading conditions before making your own decision.
- Use the Scanner to choose charts to inspect: separate Buy/Sell signals from Up/Dn states; use Multi-TF for context from other timeframes instead of relying on a single table cell.
- Configure alerts and history: the two BUY/SELL alerts reference closed bars. Enable alerts for the current symbol and Enable alerts for all Scanner symbols are separate controls. Signals on a live bar can still change; an unfinished higher-timeframe bar can also update. Choose ladder and label counts that keep the chart readable.
Download the indicator and explore AVWAP pullback reading on your preferred platform:
- Download Anchored VWAP Pullback and Target Zones for MT5
- Download Anchored VWAP Pullback and Target Zones for MT4