Trinity Reversal Pattern Multi-Timeframe & Scanner - Understanding the Logic and How to Use It

1. Introducing Trinity Reversal Pattern Multi TF Scanner
A change in candle color alone does not explain how price pressure is shifting. Trinity Reversal Pattern Multi TF Scanner helps you examine that shift through a three-candle structure: two candles in the same direction, a movement in highs and lows, followed by a reversal candle that exceeds the first candle's extreme.
The indicator combines Buy/Sell arrows, a Strength score, price levels and an optional MA filter. Scanner and Multi-TF let you monitor this structure across symbols and timeframes, then open a chart to examine price reactions in context.
View the details and download the indicator for your platform:
- Download Trinity Reversal Pattern Multi TF Scanner for MT5
- Download Trinity Reversal Pattern Multi TF Scanner for MT4
2. The Logic and How to Read the Indicator
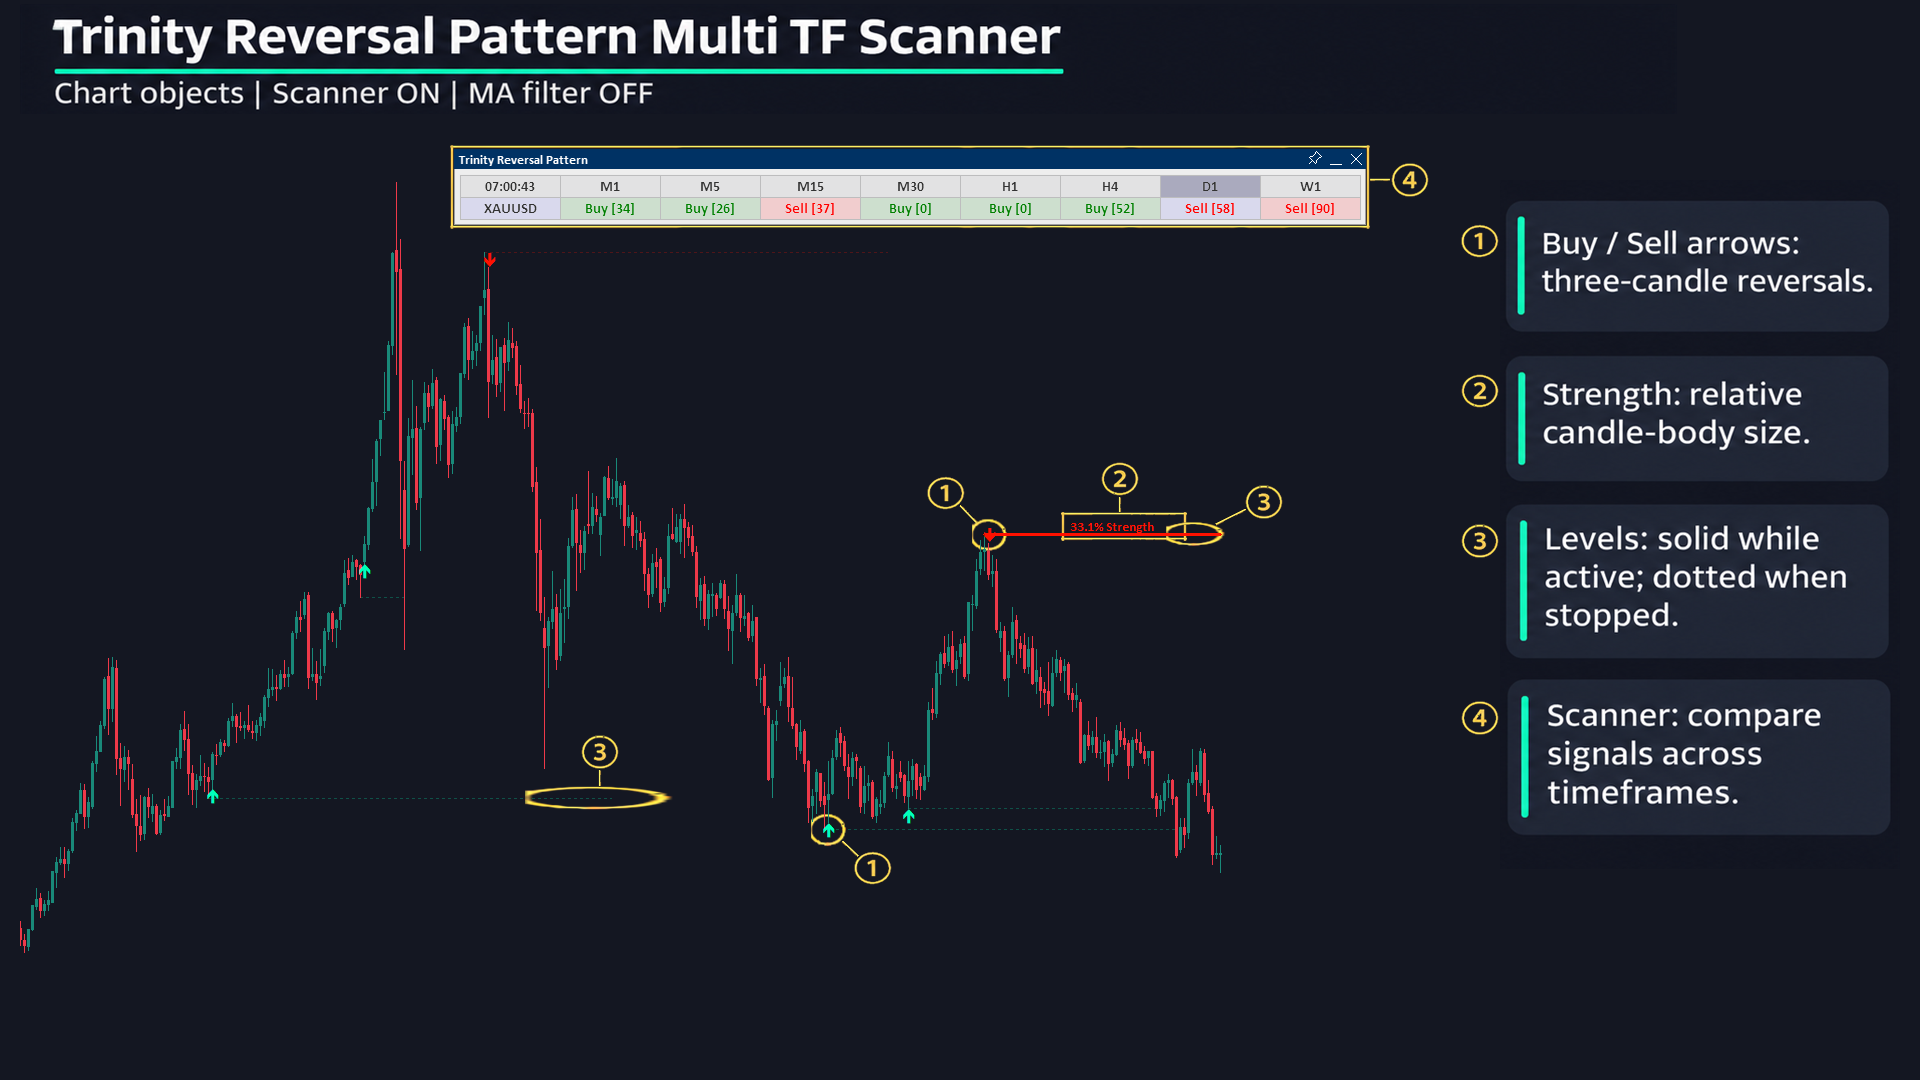
2.1. What You See on the Chart
| Component | How to read it with the default settings |
|---|---|
| Buy/Sell arrows | A mint Buy arrow below the candle; a red Sell arrow above it. An arrow marks a valid pattern after the Strength threshold and the MA filter, when enabled, have been applied. |
| Active level | A solid horizontal line at the three-candle low or high, extending while the level remains under observation. |
| Strength label | The reversal candle's body strength as a percentage, shown on the active level. The score is stored with the signal that created the level. |
| Stopped level | A thinner, dotted and more transparent line ending at the candle that touched the level or triggered expiry. The Strength label is removed. |
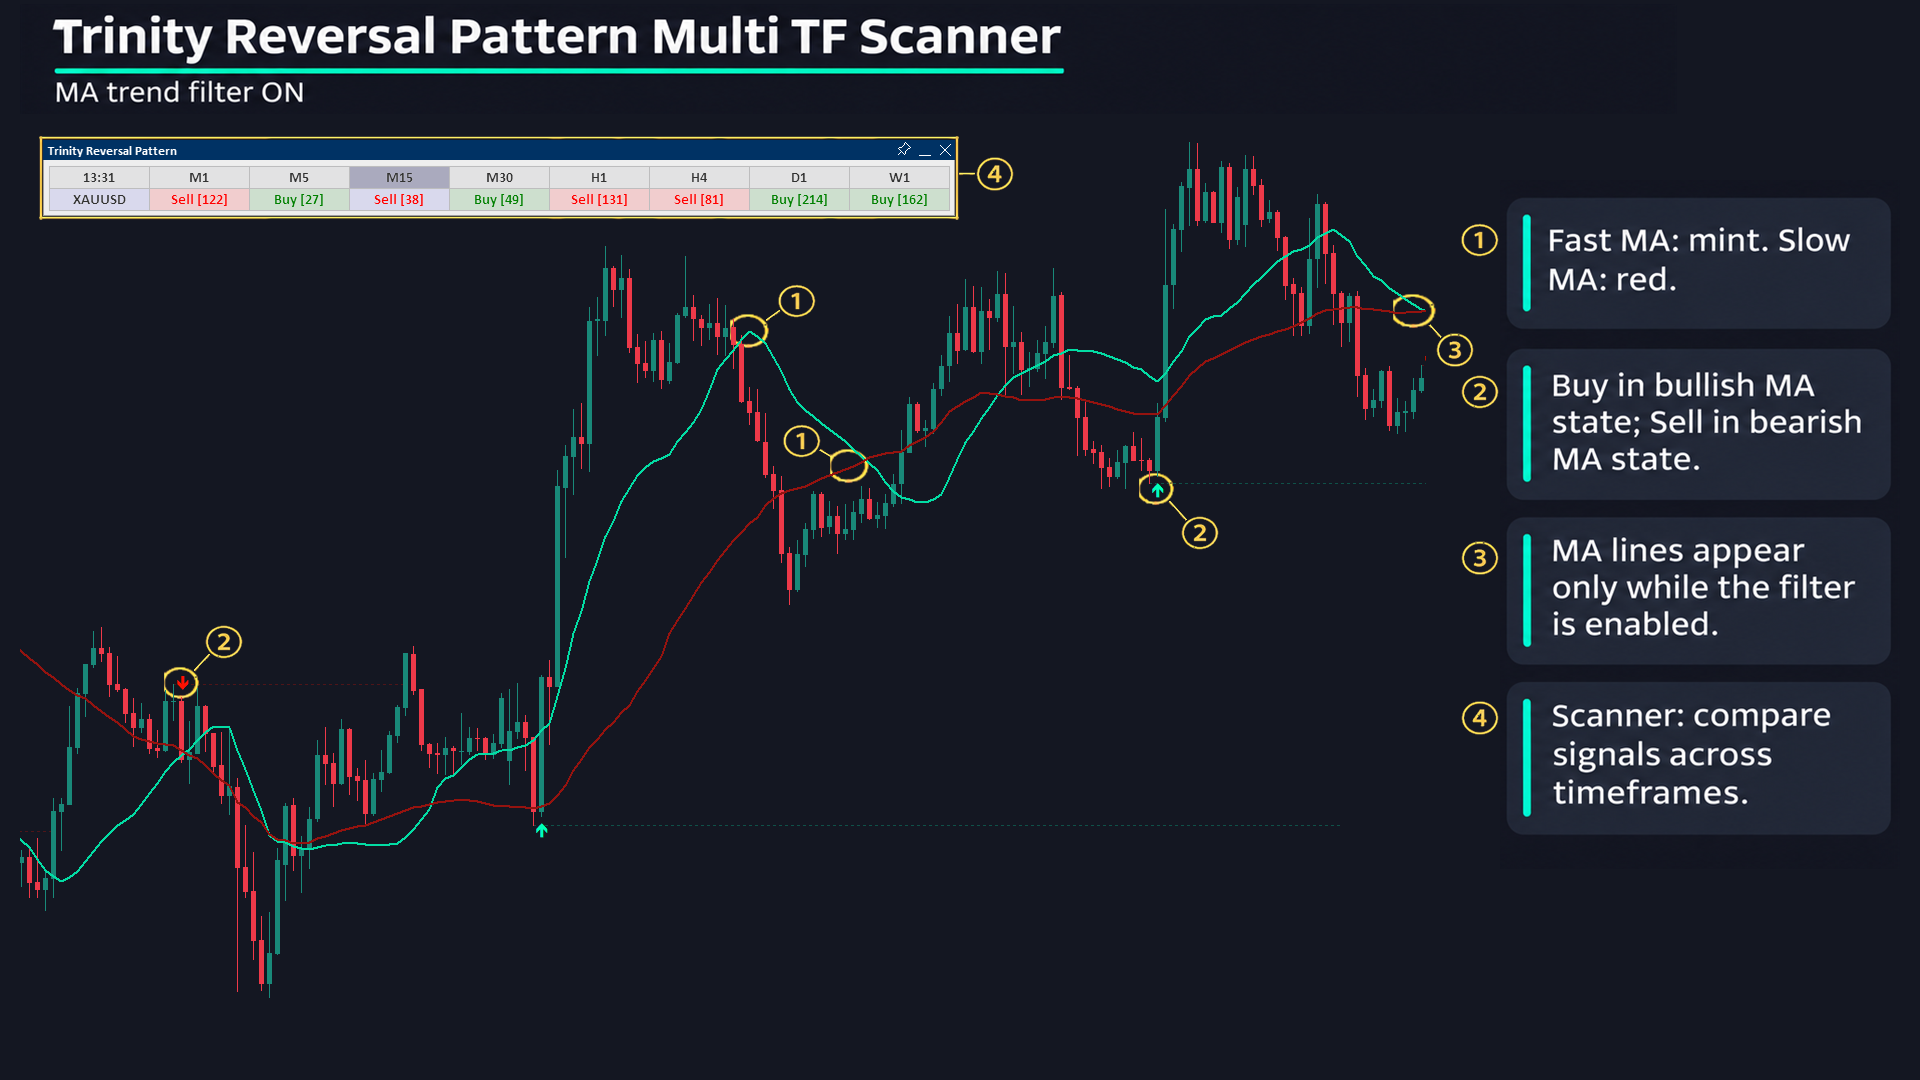
| Fast MA and Slow MA | The defaults are EMA 21 and EMA 50 on Close. They appear only when Use MA Trend Filter and their respective Show options are enabled. |
Colors, symbols, text size and line properties are customizable. Hiding arrows does not change the pattern detection conditions.
2.2. The Buy Pattern: Two Bearish Candles and a Bullish Candle Exceeding the High
Call three consecutive candles, in chronological order, A, B and C, with C being the signal candle. The bullish pattern requires all of the following:
- A and B are both bearish, meaning their closing prices are below their opening prices.
- B has a lower low and a lower high than A.
- C is bullish and has a high above A's high.
This structure describes a downward move that makes a lower low, followed by a bullish candle reaching above the first candle's high. A Buy is recorded only when Strength meets the threshold and, if the filter is enabled, the MA state allows the bullish direction.
The high-break condition uses C's High; C's Close does not have to be above A's high. High/low comparisons require an actual exceedance; merely matching the price does not satisfy the pattern condition.
2.3. The Sell Pattern: The Bearish Mirror Structure
The bearish pattern uses the same A, B and C candles with the conditions reversed:
- A and B are both bullish.
- B has a higher high and a higher low than A.
- C is bearish and has a low below A's low.
A Sell appears when this pattern also passes the Strength threshold and the bearish filter, if enabled. As with Buy, the low-break condition uses C's Low; C's Close does not have to be below A's low. A candle with equal Open and Close is neither bullish nor bearish for these conditions.
2.4. What Does Strength Measure?
Strength compares the length of C's body with the largest candle body within Strength Lookback (bars), including C. A candle body is the absolute distance between Open and Close, excluding the wicks.
Strength = C's body / largest body in the window × 100%.
For example, if C's body measures 8 price units and the largest body in the window measures 20, Strength is 40%. With Minimum Signal Strength (%) set to 50, the pattern does not generate a signal; with the threshold at 40, it passes the score condition.
The defaults are a 100-candle lookback and a 0% minimum threshold. Raising the threshold requires the reversal candle to have a relatively larger body compared with the reference history. Strength measures relative candle-body size; it is not a win probability or a statistical confidence level for the signal.
2.5. The MA Filter: Selecting the Permitted Pattern Direction
Use MA Trend Filter is off by default. When off, the indicator considers both Buy and Sell patterns according to price structure and Strength. When enabled, Buy patterns are accepted only in the bullish MA state, and Sell patterns only in the bearish MA state.
The state switches to bullish when the fast MA crosses above the slow MA, switches to bearish when it crosses below, and persists until the next directional change. At initialization, the relative positions of the two MAs determine the initial direction when possible. A temporary equality between the MAs does not by itself create a new direction-change signal.
The defaults are EMA 21 / EMA 50 on Close. You can change the periods, each MA's method and the price source through Fast MA Length, Slow MA Length, Fast MA Method, Slow MA Method and MA Applied Price. MA Applied Volume (VWMA) selects the volume source when using VWMA; it is not a separate volume filter for the three-candle pattern.
The two MA lines appear only when the filter is enabled and the corresponding Show Fast MA line or Show Slow MA line option is on. Hiding a line with Show affects its display only; that MA continues to participate in the filter.
2.6. Price Levels: Creation, Touch and Expiry
Each valid signal creates a fixed level: Buy uses the lowest low of A, B and C; Sell uses their highest high. The line starts at the candle containing that extreme and carries the signal candle's Strength score.
- Active: the level extends forward. Active Level Extension (bars), default 5, controls the visual extension, not the expiry period.
- Level touch: monitoring starts with the candle after the signal candle. A Buy level stops when Low touches or falls below its price; a Sell level stops when High touches or rises above its price.
- Expiry: if untouched, the level stops when its age reaches Level Expiry Bars, default 100 candles from the signal candle. If a touch and the expiry age occur on the same candle, the event is classified as a touch.
- After stopping: the line no longer extends and becomes dotted and more transparent according to Inactive Level Transparency (%), default 75. Its Strength label is no longer displayed.
Maximum Stored Levels (0 = unlimited), default 500, limits the combined number of active and stopped levels. At capacity, the indicator first removes the level that stopped earliest; if every level is still active, it removes the oldest active level. Set 0 to prevent removal due to storage capacity; touch and expiry conditions still apply. A level removed from the stored list is no longer monitored for these events.
A level is a reference for observing price reactions. Touching a level does not itself create a new Buy/Sell signal.
2.7. Alerts and Signals on the Open Candle
The indicator provides 7 alert types: Buy, Sell, bullish level touched, bearish level touched, level expired, MA cross up and MA cross down. The two MA-cross alerts require Use MA Trend Filter to be enabled. Event alerts read conditions on the most recently closed candle of the timeframe being evaluated.
The individual alert-type switches are on by default, but Enable alerts for the current symbol and Enable alerts for all Scanner symbols are off by default. Enable the scope you want to monitor; platform messages, push notifications, email and sound are selected in Alert delivery.
Arrows, Strength and level states on the open candle can change before that candle closes. Distinguish developing information from signals on closed candles, especially when reading a higher timeframe.
3. Scanner and Multi-TF: Monitor Broadly, Inspect the Relevant Chart
Scanner helps monitor signals across symbols and timeframes in one workspace. You can choose the symbol-list source, use a custom list and allow chart changes when a Scanner cell is clicked. Show Scanner is off by default; enable it when you need the monitoring panel.
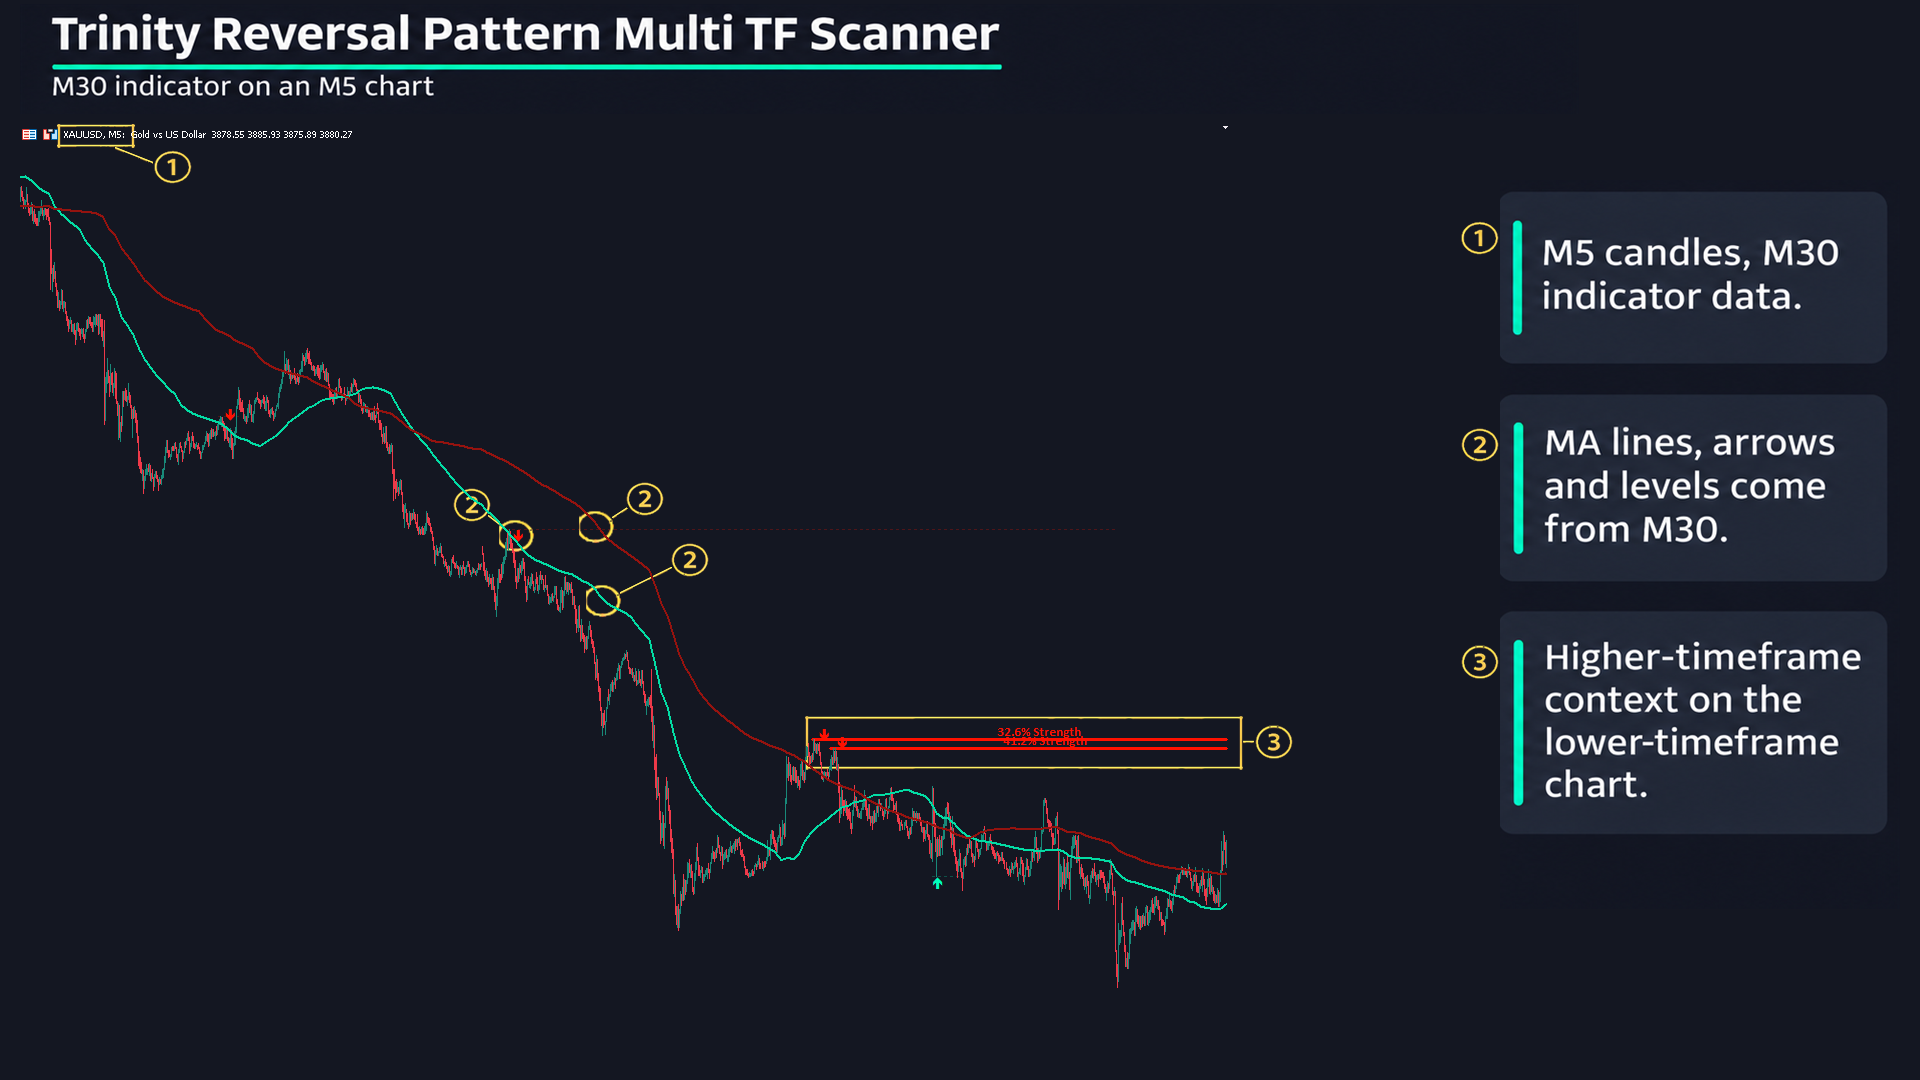
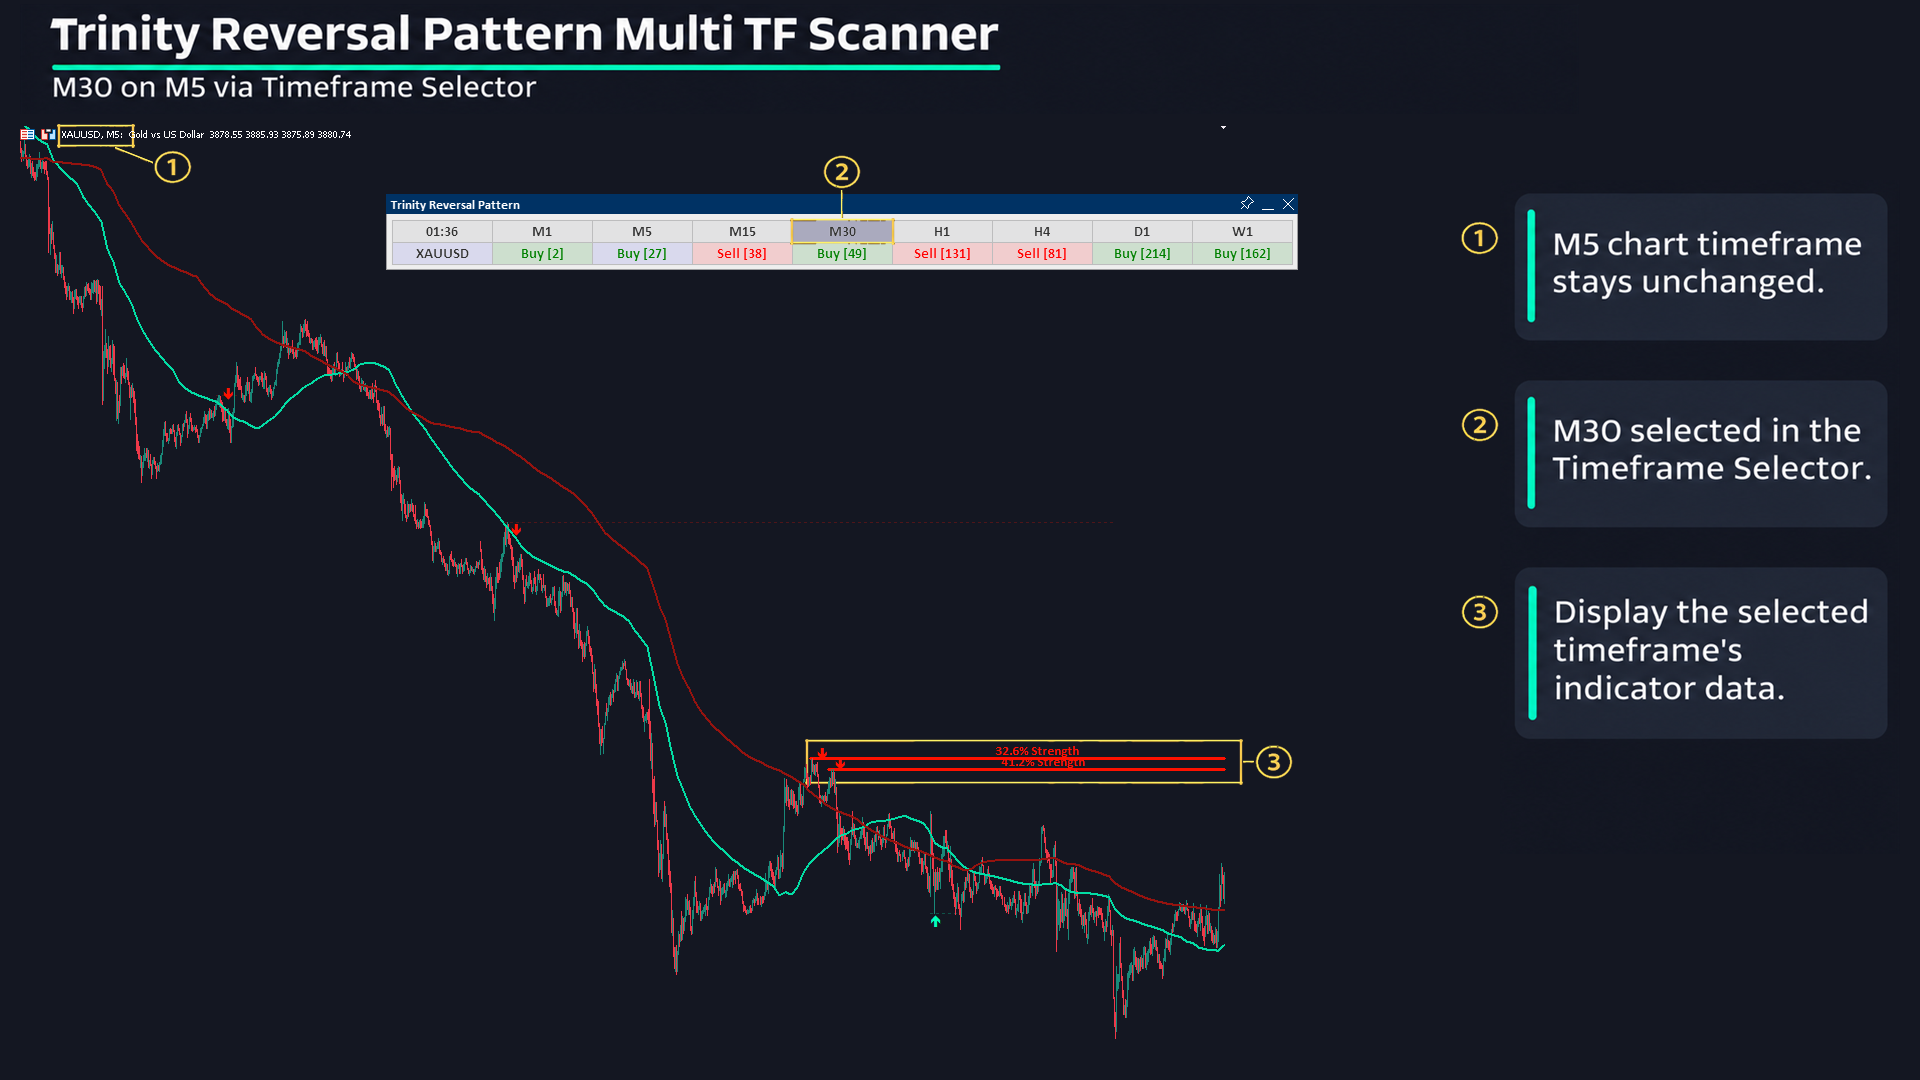
Multi-TF lets you view information from another timeframe on the current chart. Use separate parameters for each time frame supports different settings, such as Strength thresholds or MA periods, by timeframe. This changes the scope of observation; it does not turn patterns on different timeframes into the same signal.
For symbol lists, timeframes and common controls, see the Multi-TF and Scanner User Guide.
4. How to Use the Indicator with Scanner and Multi-TF
- Choose your observation scope. Follow one chart or enable Scanner for the symbols and timeframes you need. Use a higher timeframe for context, then inspect the three-candle structure on the timeframe under analysis.
- Read the pattern before the score. Check the A–B–C sequence, the extreme that was exceeded and the arrow direction. Then use Strength to understand how large C's body is relative to the reference window.
- Decide whether to use the filter. Leave it off to observe both pattern directions; enable it to retain patterns aligned with the MA state. There is no requirement for every timeframe to display matching arrows simultaneously.
- Follow reactions around levels. Distinguish active levels from stopped lines. A level-touch alert is a price-monitoring event, separate from an alert for a newly formed pattern.
- Check closed candles and alert settings. Use the chart to review the context behind a Scanner signal, paying attention to the candle's timeframe and which notification channels are enabled.
The indicator's value is its consistent presentation of price structure, candle-body strength and reference levels to monitor. Use this information alongside market context and your risk-management rules, rather than treating an arrow or a Strength percentage as a certain conclusion about what price will do next.
Explore and download the version for your platform:
- Download Trinity Reversal Pattern Multi TF Scanner for MT5
- Download Trinity Reversal Pattern Multi TF Scanner for MT4