Market structure on MT5: BOS, CHoCH, order blocks and fair value gaps explained

Price charts look chaotic until you give them a vocabulary. Market structure is one such vocabulary: a small set of terms that describe where price has been making higher or lower swing points, when that sequence breaks, and which price areas were left behind. This article explains the four terms you will meet most often on MetaTrader 5 charts - BOS, CHoCH, order blocks and fair value gaps - and then shows how an indicator can draw them without repainting.
1. Swing points: the raw material
A swing high is a candle whose high is higher than the highs of N candles on each side. A swing low is the mirror image. N is the "swing strength": a small value gives many small swings, a large value gives few significant ones. Everything else in this article is built on these points. Note that a swing point can only be confirmed N candles after it happened. Any tool that marks it earlier has to move or delete the mark later, which is what people call repainting.
2. BOS and CHoCH
BOS (break of structure) means a candle closes beyond the last swing high (in an up-trend) or the last swing low (in a down-trend), i.e. the trend continues. CHoCH (change of character) is the first break against the prevailing trend: in a series of higher highs and higher lows, the first close below the last higher low. A CHoCH is not a signal to trade; it only tells you that the sequence which defined the trend has been interrupted. Whether price then reverses or builds a range is open.
Two practical details matter. First, use a closing break, not a wick. A wick through a level is a sweep (see the next article in this series), a close beyond it is a break. Second, always state the timeframe: a CHoCH on M15 can sit inside a BOS on H4.
3. Order blocks
An order block is the last opposite-coloured candle before the move that caused a structure break. The idea is that the area may still hold unfilled orders. As a descriptive tool it is useful to track a block's state rather than to trade it blindly:
- Fresh - no later closed candle has traded into the block.
- Tested - price entered, but less than half of the block's height.
- Partial - a candle went at least halfway through.
- Broken - a candle closed beyond the far edge.
4. Fair value gaps
A fair value gap (FVG) is a three-candle pattern in which the wicks of the first and third candle do not overlap, leaving a price range that only the middle candle covered. The range is "open" until later candles trade back into it. Useful questions are: how much of the gap has been filled (the fill level), and did price close beyond its far edge? Gaps smaller than a fraction of the average true range are mostly noise, so a minimum size relative to ATR is a sensible filter.
How it looks on a chart
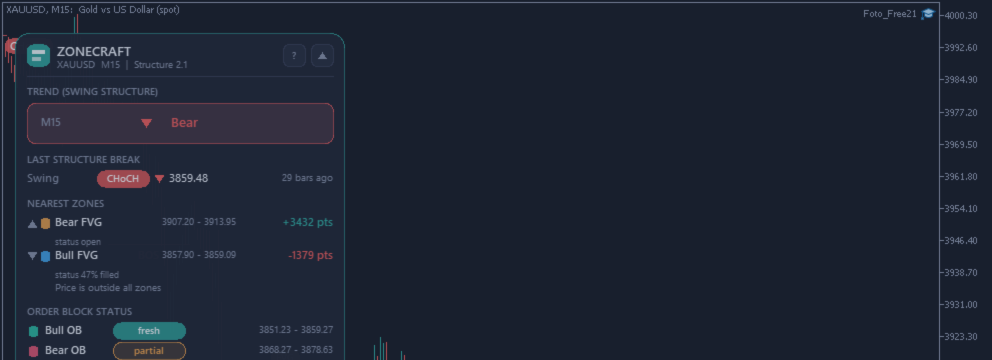
The indicator used for the charts below draws these elements from closed candles only. Each closed candle is processed once, in time order, so a label is never moved to another candle afterwards - only the state of a gap or block changes. The dashboard shows the trend of the chart timeframe, the last swing break with its age, the nearest open gaps with their distance and fill level, and the status of the latest bullish and bearish order block.
On this XAUUSD M15 example the trend row reads "Bear", the last break is a CHoCH, a partly filled bullish gap is marked with its fill percentage, and the order block lines show one fresh and one partial block. Everything on the dashboard can be reproduced by hand from the chart - which is the point: the tool saves clicking, not thinking.
The same logic on EURUSD H1. Higher timeframes give fewer, slower structure points; lower timeframes give more of them and more noise. Compare both before reading too much into a single break.
Swing versus internal structure
Structure exists on more than one scale. The swing level (strength 10 in the charts here) shows the larger moves. Smaller "internal" swings inside a leg are often drawn with a dashed line and a smaller label, and it helps to be able to switch each level off.
Limits you should keep in mind
- Structure describes what price has done. It does not predict what comes next.
- The result depends on the swing strength setting. There is no "correct" value, only one that matches the horizon you look at.
- Data quality matters: a broker feed with gaps or different session times changes what a swing looks like.
- Always test any tool on a demo account first.
About the charts
The charts in this article were made with my own indicator on a demo account. Nothing here is a recommendation of any product or broker.
Risk warning: This article is educational and describes a way of displaying past price data. It is not trading advice and no result is promised. Trading leveraged products such as forex and CFDs carries a high risk of losing more than you can afford.




