EQH EQL Liquidity Zones Multi TF Scanner - Understanding the Logic and How to Use It

1. Introducing the indicator
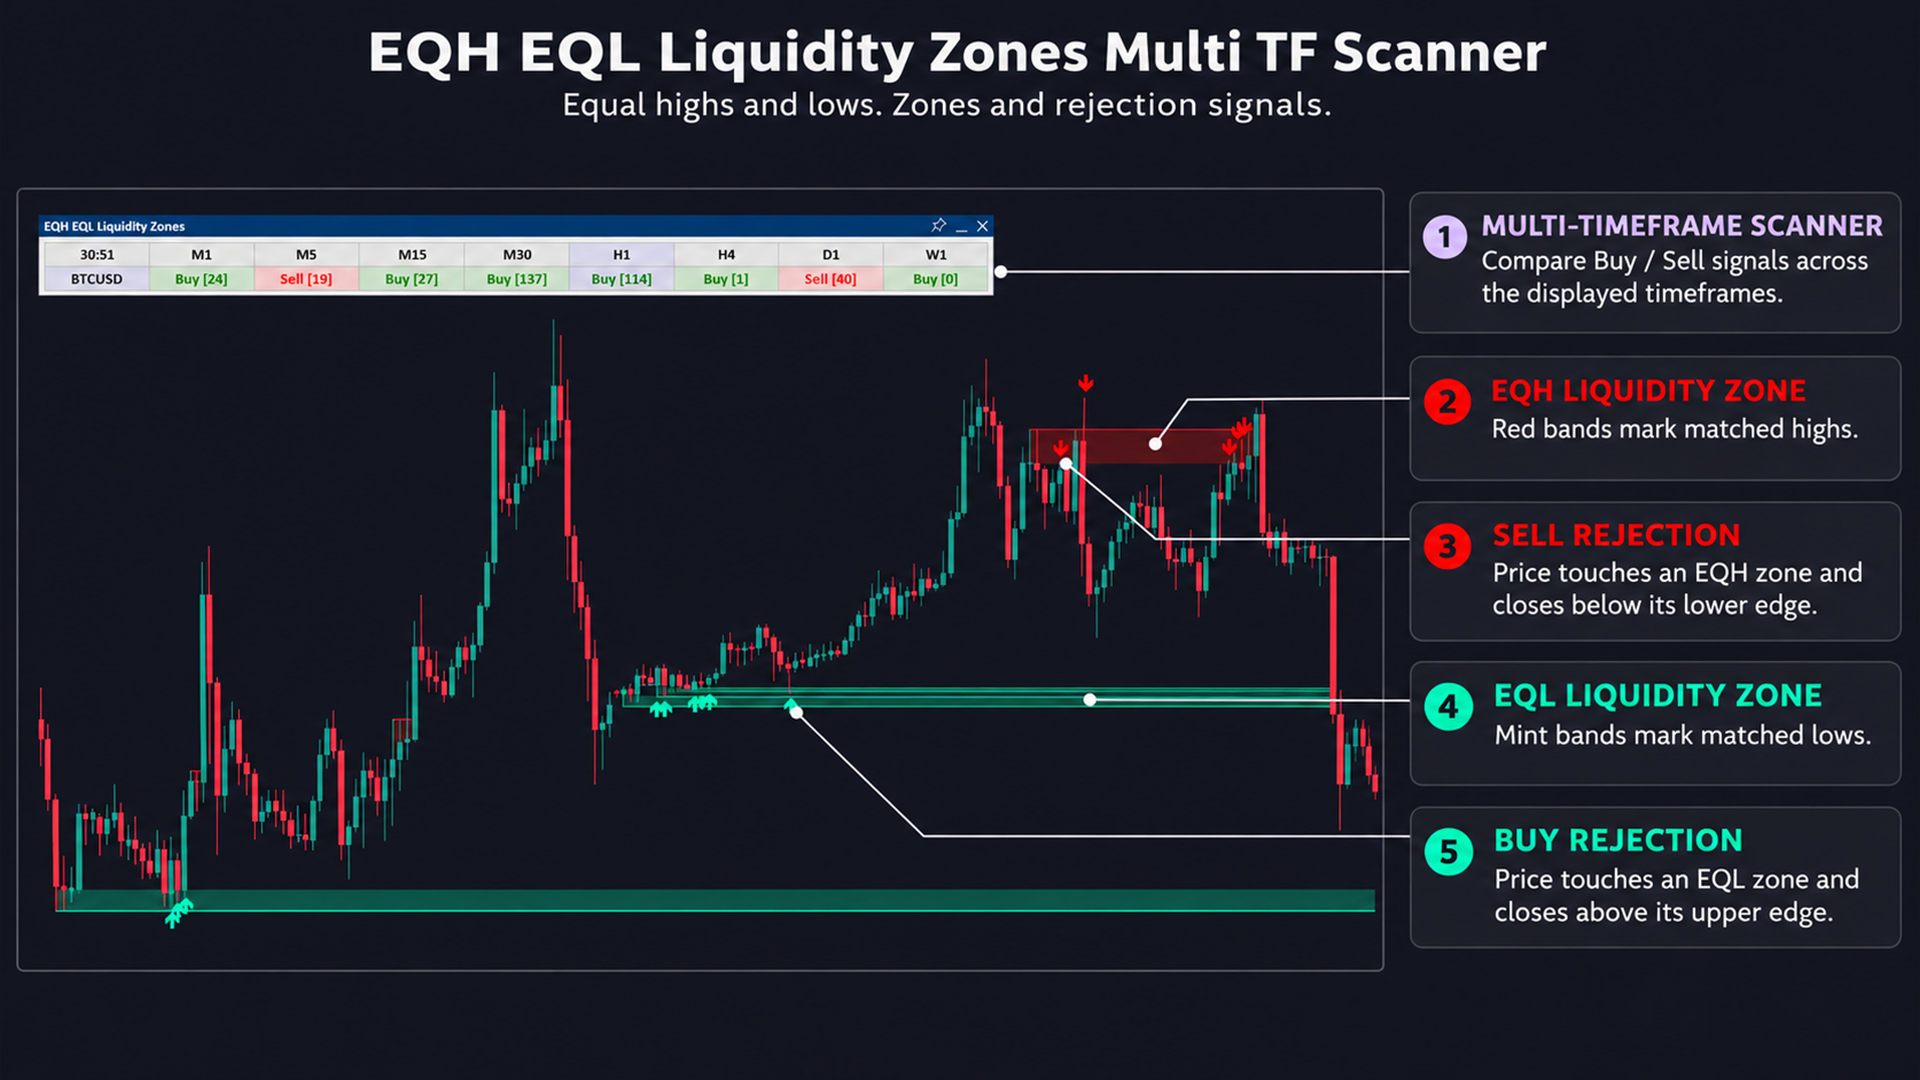
EQH EQL Liquidity Zones Multi TF Scanner helps you identify clusters of nearly equal highs or lows, track active price zones and observe reactions when price returns. Instead of marking only a single price level, it displays EQH/EQL zones together with formation, sweep and rejection events so you can distinguish what is happening.
EQH means Equal Highs; EQL means Equal Lows. These liquidity areas are inferred from price structure, rather than confirmed quantities of actual pending orders. The multi-symbol Scanner and Multi-TF features help you monitor these structures across your selected markets and timeframes.
View the details and download the indicator for your platform:
- Download EQH EQL Liquidity Zones Multi TF Scanner — MT5
- Download EQH EQL Liquidity Zones Multi TF Scanner — MT4
2. Understanding the logic and reading the indicator
2.1. Two ways to find nearly equal highs and lows
Adjacent candles: an EQH forms when the difference between two Highs is smaller than the matching threshold; an EQL uses the difference between two Lows. This branch does not require a pivot. Duplicate checks prevent a continuous sequence of nearly equal candles from recreating a zone on every candle.
Separated peaks and troughs: enabling Separated Peaks/Troughs adds a search for two pivots within Lookback. A pivot high must exceed every High in the chosen left and right windows; a pivot low must be below every corresponding Low. Pivot Left Bars and Pivot Right Bars default to 1/1. Increasing the right-side window delays pivot recognition.
The two pivots are paired only when their prices nearly match and intervening price structure leaves a clear path: all intermediate Highs must stay below both EQH endpoints; all intermediate Lows must stay above both EQL endpoints. The nearest valid pair is selected, with a default Lookback of 20 candles.
Equal Level Tolerance controls how closely the prices must match. The threshold is the moving average of candle-to-candle High/Low movement multiplied by tolerance; the default is EMA(500) × 0.05. A smaller tolerance requires closer levels, while a larger value accepts wider differences. MA Length and MA Method adjust this reference measure; MA Applied Volume (VWMA) selects the volume weighting when VWMA is used.
2.2. Where are the zone boundaries?
The zone comes from the two matching candles and has no fixed thickness:
| Zone | Upper boundary | Lower boundary | Default color |
|---|---|---|---|
| EQH | The higher High of the two candles | The highest Open/Close of the two candles | Red |
| EQL | The lowest Open/Close of the two candles | The lower Low of the two candles | Turquoise |
Thickness is the distance between the two boundaries. Tolerance determines whether two levels can be paired; it does not directly set zone thickness. EQH/EQL labels include the calculation timeframe, and zone colors can be adjusted independently of signal-arrow colors.
2.3. The RSI filter selects the formation context
With Filter by Overbought/Oversold enabled, an EQH requires RSI above EQH Overbought, while an EQL requires RSI below EQL Oversold. These independent thresholds default to 55 and 45; RSI Length defaults to 14 and RSI Applied Price to Close.
Adjacent pairs use RSI from the candle completing the pair. Pivot pairs use RSI and the matching threshold from the newer pivot candle, even though the zone is recognized after the selected right-side window. Disabling the filter allows otherwise valid pairs to be considered without an RSI condition.
2.4. Active, swept and expired zones
A zone starts at the first matching candle and keeps extending while active. Sweep Type determines when it stops extending:
- Wick: an EQH stops when High exceeds its upper boundary; an EQL stops when Low crosses below its lower boundary.
- Body: an EQH stops when Close exceeds its upper boundary; an EQL stops when Close is below its lower boundary. This is the default setting.
- Allow Rejection: with Body, two consecutive Closes beyond the outer boundary are required before stopping the zone. This option is not the on/off switch for rejection arrows.
Max Zone Age defaults to 1000 candles, measured from the first candle of the pair. Expired zones also stop extending, but expiry alone does not produce a sweep alert. Stopped zones may remain as history.
Max Stored Zones defaults to 200 and includes active and historical zones; a positive limit removes the oldest zones first. A value of 0 removes the stored-zone limit. Maximum zone lines and Maximum zone labels are separate display limits and also use 0 for unlimited.
2.5. When do Buy/Sell rejection signals appear?
Arrows mark a price-rejection response at a zone that already existed before the signal candle opened, rather than a signal generated merely because price touched a zone. Signals consider active zones or zones swept on that same candle; expired zones are excluded.
- Buy at EQL: the candle touches the zone and closes above its upper boundary. Either the signal candle's Open or the preceding candle's Close must not be below the EQL lower boundary.
- Sell at EQH: the candle touches the zone and closes below its lower boundary. Either the signal candle's Open or the preceding candle's Close must not be above the EQH upper boundary.
The zone must also meet Min Zone Age, which defaults to 3 candles. Age is measured from the first matching candle, not from zone confirmation; set 0 to disable the minimum-age filter. With Wick, one candle can both sweep a zone and produce rejection when it crosses the outer boundary and closes back on the appropriate side.
Disabling Show Buy Signal or Show Sell Signal hides only the arrows, not the underlying signal events. Zones and arrows can change on the open candle; alerts use the closed candle's result.
2.6. Six alert events to monitor
The indicator provides separate alerts for a new EQH, a new EQL, an EQH sweep, an EQL sweep, EQL rejection (Buy) and EQH rejection (Sell). Select the events and delivery channels you need: message, push, email or sound. Enable Enable alerts for the current symbol or Enable alerts for all Scanner symbols according to the scope you want to monitor.
3. Scanner and Multi-TF
The Scanner helps you monitor multiple symbols and timeframes in one place, find noteworthy signals and open a chart to inspect zones and price reactions. Multi-TF lets you refer to another timeframe on the current chart; you can share settings or use separate parameters for each timeframe, including tolerance, pivots, RSI and zone age.
Common setup, dashboard controls and notification settings are explained in the Multi-TF and Scanner User Guide.
4. Using the indicator with Scanner and Multi-TF
- Read the zone before the arrow. Identify active EQH/EQL zones and locate price relative to their two boundaries.
- Distinguish the events. Formation identifies a new structure; a sweep shows that price crossed the outer boundary; rejection shows a touch followed by a close back on the appropriate side. These events serve different purposes.
- Adjust the structure you want to observe. Use tolerance to control matching precision, pivot left/right windows to select the definition of a peak or trough, and Min Zone Age to filter reactions at very young zones. Different timeframes do not have to share the same settings.
- Use the Scanner to select charts for closer review. Compare your chosen symbols and timeframes, then inspect the chart and the closed candle. EQH/EQL zones provide part of the analytical context; they do not confirm what price will do next.
Explore the indicator and choose the version for your platform:
- Download EQH EQL Liquidity Zones Multi TF Scanner — MT5
- Download EQH EQL Liquidity Zones Multi TF Scanner — MT4