
The Hidden Cost of Gold Execution: Slippage — Your Broker Takes Your Money

Slippage on pending stop orders is a cost almost nobody notices, and few traders know its size. Measuring it is difficult: manually checking every fill against its requested price in the history is tedious. An EA can calculate it for you. Your profit depends on it: the worse your broker fills relative to the pending order price, the more of your profit that execution consumes.
The AVG BROKER SLIPPAGE block shows a bar and “average / 150 points”, measured in symbol points. On gold quoted to two decimal places, 150 points equals 1.50 in price. The bar turns orange from half the scale (75 points) and red from 85% (128 points).
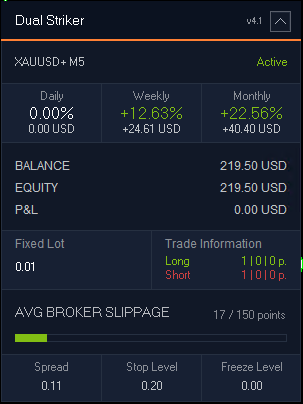
Figure 1. Dual Striker panel, AVG BROKER SLIPPAGE line.
The calculation covers the entire available terminal history for this EA and the chart symbol. It is a plain average, updated with every new deal and rounded to whole points. Positive means execution was worse than the requested price; negative means it was better. Both results contribute to the average.
Only deals with the EA’s magic number on the chart symbol are included. For entries filled from its pending orders, the calculation compares the fill price with the order price. For stop loss or take profit exits, it compares the fill price with the specified level. Market entries, Friday closes, and manual closes are excluded.
My XAUUSD M5 panel shows 17 / 150 points: average slippage is 17 points, or 0.17 in price. The bar is green. With a 100-ounce contract, that is 0.17 USD per deal at 0.01 lot and 17 USD per deal at 1.00 lot. Below it are the broker’s current settings in price units: Spread — 0.11, Stop Level — 0.20, Freeze Level — 0.00. Spread is shown separately from slippage.
In the strategy tester, fills occur at the order price. This line therefore makes sense only on a live or demo account with actual fills.
I added this calculation to Dual Striker so you would not have to check every deal manually. The EA calculates average slippage across its entire available deal history for the chart symbol. You can see your broker’s actual execution cost and compare brokers or account types.
Dual Striker: live account results
Growth: 339%
Signal running: 15 weeks
Dual Striker trades on a live account tracked by an MQL5 signal. Figures as of 12.11.2026.
Download the demo and test it yourself
Download the free demo from the Market page and test Dual Striker in your own Strategy Tester.




