
JET Footprint and JET Footprint PRO: volume at every price inside the candle, on your MetaTrader 5 chart

JET Footprint is a new indicator for MetaTrader 5 that shows, inside each candle, how much was bought and sold at each price. It comes in two editions: JET Footprint, free, with the Bid x Ask footprint, the POC and the candle delta, and JET Footprint PRO, which adds 8 styles, imbalances, cumulative delta, other periods, alerts and data for Experts.
How it works
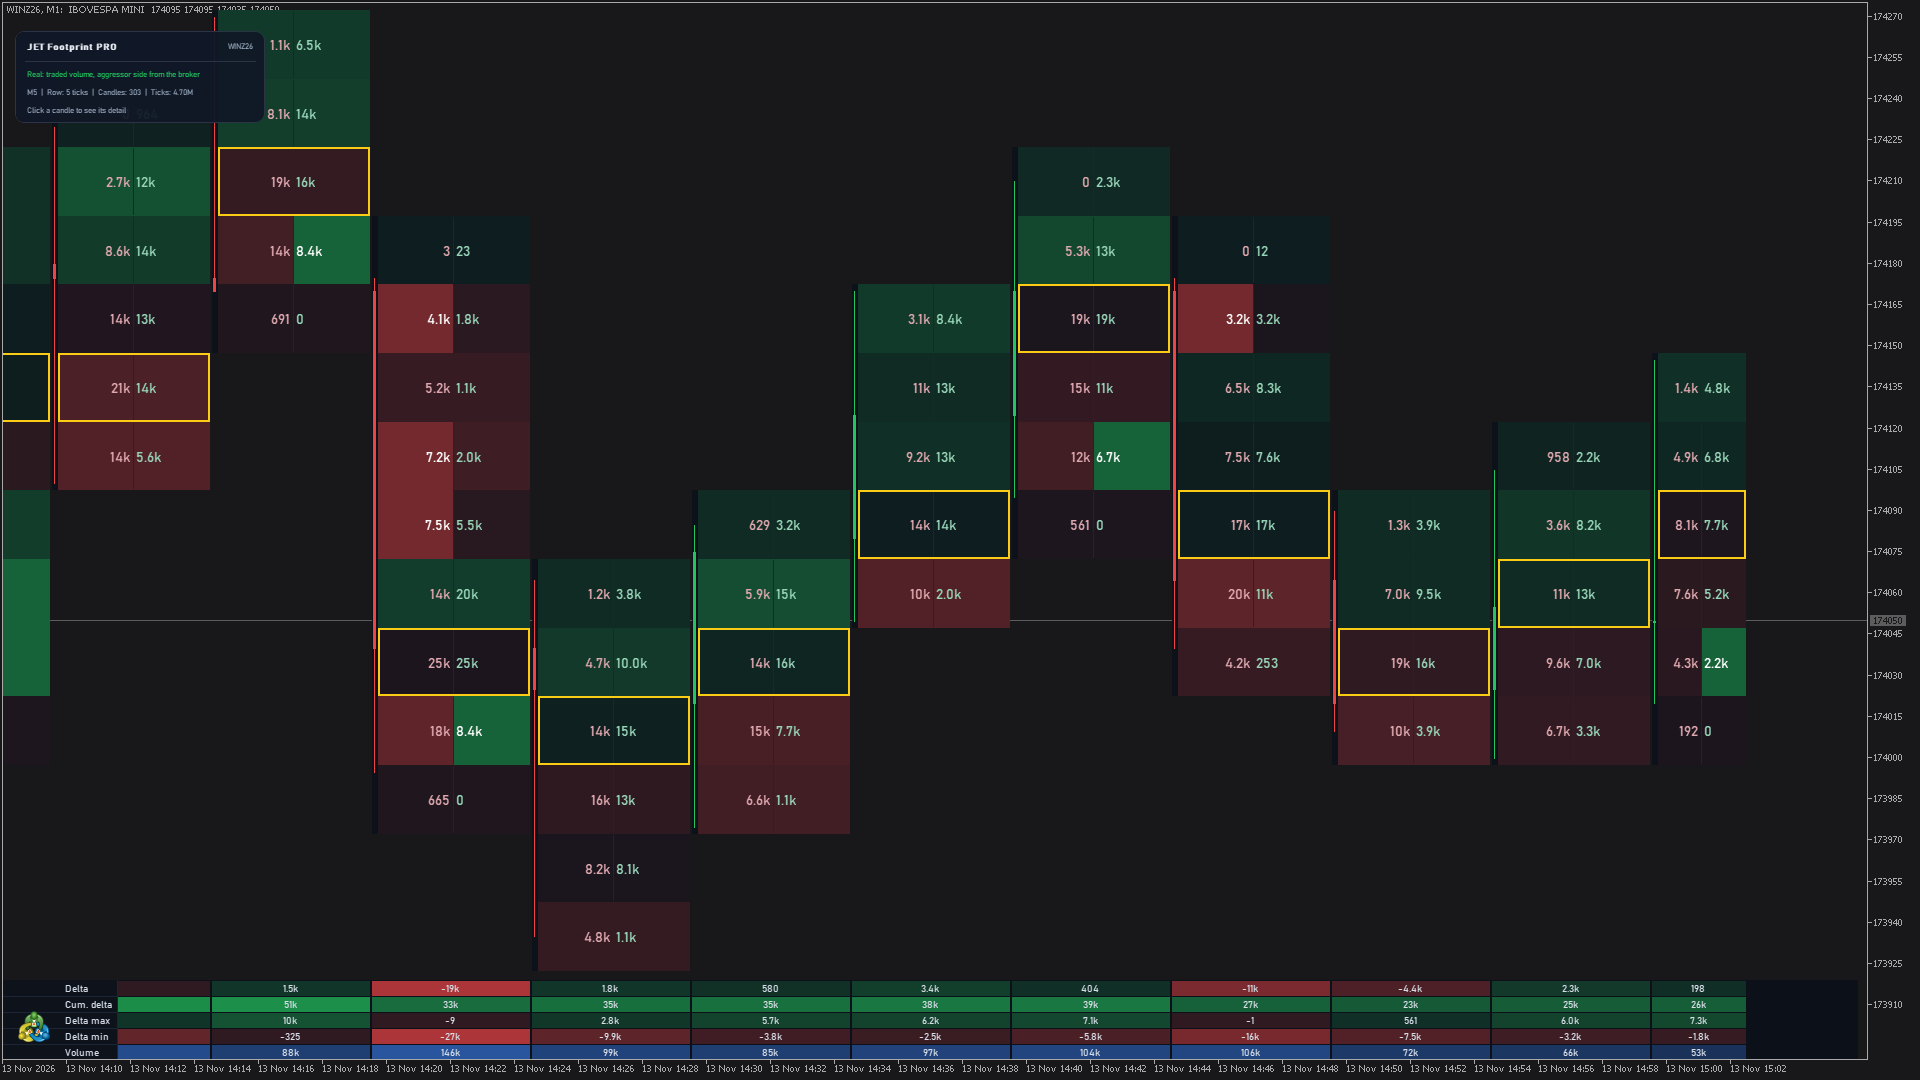
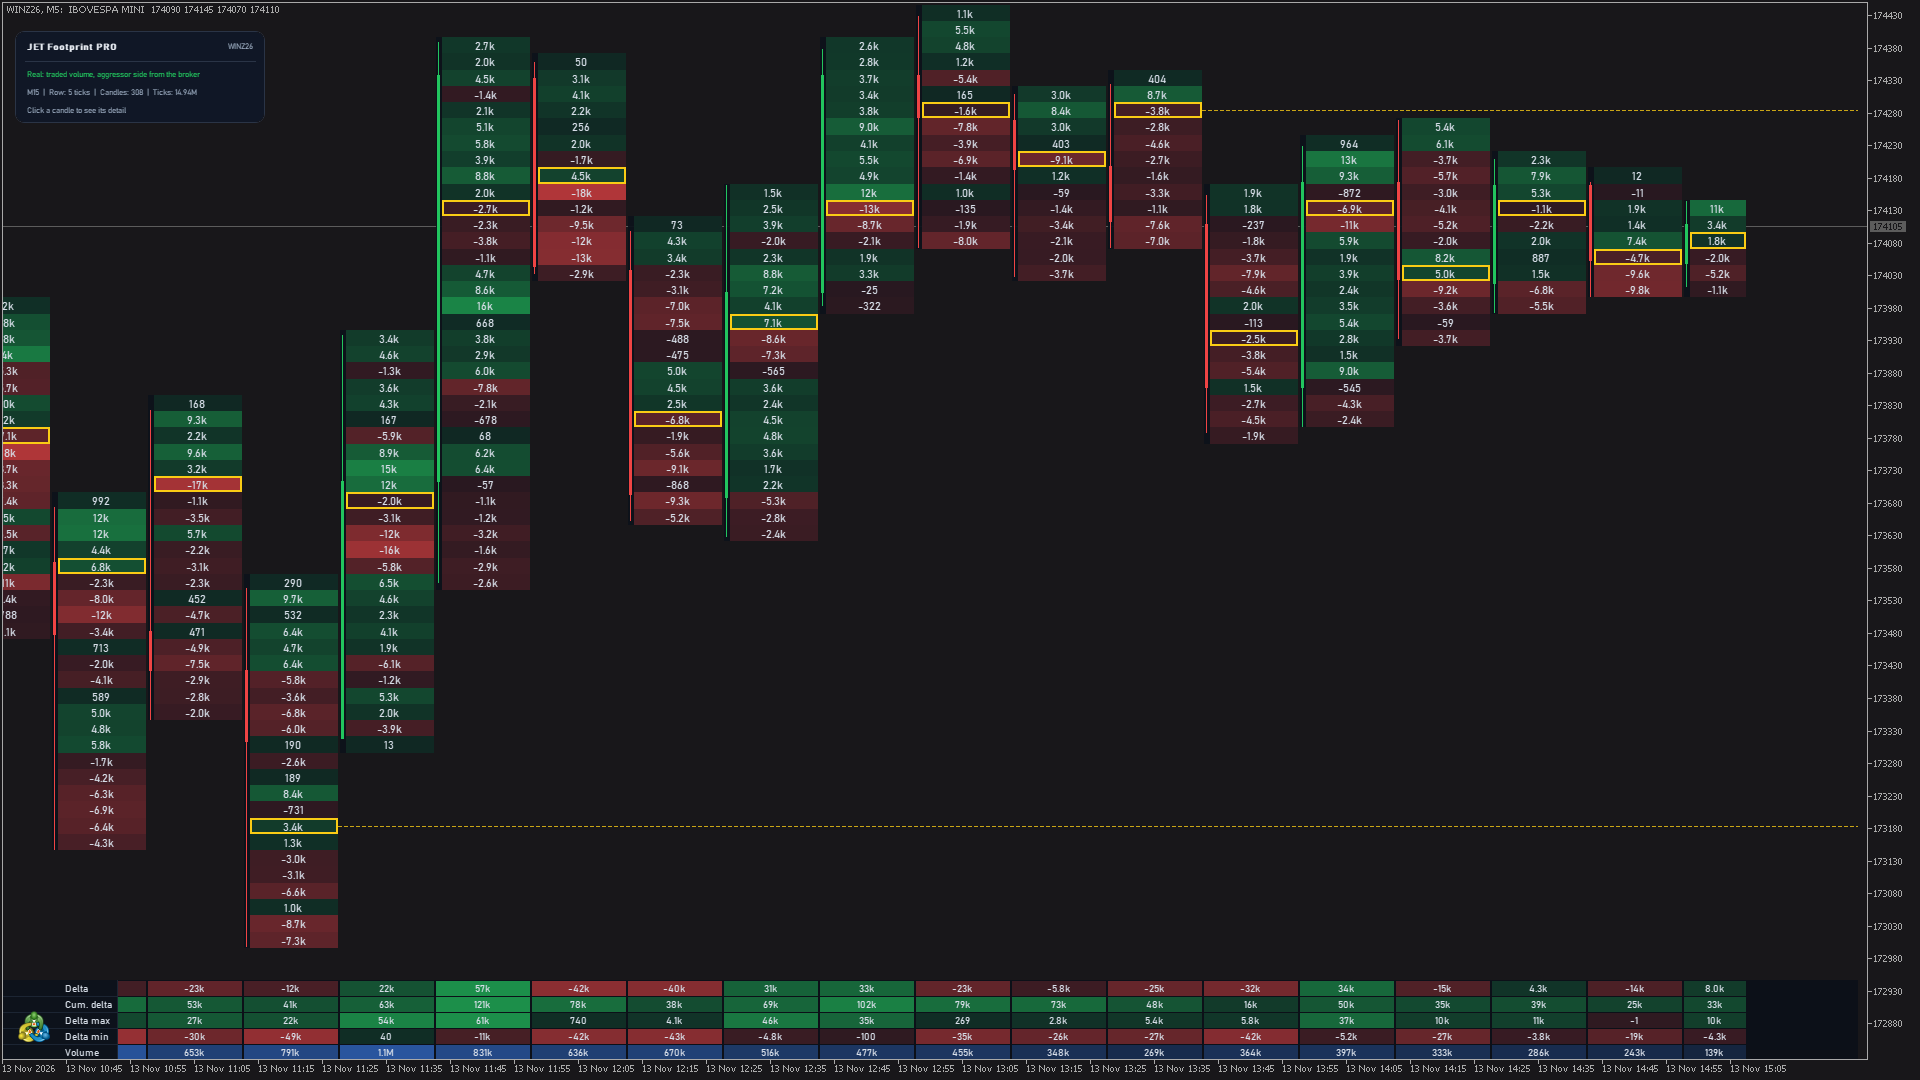
JET Footprint draws a footprint on the chart: each candle is split into price rows, and each row shows how much was bought and how much was sold at that price. The row with the most volume (POC) is framed in gold, and the delta of each candle (buying minus selling volume) is shown in a row at the bottom of the chart.
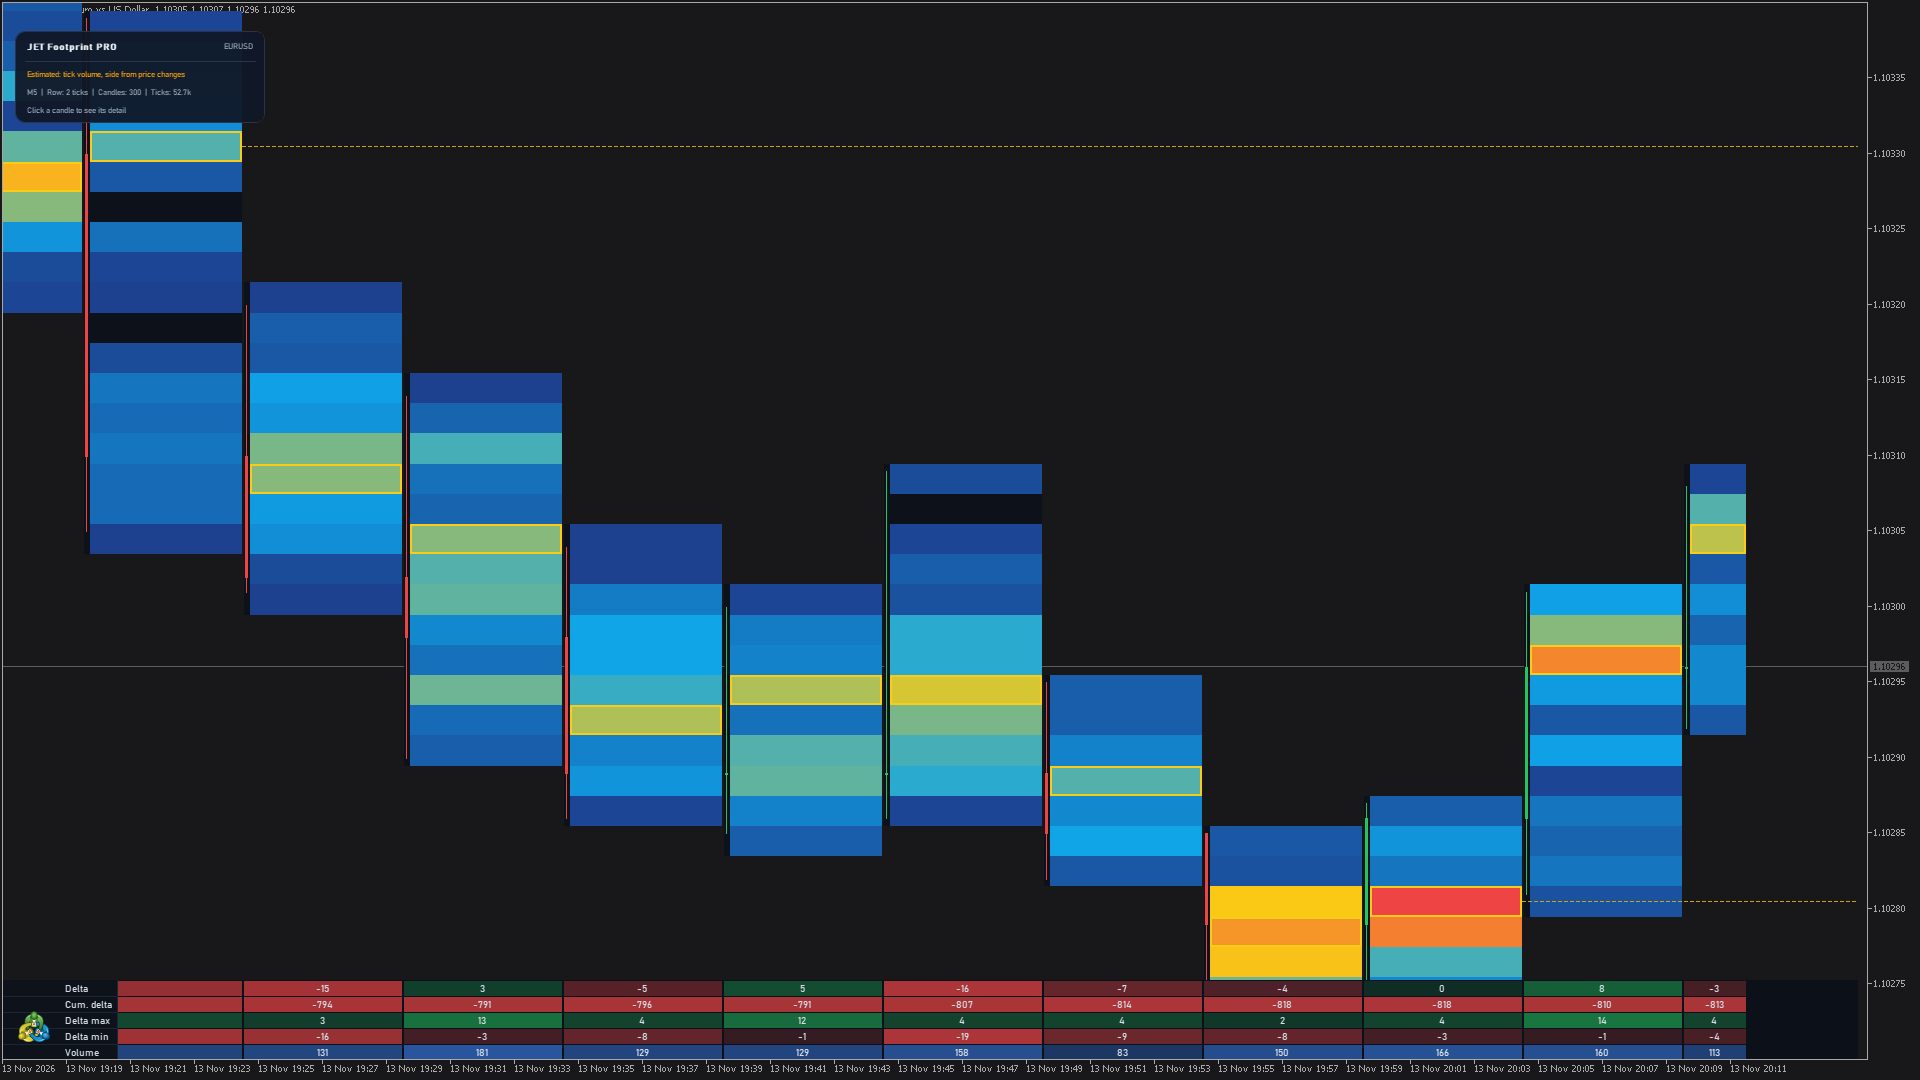
Real or estimated, always shown. Where the broker sends the trades with the aggressor side (futures and stocks on any exchange, e.g. B3, CME and others), the footprint uses the real traded volume and the real side: Real mode. Forex, CFDs and metals have no trades on MetaTrader 5: the footprint then uses the tick volume, with the side estimated from price changes, and the panel shows Estimated. The estimated mode shows where the activity concentrated, but it is not the real traded volume.
Closed candles never change: their footprint is calculated once and kept. It is an indicator only: it never opens, closes or changes orders.
Free or PRO?
| Free | PRO | |
|---|---|---|
| Bid x Ask footprint and delta per level | yes | yes |
| POC of each candle, framed | yes | yes |
| Candle delta in a row at the bottom | yes | yes |
| Real data where the broker sends trades, estimated elsewhere, always shown | yes | yes |
| Automatic row size | yes | yes |
| 8 styles (heat map, histogram, candle profile and more) | — | yes |
| Diagonal and stacked imbalances | — | yes |
| Cumulative delta, delta max and min, naked POCs | — | yes |
| Periods from M1 to H1 and range bars, manual row size | — | yes |
| Detail of any candle on click (price, selling x buying, delta, volume); Live mode on the current candle | — | yes |
| Candle countdown in the detail panel | — | yes |
| Alerts: popup, sound, push notification, e-mail | — | yes |
| Data for Experts (iCustom buffers) | — | yes |
JET Footprint PRO draws a footprint on the chart: each candle is split into price rows, and each row shows how much was bought and how much was sold at that price. The row with the most volume (POC) is framed in gold, and the delta of each candle (buying minus selling volume) is shown in a row at the bottom of the chart. The PRO version adds 8 styles, diagonal imbalances with stacked imbalances highlighted, cumulative delta, delta max and min, naked POCs, footprint periods from M1 to H1 and range bars, alerts and data for Experts.
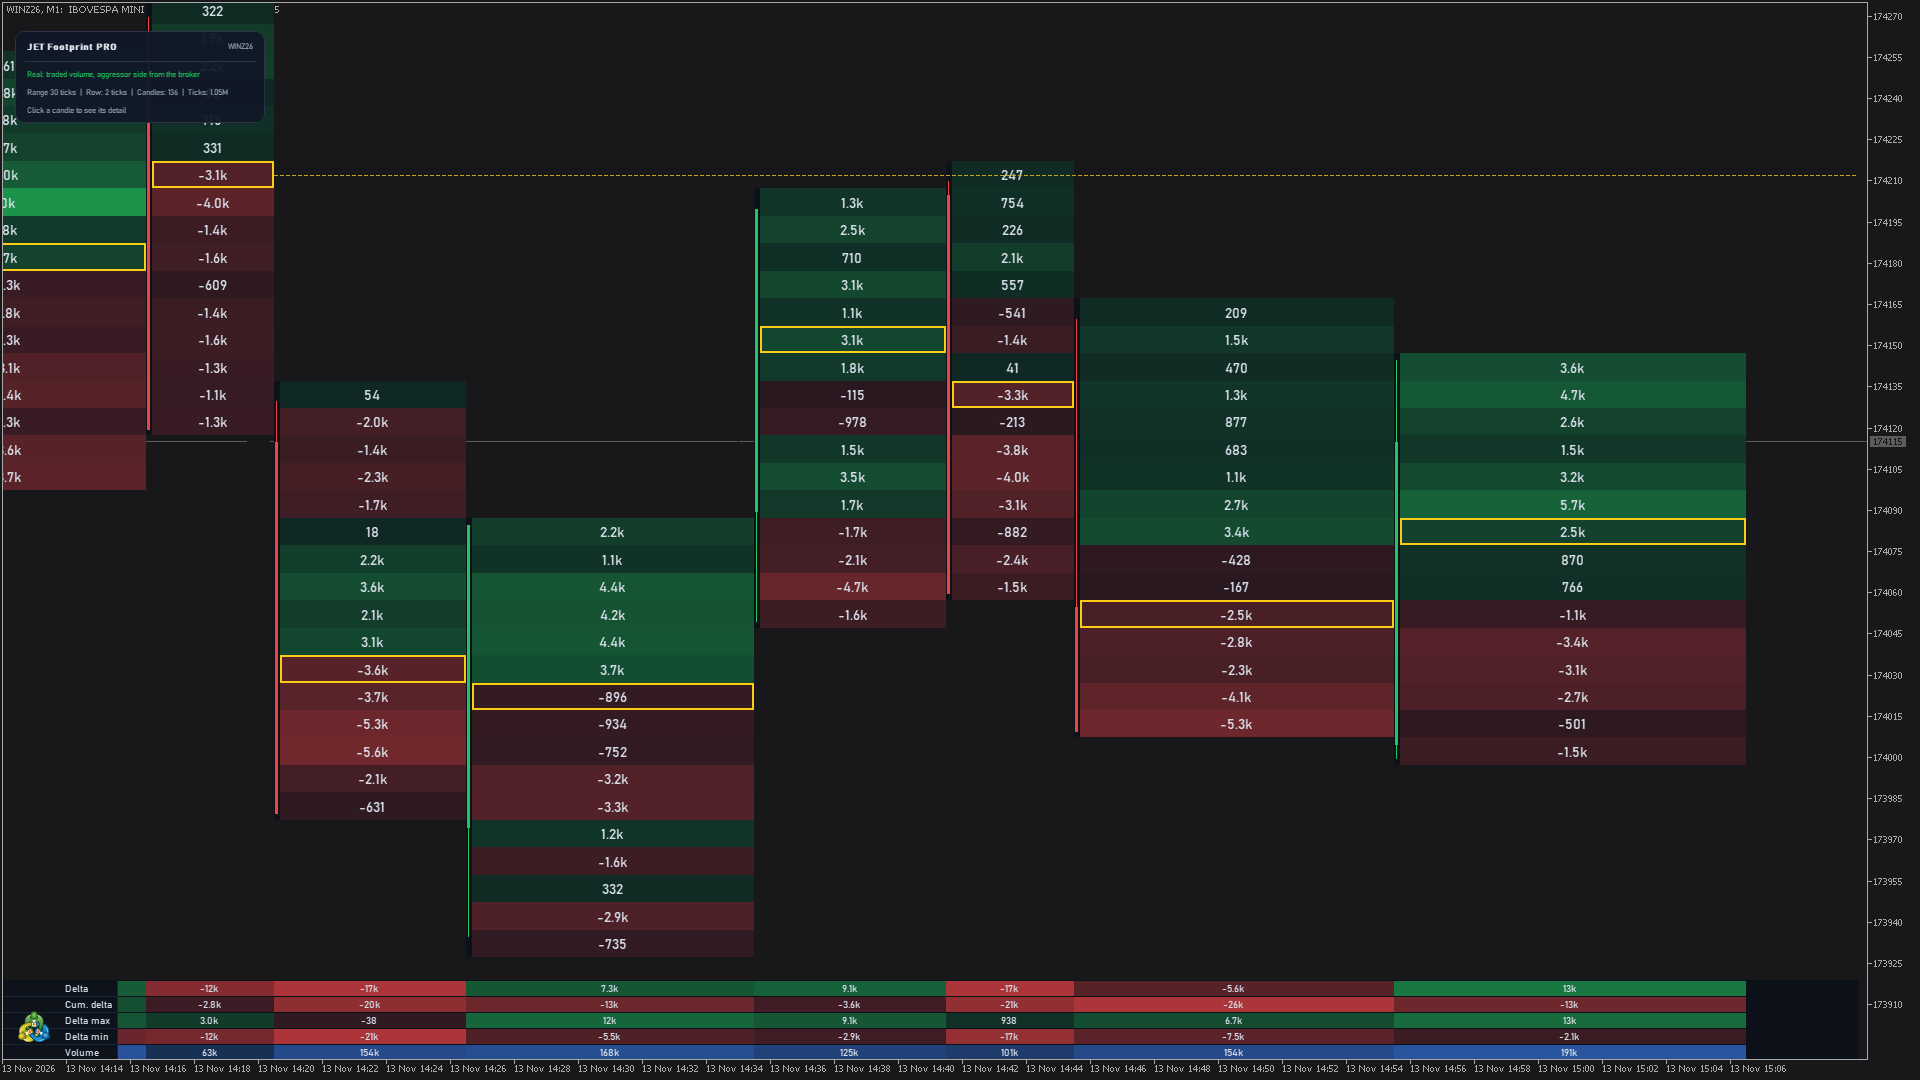
- Each candle split into price rows: selling volume on the left and buying volume on the right (Bid x Ask style), or the delta of each row (Delta style).
- The POC (the row with the most volume) framed in gold.
- A thin candle at the left of each footprint, and the delta of each candle in a row at the bottom of the chart.
- Detail of a candle: click a candle to open a panel with its full footprint (price, selling, buying, delta and volume per level, imbalances and POC), readable at any zoom. With the Live button (or Shift+L) the panel follows the candle in progress and moves to each new candle by itself. While it shows the candle in progress, the panel also counts down to its close (with range bars, the ticks left to close it).
- 8 styles: Bid x Ask, Delta per level, Total volume, Histogram, Imbalances, Candle profile (with the 70% value area), Heat map and Compact.
- Rows at the bottom: delta, cumulative delta (daily or continuous), delta max and delta min inside each candle, and volume.
- Naked POCs: the POC of a closed candle is extended to the right until price trades there again.
Imbalances
- Diagonal imbalance: buying at a price at least 3 times (editable) the selling one row below, or selling at least 3 times the buying one row above. The cell is highlighted.
- Stacked imbalances: 3 or more (editable) imbalance rows in a row, counted in the data for Experts and with their own alert.
Periods and rows
- Footprint on the chart timeframe, on a longer period from M1 to H1 (for example M5 footprints on an M1 chart, wider and easier to read) or on range bars of a number of ticks. In the range and longer-period modes the chart candles are hidden behind the footprint (optional) and come back with their original colors when the indicator is removed.
- Row size automatic or set in ticks.
- 300 candles of history by default (up to 2,000, within the last 10 days of ticks). Closed candles are not recalculated, and the chart is redrawn at most 4 times a second while a candle is forming.
- When you zoom out, rows are merged automatically; when candles get too narrow, only the POC is marked.
Alerts on the closed footprint bar
- Stacked imbalance (buying or selling), extreme delta (2.5 times the average of the last 20 bars, editable) and naked POC touched, each with its own mode: popup, sound, push notification or a combination; e-mail optional.
- By default, only the stacked imbalance alert is on.
Data for Experts (iCustom)
- Buffer 0: delta (buying minus selling volume)
- Buffer 1: cumulative delta
- Buffer 2: POC price (middle of the row with the most volume)
- Buffers 3, 4 and 5: total, buying and selling volume
- Buffers 6 and 7: delta max and delta min inside the bar
- Buffers 8 and 9: number of buying and selling imbalance rows
- Buffers 10 and 11: longest stacked buying and selling imbalance, in rows (0 = none)
- Buffer 12: data mode (1 = real, 2 = estimated from tick volume, 3 = real volume with estimated side)
- Each chart candle receives the values of the footprint bar at the close of that candle; with the footprint on the chart timeframe, these are the candle's own values. Closed candles (index 1 or higher) do not change. The value is empty before the loaded history.
Works on any symbol
- Futures and stocks of any exchange (e.g. B3, CME and others) with real data, where the broker sends the trades with the aggressor side; forex, CFDs, metals and crypto in estimated mode.
- Up to the D1 chart. Tested on WIN, EURUSD and XAUUSD.
Download
- JET Footprint – free footprint with POC and candle delta.
- JET Footprint PRO – all the features above.
Questions and suggestions: send me a private message through my MQL5 profile.
Trading involves risk of loss. A footprint shows what was traded in the past; it does not forecast prices. In estimated mode, volume and side are estimates. The indicator does not guarantee results.





