
The age of a price level: do breaks of older highs and lows continue more often?

A breakout system treats a high that was printed two minutes ago and a high that has held for two days as the same thing: a level to trade through. I wanted to know whether they behave the same. So I wrote a small tool that measures the age of a level and counted, over almost eight years of one-minute bars, how often a break continues depending on that age.
The code is attached at the end of the post. You can repeat the test on your own broker's data in a few seconds.
WHAT IS MEASURED
- Level: the highest high (or lowest low) of the bars of the last 72 hours of clock time, not counting the current bar.
- Age: the time since the bar that printed that extreme. A bar that only equals the level does not reset its age.
- Break: a bar that trades through the level. Only the first bar of a run of consecutive breaking bars is counted.
- Continuation: two barriers at the same distance above and below the entry, 0.10 x the 14-day average daily range. The break continues if price reaches the barrier in the direction of the break first, and fails if it reaches the opposite one first. With symmetric barriers, a price with no tendency gives 50 %.
- The entry is the level itself, or the open of the bar if it gapped through.
- If both barriers fall inside one bar, the break is dropped as ambiguous. If neither is reached within 24 hours, it is dropped as expired.
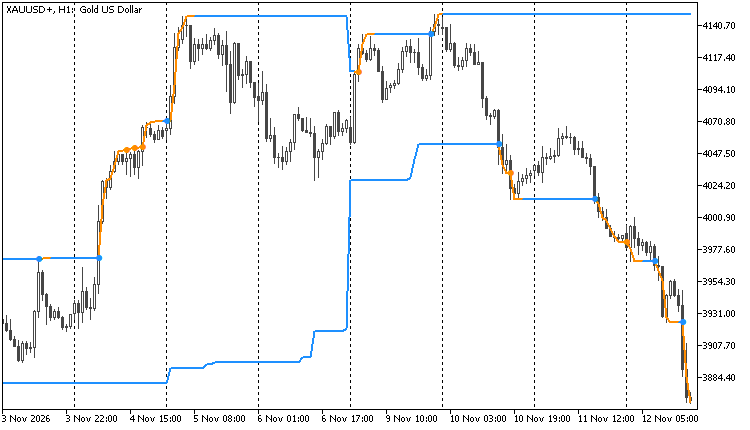
LevelAge on XAUUSD H1: the 72-hour high and low, orange while the level is younger than 4 hours and blue once it is older. Dots mark the bars that break a level.
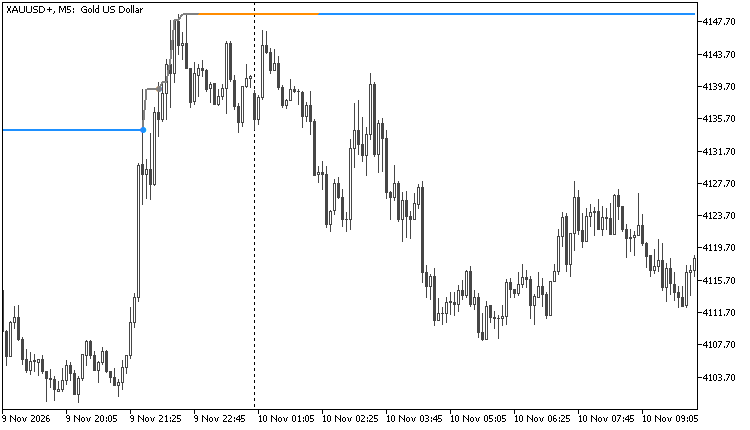
The same on M5: a mature (blue) high breaks. The new high is born grey, turns orange after 30 minutes and blue after 4 hours.
THE TOOLS
- LevelAge.mqh - the class CRollingExtreme: a rolling maximum or minimum of the last N seconds together with the time of the bar that printed it. It is a monotonic queue: every bar enters once and leaves once, so it is cheap enough for millions of M1 bars.
- LevelAge.mq5 - the indicator in the screenshots. Inputs: window in hours (72), minutes below which a level is fresh (30), minutes above which it is mature (240), mark the breaks, mark only the first bar of a run.
- LevelAgeStudy.mq5 - an Expert Advisor that never trades. It walks through the M1 bars, records every break and prints the table to the Journal. It also writes every break to a CSV file in the common folder. Its OnTester() value is "oldest bucket minus youngest bucket", so the optimizer can sweep the window and the barrier.
Using the class in your own code takes four lines:
#include <LevelAge\LevelAge.mqh>

CRollingExtreme hi;
hi.Init(true, 72 * 3600);                     // rolling maximum of the last 72 hours

// on every closed bar:
double   level;
datetime since;
if(hi.Get(bar_time, level, since))            // the level this bar sees, and when it was printed
   Print("age of the level, minutes: ", (bar_time - since) / 60);
hi.Push(bar_high, bar_time);                  // then the bar itself enters the window
GOLD, 2019 - 2026
XAUUSD, M1 bars from 2 January 2019 to 30 October 2026: 18,551 breaks (137 ambiguous and 70 expired ones are not counted).
| Age of the level | Breaks | Continued | 95 % interval |
| under 15 minutes | 11,646 | 49.8 % | 48.3 - 51.2 |
| 15 - 60 minutes | 3,001 | 52.0 % | 50.1 - 54.2 |
| 1 - 4 hours | 1,644 | 52.9 % | 50.4 - 55.4 |
| 4 - 24 hours | 1,194 | 55.1 % | 52.4 - 58.0 |
| over 24 hours | 859 | 56.1 % | 52.8 - 59.6 |
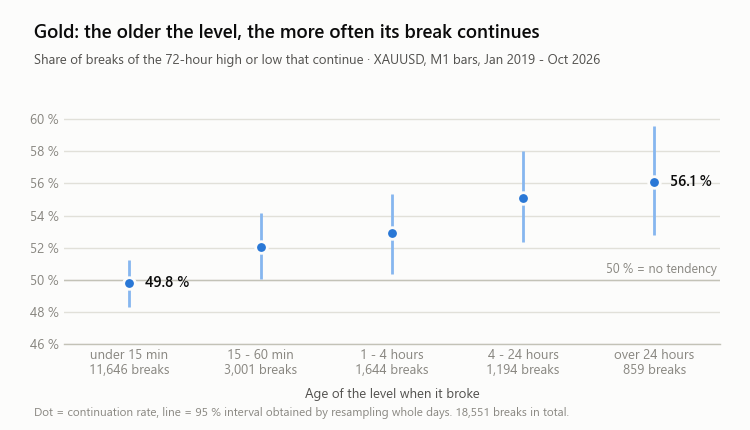
A fresh level is a coin flip. The older the level, the more often its break continues: +6.3 points between the oldest and the youngest bucket (95 % interval: +2.7 to +10.1).
The intervals come from resampling whole days, because the breaks of one day are not independent. The standard error that the EA prints is the naive one, and it is narrower.
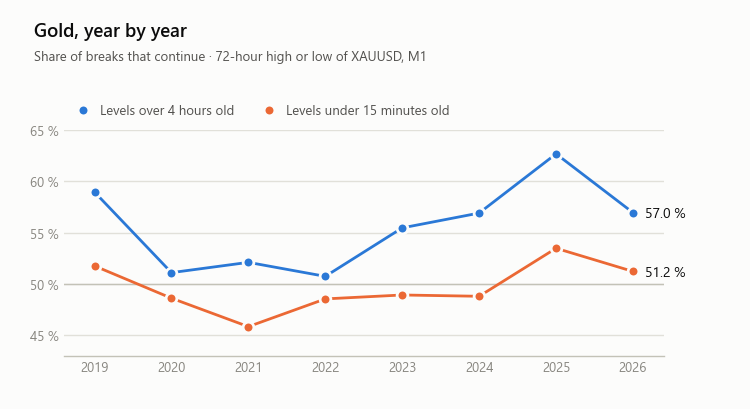
Breaks of the high go from 49.9 % to 57.3 %, breaks of the low from 49.6 % to 54.8 %. Year by year, levels older than 4 hours stayed above the fresh ones in all eight years:
OTHER MARKETS
Same test, same settings, same dates. "Trend" is the change of the continuation rate, in percentage points, every time the age is multiplied by ten. It uses every break, not only the two extreme buckets.
| Symbol | Breaks | Under 15 min | Over 24 h | Trend (95 % interval) |
| XAUUSD | 18,551 | 49.8 % | 56.1 % | +2.0 (+1.2 to +2.9) |
| EURUSD | 19,583 | 49.3 % | 52.6 % | +1.1 (+0.3 to +2.0) |
| GBPUSD | 20,374 | 49.7 % | 50.5 % | +1.1 (+0.3 to +1.9) |
| AUDUSD | 21,919 | 48.7 % | 53.2 % | +1.4 (+0.6 to +2.2) |
| USDCAD | 23,229 | 50.0 % | 48.5 % | 0.0 (-0.8 to +0.8) |
| USDJPY | 20,904 | 50.3 % | 50.3 % | +1.0 (+0.2 to +1.8) |
| NAS100 | 23,511 | 54.6 % | 55.8 % | 0.0 (-0.8 to +0.9) |
| SP500 | 22,578 | 53.6 % | 53.6 % | +0.1 (-0.7 to +0.8) |
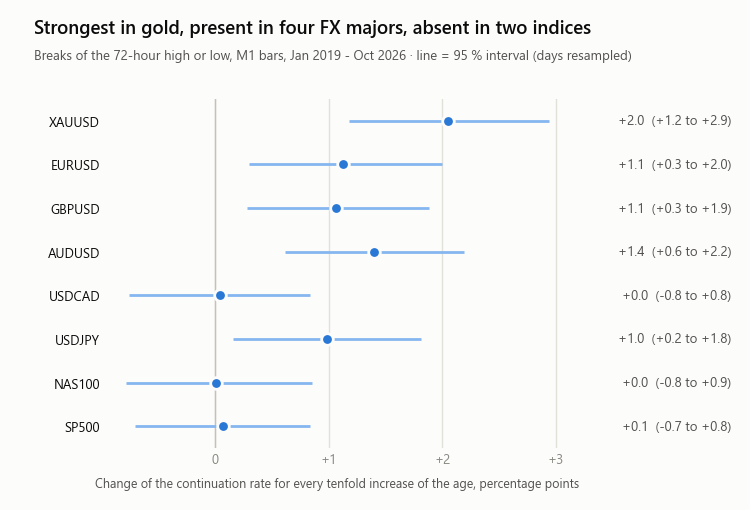
The tendency is strongest in gold. It is present in EURUSD, GBPUSD, AUDUSD and USDJPY. It is absent in USDCAD and in the two index CFDs, where breaks continue about 54 % of the time whatever the age of the level.
DOES IT SURVIVE OTHER SETTINGS?
Gold, oldest bucket minus youngest bucket, for three windows and three barrier distances (0.05 / 0.10 / 0.20 of the daily range):
- 48-hour window: +5.1 / +6.3 / +5.0
- 72-hour window: +3.4 / +6.3 / +3.4
- 120-hour window: +5.3 / +7.5 / +5.0
All nine are positive. Two of them (72 hours with 0.05 and with 0.20) have an interval that touches zero. Counting every breaking bar instead of the first one of each run gives 50.3 % for fresh levels and 56.1 % for the oldest.
The EA was also checked against an independent implementation written in Python. Both produce the same list of breaks, one by one: 18,551 in gold and 19,583 in EURUSD, with the same time, direction, age and outcome.
WHAT THIS IS NOT
- These are bid bars of a single broker, from 2019 to 2026.
- There is no spread, commission or slippage in the test. It measures how price behaves, not the result of a strategy. 56 % with symmetric barriers is not a trading system.
- Eight markets and five buckets are many comparisons, so an isolated number can be chance. The solid part is gold: monotonic, stable across years and across settings.
- The age buckets and the 0.10 barrier were fixed before looking at the results. The trend statistic was added after seeing the bucket table.
HOW TO REPEAT IT
- Unzip the attachment into your MQL5 data folder and compile the three files.
- Open the Strategy Tester, choose LevelAgeStudy, any symbol, timeframe M1, mode "1 minute OHLC" and the dates you want. Eight years of gold take about two seconds.
- Read the table in the Journal. The CSV with every break is in the Common\Files folder.
I use the age of the level as an entry filter in the Talon engine of my Expert Advisor Fafnir. The indicator and the study are free to use and to modify.
Statistical evidence on historical data does not guarantee future results. Trading leveraged products involves a high risk of loss.