XAUUSD New York Session Plan — 12 Nov 2026 | Will the October Low Hold?

Gold is trading at 3,890 an hour into the New York session. The New York open did most of the damage today: price dropped from 3,948 at 13:05 GMT to 3,885 at 13:50, just $5 above last week's low.
I'm not selling down here — I'll wait to sell a retest of the top of the 2–3 Nov range at 3,902–3,910, or a retest of the 30 Oct low at 3,870 if New York breaks it.
H4 | Below all three SMAs, back near the 30 Oct low
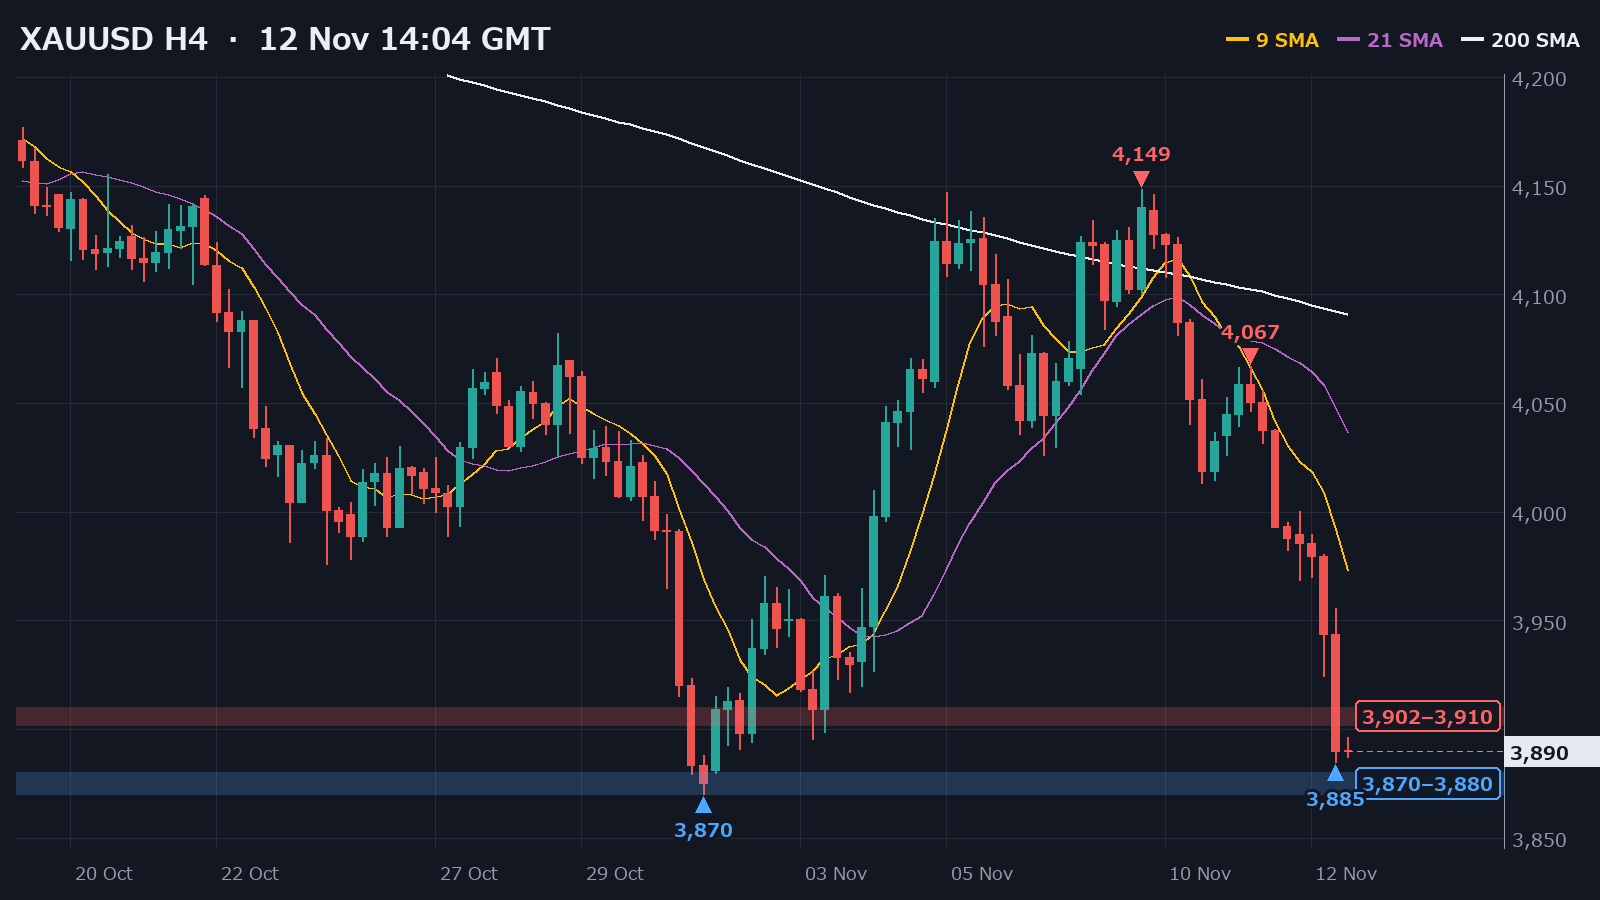
9 SMA: 3,973 · 21 SMA: 4,037 · 200 SMA: 4,091
Gold bottomed at 3,870 on 30 Oct and rallied to 4,149 on 9 Nov. Almost all of that rally is gone now. The H4 highs have stepped down since then: 4,067 yesterday and 4,000 in Asia today. Today's 06:00 and 10:00 candles took gold from 3,981 to 3,885.
Price is under the 9, 21 and 200 SMAs, and the 9 SMA is under the 21 SMA. This is a clean downtrend on H4, and price is now $20 above the 30 Oct low.
▲ Resistance: 3,902–3,910 (the top of the 2–3 Nov range), then 3,924 (the London low)
▼ Support: 3,880 (last week's low), then 3,870 (the 30 Oct low)
H1 | Lower highs all day
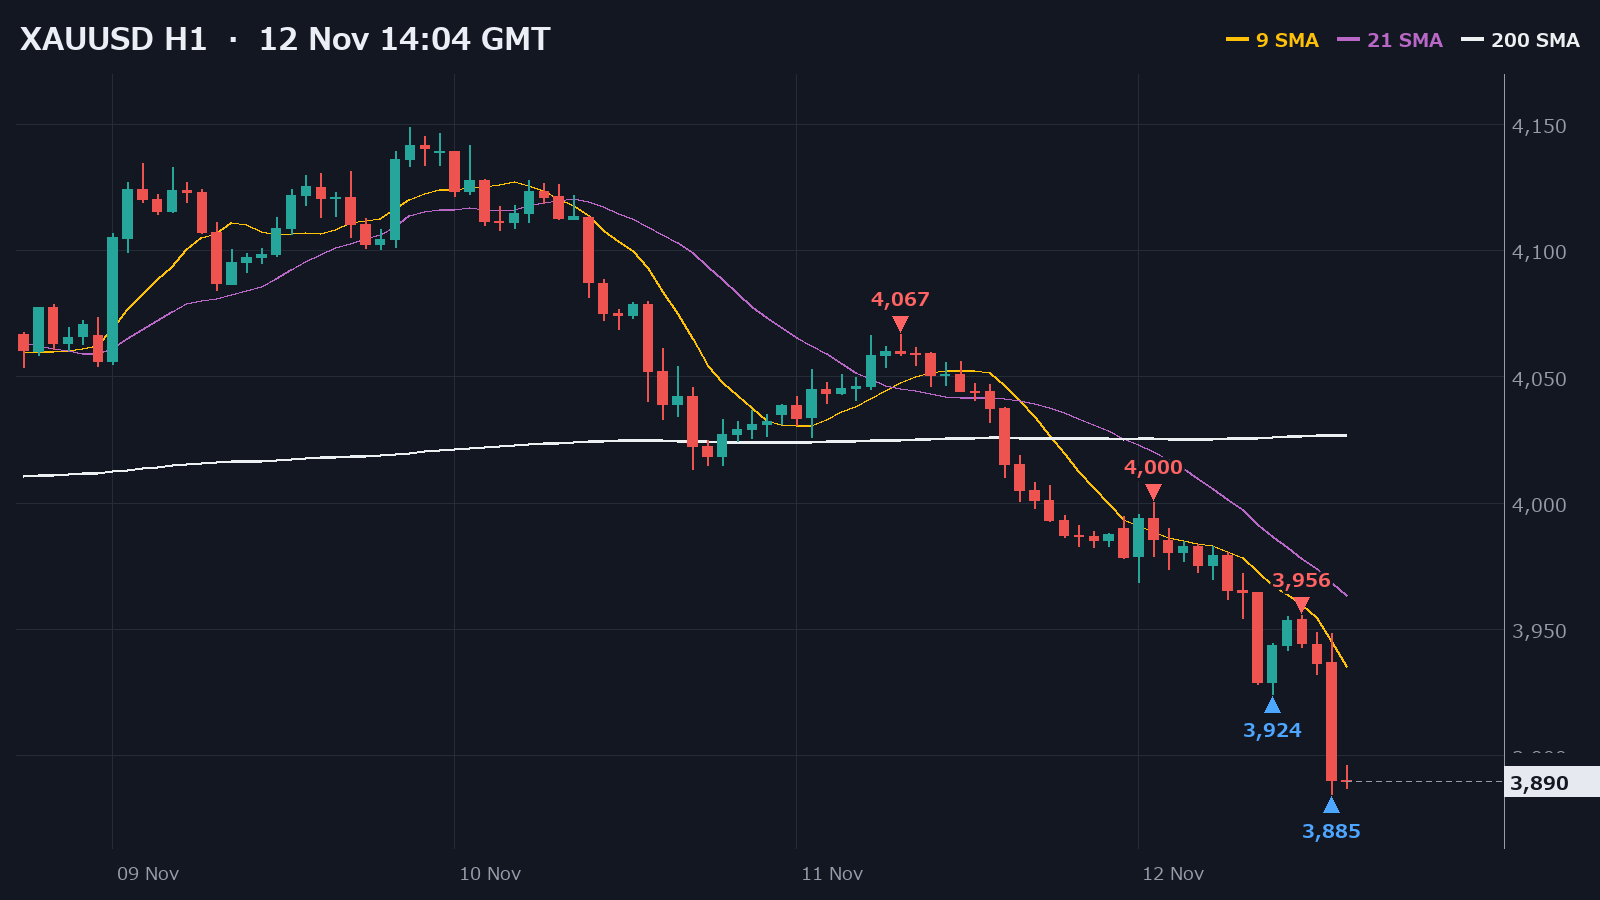
9 SMA: 3,935 · 21 SMA: 3,963 · 200 SMA: 4,027
H1 has printed lower highs since yesterday's 4,067: 4,000 at 01:00 GMT, then 3,956 at 11:00. Asia's low was 3,962. The European open broke it, and London extended the drop to 3,924 at 09:00.
The bounce from the London low stalled at 3,956, and the 13:00 candle then fell from 3,948 to 3,885. That is the largest H1 candle of the day. Price is under all three H1 SMAs, and the 9 SMA is $28 under the 21 SMA. Until H1 prints a higher high, I'm favoring sells.
M15 | A lower high at 3,948, then the break
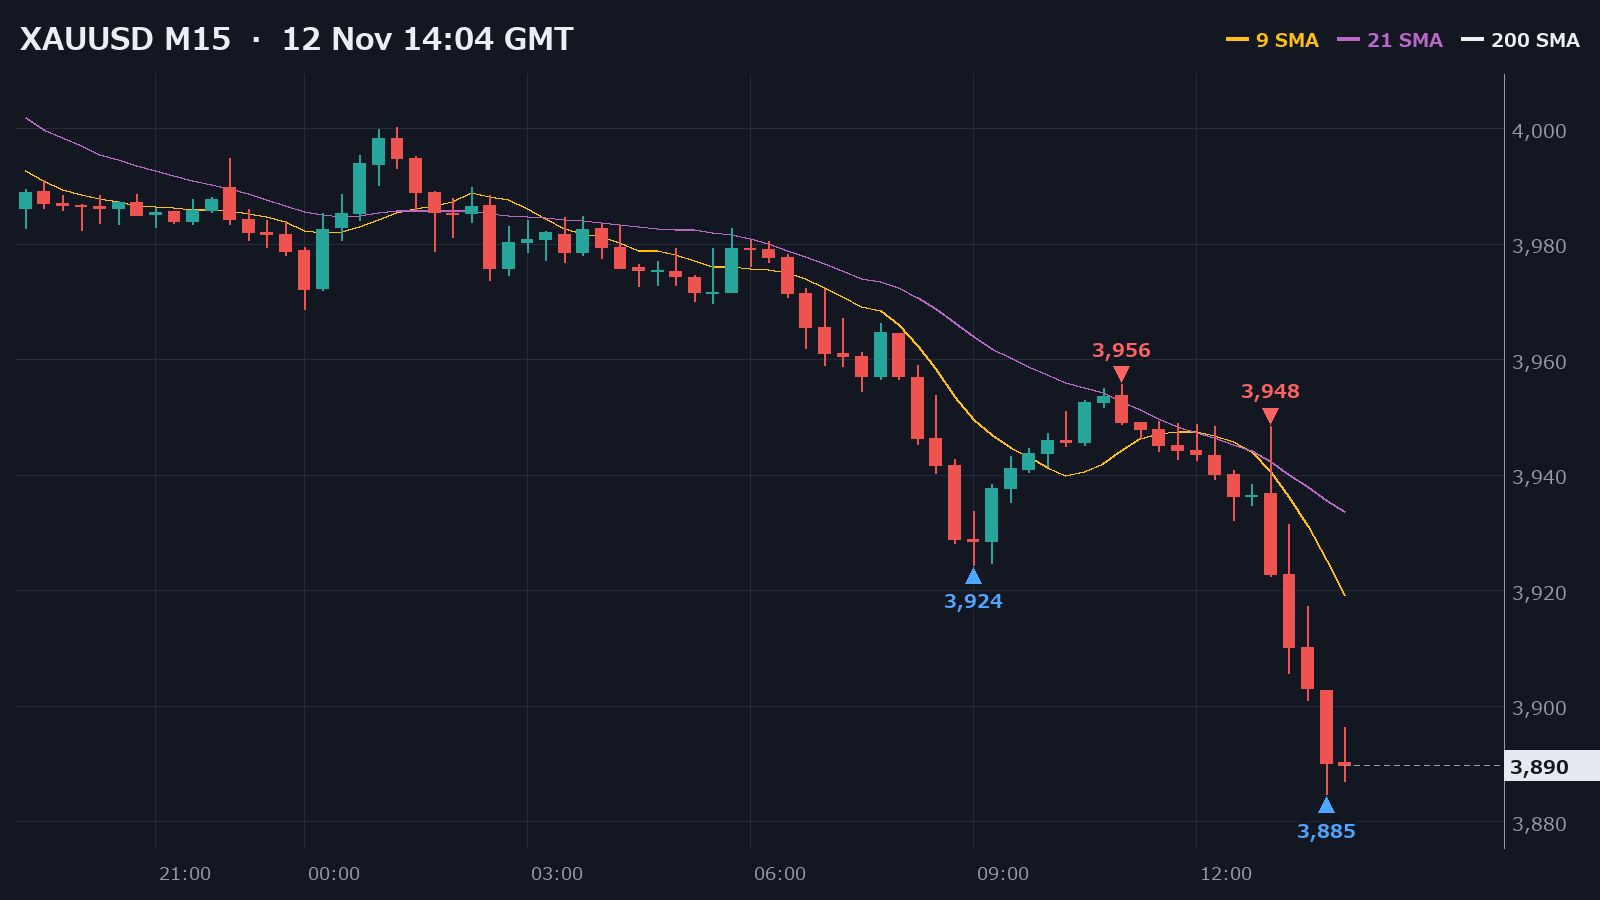
9 SMA: 3,919 · 21 SMA: 3,934 · 200 SMA: 4,013
The 13:00 candle opened with a push to 3,948, a lower high after 3,956 at 11:00. It then reversed and closed at 3,923, below the London low. That was the first of four bearish M15 candles in a row, down to 3,885.
The 14:00 candle is the first one to pause, trading between 3,887 and 3,896. Price is $29 under the M15 9 SMA. The move is stretched, so I want a rally before I sell.
M5 | A shelf at the top of the 2–3 Nov range, then the flush
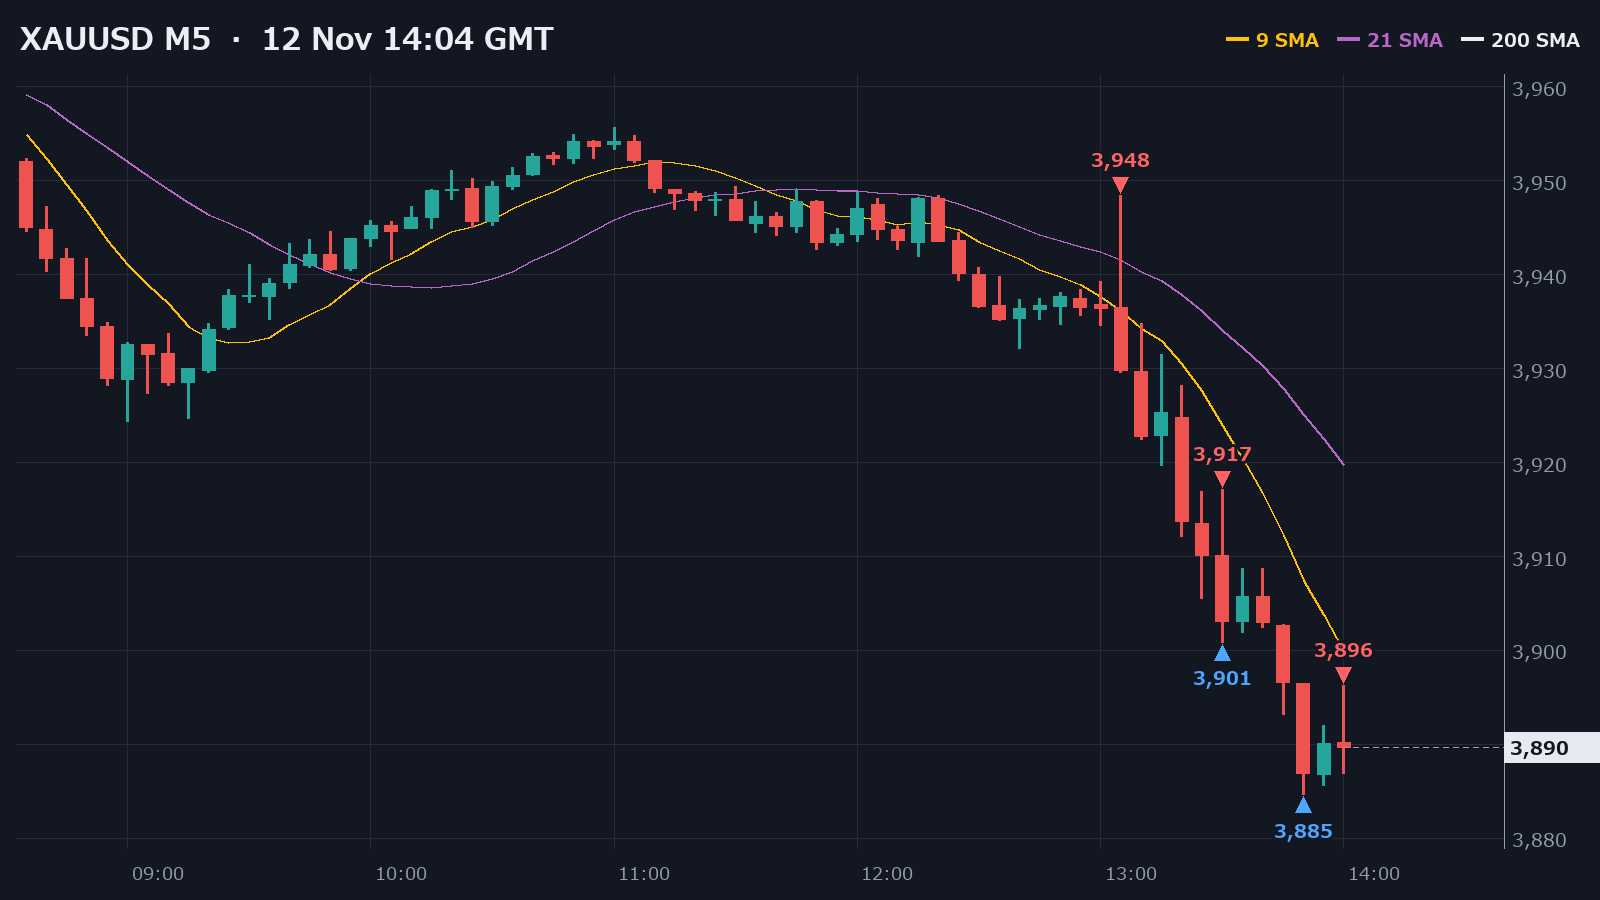
9 SMA: 3,900 · 21 SMA: 3,920 · 200 SMA: 3,965
London's bounce topped at 3,956 at 11:00 GMT. From 13:30 to 13:40, gold built a small shelf at the top of the 2–3 Nov range: the 13:30 candle spiked to 3,917, then the lows held at 3,901–3,902. The 13:45 candle broke it, and the 13:50 candle printed the low of the day at 3,885.
Price has bounced as far as 3,896 since then. The M5 9 SMA at 3,900 sits right under the shelf, so 3,902–3,910 is the first place I want to sell.
Today's Events (GMT)
- 15:00 — US existing home sales (4.04M expected, prior 3.99M)
- 15:00 — Fed's Barr speaks
- 18:00 — US 30-year bond auction
I won't open a new trade in the five minutes either side of 15:00 or 18:00. The 30-year auction can move yields.
Entry Plans
Main plans (with the trend)
Plan 1 (main): Sell the retest of the 2–3 Nov range top at 3,902–3,910
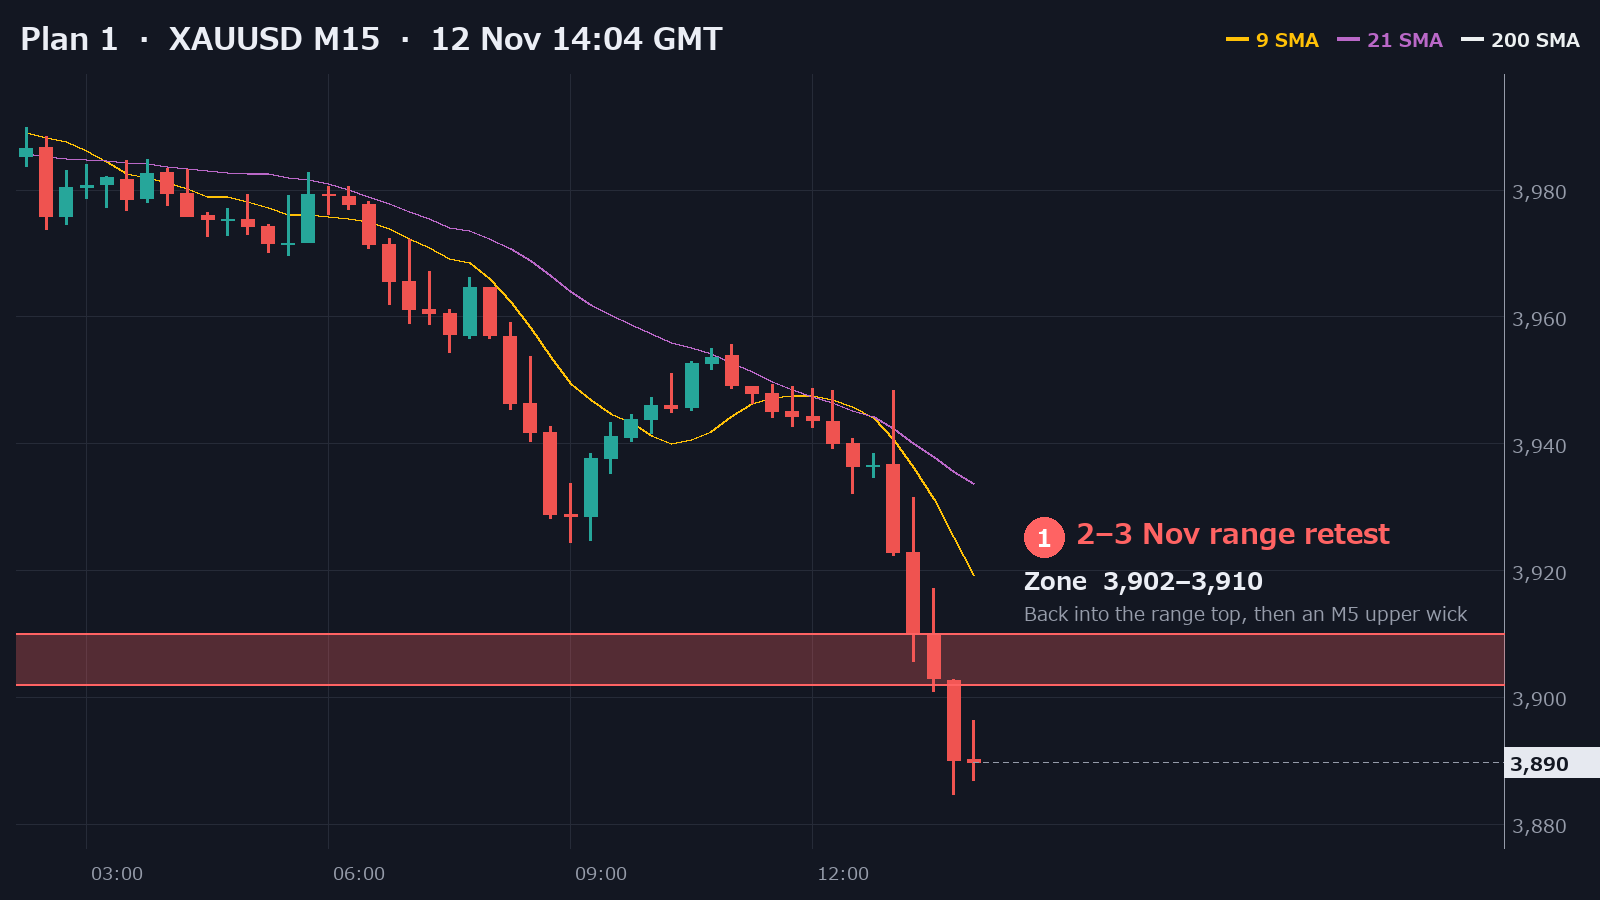
On 2 and 3 Nov, gold spent hours trading here, and H1 highs kept stalling around 3,910. Today the 13:15 M15 candle closed at 3,910, and M5 paused just under it before the last leg down. If price climbs back into the zone and an M5 candle prints an upper wick, then closes back under 3,910, I'll sell. A wick toward the 13:30 spike at 3,917 doesn't cancel the plan. If an M15 candle closes above 3,910, the range top has been reclaimed and I stay out.
- Entry: 3,906
- SL: 3,921
- TP1: 3,885
- TP2: 3,880
- TP3: 3,870
TP1 is today's low, TP2 is last week's low, and TP3 is the 30 Oct low.
Plan 2: Sell the retest of the 30 Oct low at 3,866–3,872
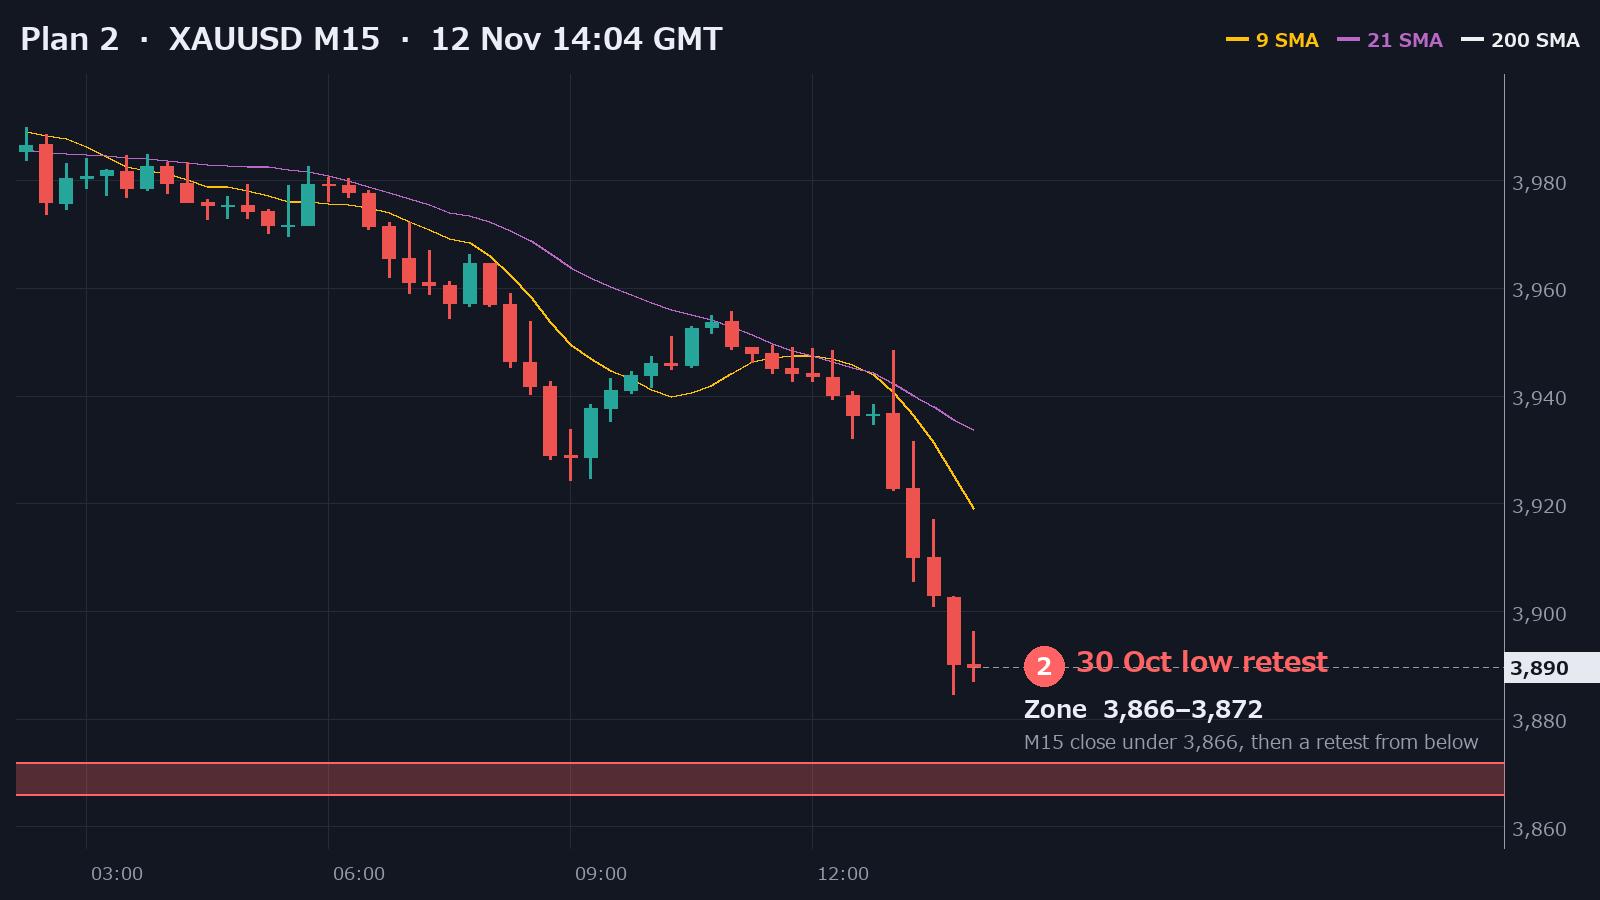
If a full-bodied M15 candle closes below 3,866, the 30 Oct low is broken, and last week's 3,880 low with it. I won't sell that candle. I'll wait for price to retest 3,866–3,872 from below and get rejected with an upper wick.
- Entry: 3,869
- SL: 3,877
- TP1: 3,860
- TP2: 3,850
- TP3: 3,828
There is no swing low under 3,870 on my H4 chart, so I use round numbers and the typical New York range for targets: TP1 and TP2 are the 3,860 and 3,850 round numbers, and TP3 is one typical New York range (about $42) under 3,870.
Counter-trend
Plan 3: Buy the 30 Oct low at 3,868–3,878
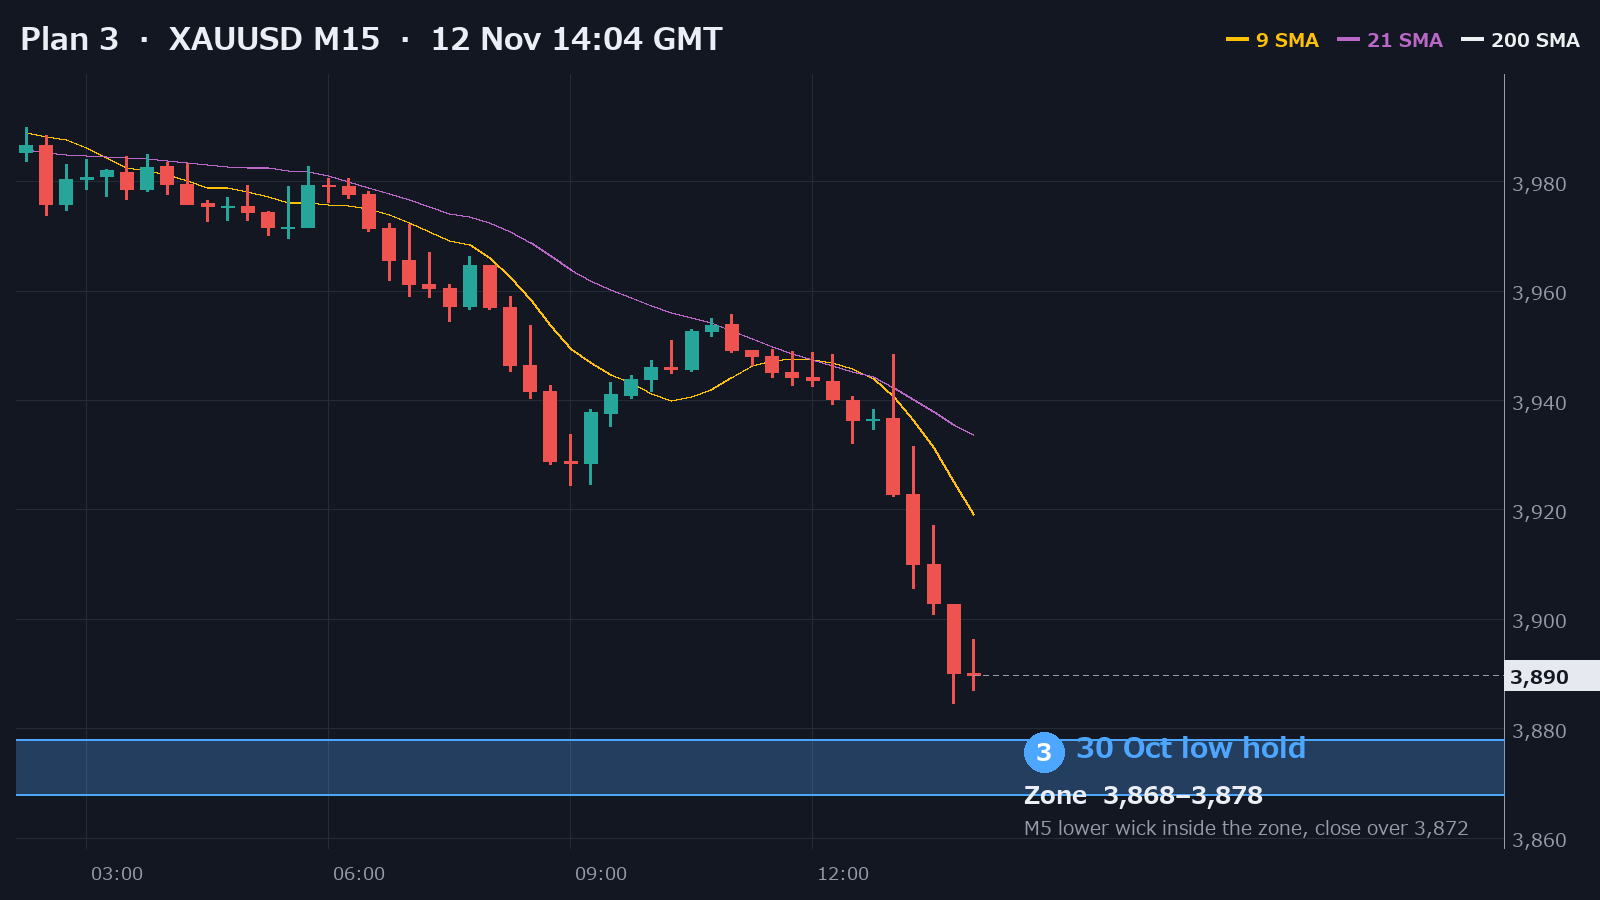
Gold has dropped more than $100 since the 4,000 high at 01:00 GMT, and this zone holds the low that ended the late-October sell-off. If price comes down into the zone and an M5 candle prints a long lower wick, then closes back above 3,872, I'll buy for a short bounce.
- Entry: 3,873
- SL: 3,862
- TP1: 3,885
- TP2: 3,896
- TP3: 3,901
The targets stay close: today's low, the 14:00 bounce high, and the bottom of the 13:30 shelf.
Summary
My main plan is to sell a retest of the top of the 2–3 Nov range at 3,902–3,910 with a stop above the 13:30 spike, aiming for 3,885, then 3,880 and 3,870. If New York breaks the 30 Oct low first, I'll sell the retest of 3,866–3,872 instead. My only buy today is at 3,868–3,878, for a short bounce.
Levels I'm watching:
- 3,902–3,910: main sell zone (the top of the 2–3 Nov range)
- 3,885: today's low
- 3,880: last week's low
- 3,868–3,878: counter-trend buy zone (the 30 Oct low)
- 3,866–3,872: retest sell zone (after an M15 close below 3,866)
Daily Gold Plans on My Channel
I post my zones for the Asian, London and New York sessions on my channel, plus a recap of the previous day.
Join here: https://www.mql5.com/en/channels/kizami-gold
My Tools
- KIZAMI — https://www.mql5.com/en/market/product/203530
- SADAME — https://www.mql5.com/en/market/product/203655
- Tsurugi Gold EA — https://www.mql5.com/en/market/product/207107
Trading involves risk. This is my own plan, not a recommendation.