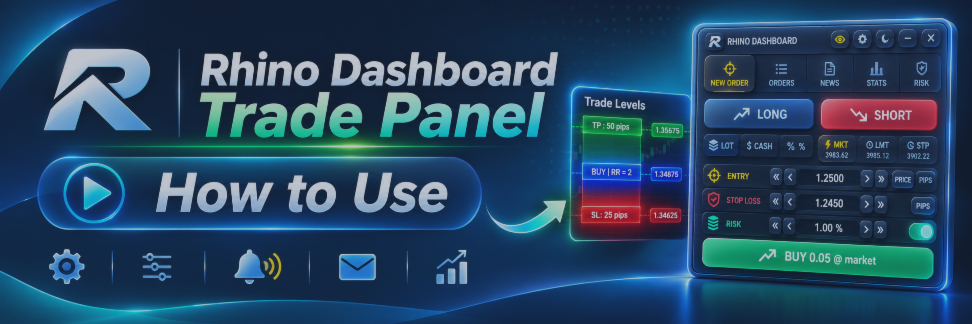
How to Trade Safe and Easy in MetaTrader 5/4: Daily Loss Limit, Position Size Calculator and Risk Manager

Rhino Dashboard Trade Panel: User Manual

Rhino Dashboard Trade Panel is a trade panel and risk manager for MetaTrader 5 and MetaTrader 4, made for manual traders. It puts a top bar and one panel on your chart. You size each trade by risk with a position size calculator, plan its exits (partial close, break-even, trailing stop) before you send, and let a daily loss limit, weekly and monthly rules and a kill switch protect the account. The dashboard trades only when you click.
This manual explains every window and button, with numbered pictures. Read it from top to bottom the first time, then use the contents to find a part quickly.
Get the product:
Rhino Dashboard Trade Panel MT5
Rhino Dashboard Trade Panel MT4
Free 7-day trial: download the trial version
Limited-time discount: 30% off until TODO-DATE. The price is $99 instead of $139.
Contents
- Introduction
- Getting started
- Top bar
- New Order: send a trade with a plan
- Orders: positions, pending orders and history
- News: economic calendar and news guard
- Stats: P/L calendar and trading statistics
- Risk: loss limits, targets and the kill switch
- Settings
- Strategy Tester controls
- Support, questions and feedback
Getting started
- Attach Rhino Dashboard to any chart and allow algorithmic trading.
- Open Risk and set your daily loss limit and the limits you want.
- Open New Order, choose the size by risk, set the SL and TP, add the exits.
- Press the Buy or Sell button. Follow the trade in Orders and in the top bar.
All settings are made in the panel and saved for each account. They stay after a restart of the terminal and after you change the chart symbol or timeframe.
Top bar
The top bar runs along the top of the chart. It shows your account, the prices, the profit and loss of the day, week and month, and the time, and it holds the buttons that control the whole dashboard.
The bar
Everything you need to watch while trading, in one line. Click the symbol, the timeframe or the clock to open their lists.
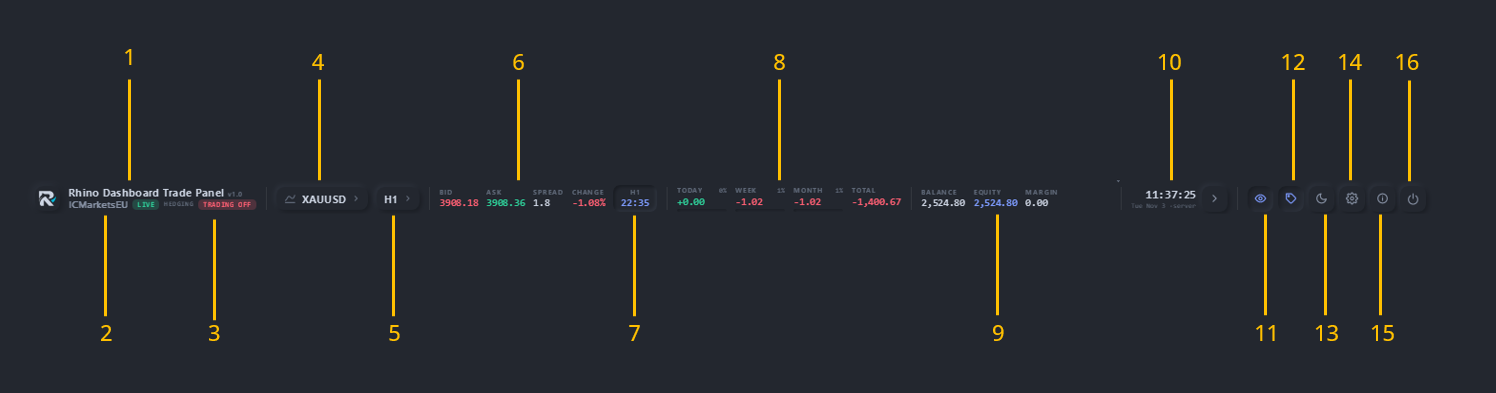
Figure 1. The top bar
- Name and version: the product name and its version number.
- Account badges: LIVE, DEMO or TESTER, hedging or netting.
- Trading off: shows when trading is off; point at it to see why.
- Symbol: the chart symbol; click it to open the watchlist.
- Timeframe: the chart timeframe; click it to change it.
- Prices: Bid, Ask, spread and the change of the day.
- Candle timer: the time left until the current candle closes.
- P/L monitor: profit or loss of today, the week, the month and total.
- Account: balance, equity and margin.
- Server clock: the server time and date; click the arrow for timers.
- Panel button: shows or hides the main panel.
- Trades on chart: shows or hides the labels of your trades on the chart.
- Theme: switches between the dark and the light theme.
- Settings: opens the Settings window.
- About: shows the version and the account.
- Remove: removes the dashboard from the chart after a question.
Watchlist
Search any symbol of your broker, keep your favourites with a star, and switch the chart to a symbol with one click.
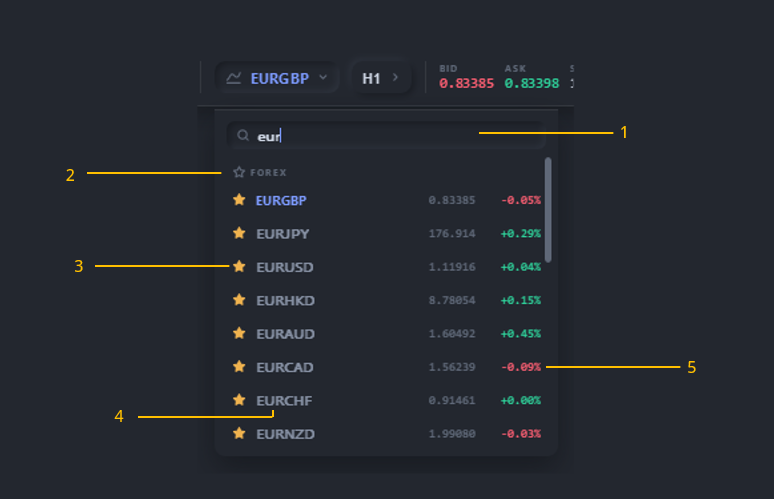
Figure 2. The watchlist
- Search box: type a part of a symbol name to find it.
- Group: symbols are grouped, for example Forex, Metals, Indices.
- Star: adds the symbol to your watchlist or removes it.
- Symbol row: click to switch the chart to this symbol.
- Price and change: the last price and the change of the day.
Timeframe
Change the chart timeframe from the top bar. The dashboard stays on the chart, and your plan and settings are kept.
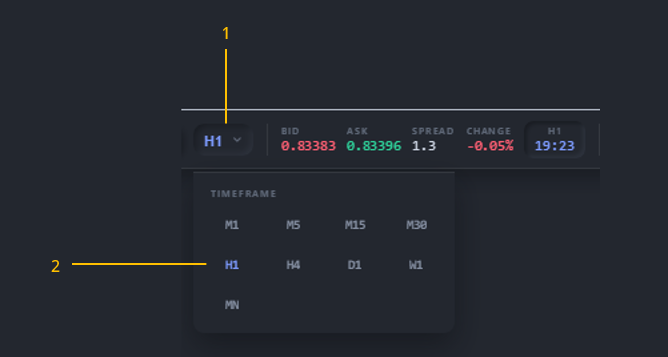
Figure 3. The timeframe list
- Timeframe button: opens the list; the current timeframe is lit.
- Timeframes: M1 to MN; click one to switch the chart.
Timers, sessions and clocks
Click the arrow next to the clock to see candle timers, market sessions, three clocks, the next news event and the week close.
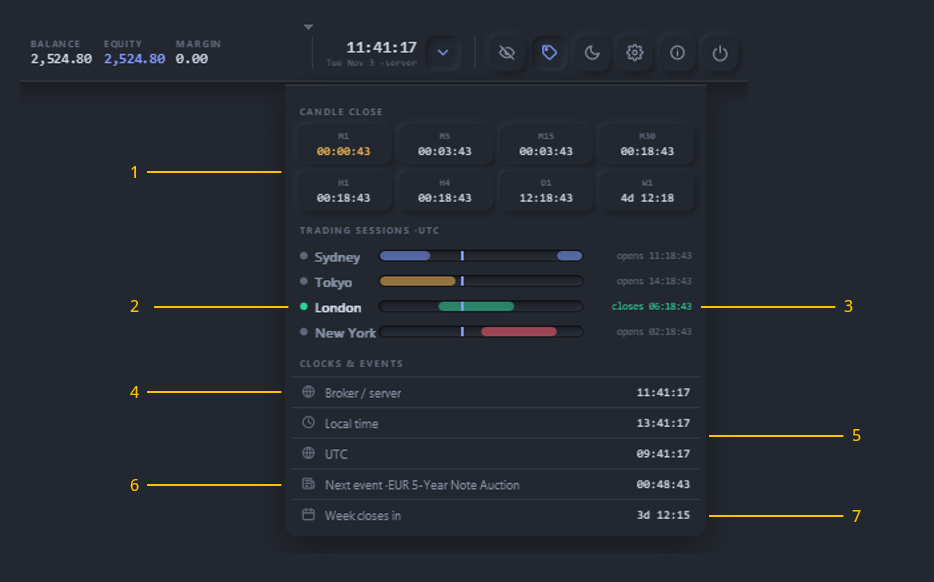
Figure 4. Timers, sessions and clocks
- Candle close: time left on each timeframe from M1 to W1.
- Trading sessions: Sydney, Tokyo, London and New York in UTC.
- Session state: when each session opens or closes.
- Broker / server: the time of the trade server.
- Local time and UTC: your computer time and world time.
- Next event: the next news event and the time until it.
- Week closes in: the time left until the market closes this week.
New Order: send a trade with a plan
New Order is where you build a trade. Choose the side, the size by risk and the order type, set the stop loss and take profit, and plan the exits in five sub-tabs. You see the risk, reward and margin before you send.
Order sub-tab: position size calculator
Set the size by lots, money or percent, and the SL and TP in price or pips. The panel turns your risk into a volume.
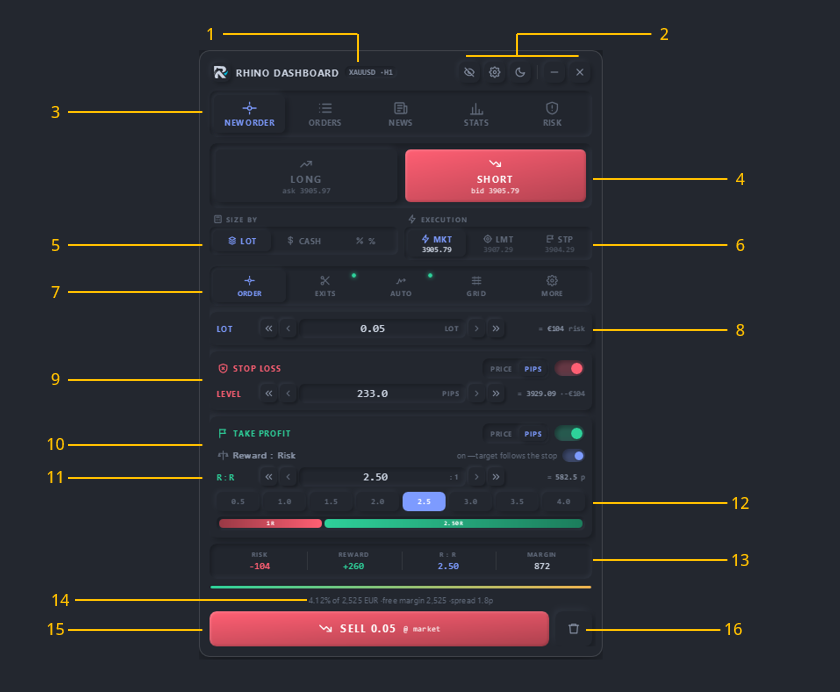
Figure 5. New Order, the Order sub-tab
- Panel header: the symbol and timeframe of the chart.
- Header buttons: trade box, settings, theme, minimise and close.
- Main tabs: New Order, Orders, News, Stats and Risk.
- Long / Short: the side of the trade, with the Ask or Bid price.
- Size by: Lot, Cash (money at risk) or % of the account.
- Execution: market, limit or stop order, with its price.
- Sub-tabs: Order, Exits, Auto, Grid and More; a dot means it is on.
- Size field: the lots, money or percent; arrows change it.
- Stop loss: on/off, in price or pips, with its money value.
- Take profit: on/off, in price or pips.
- Reward : Risk: when on, the TP follows the SL by this ratio.
- R:R presets: one click sets a ratio from 0.5 to 4.0.
- Summary: risk, reward, R:R and margin of this order.
- Hint line: risk as % of the account, free margin and spread.
- Send button: sends the order as shown on the button.
- Reset: puts the order back to its defaults.
Exits sub-tab: partial close
Plan up to four partial closes. Each level closes a part of the volume and can move the SL after it is hit.
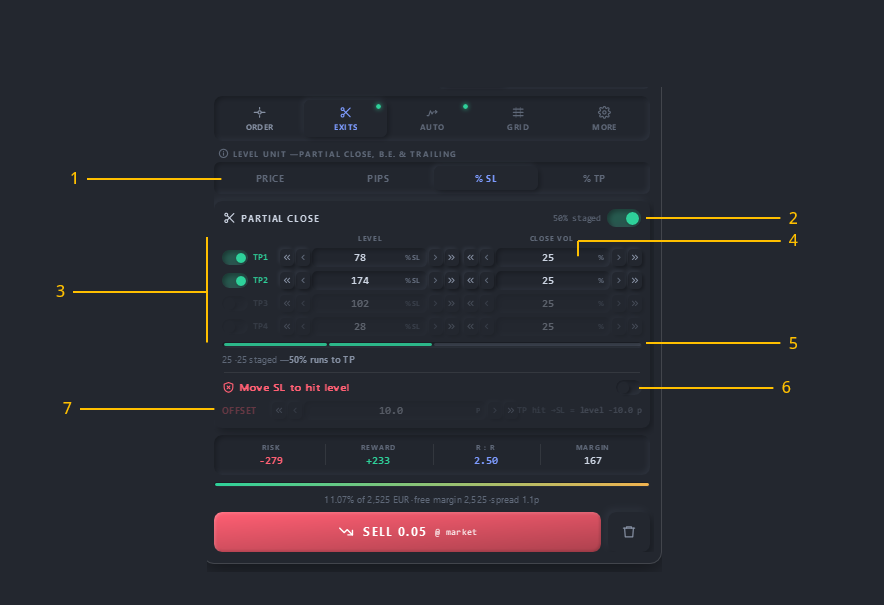
Figure 6. New Order, the Exits sub-tab
- Level unit: levels in price, pips, % of the SL or % of the TP.
- Partial close switch: turns the partial closes on or off.
- TP1 to TP4: switch each level on and set where it closes.
- Close vol: the percent of the volume closed at that level.
- Staged bar: how much is closed and how much runs to the TP.
- Move SL to hit level: after a level is hit, the SL moves to it.
- Offset: a distance added to the new SL.
Auto sub-tab: break-even and trailing stop
Move the SL to entry when price goes your way, and trail it in one of four modes.
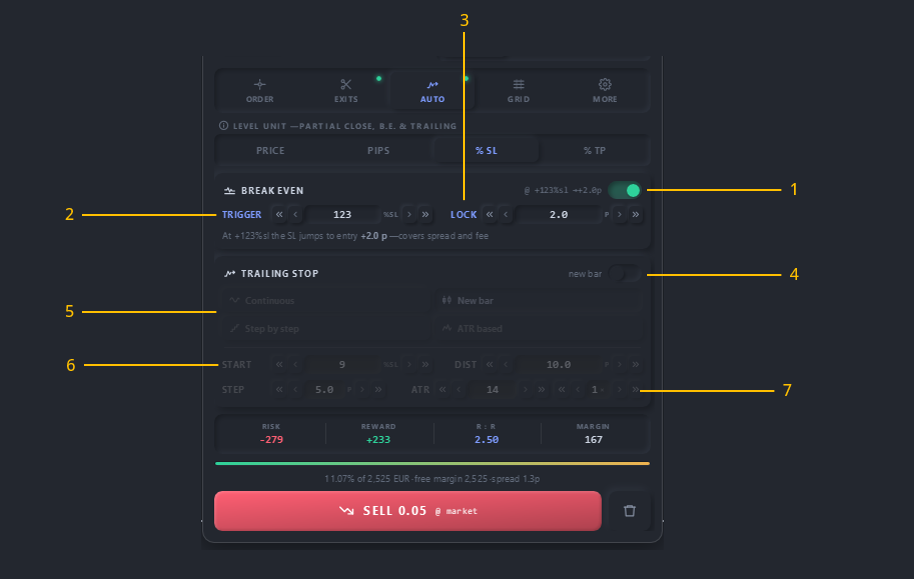
Figure 7. New Order, the Auto sub-tab
- Break even switch: turns the break-even on or off.
- Trigger: how far price must move before the SL goes to entry.
- Lock: the profit kept, in pips, to cover spread and fees.
- Trailing stop switch: turns the trailing stop on or off.
- Mode: Continuous, New bar, Step by step or ATR based.
- Start and Dist: when trailing starts and how far the SL follows.
- Step and ATR: the step size, or the ATR period and multiplier.
Grid sub-tab: a basket of orders
Place several orders at once, with the trend or against it, and see the total exposure and the worst case.
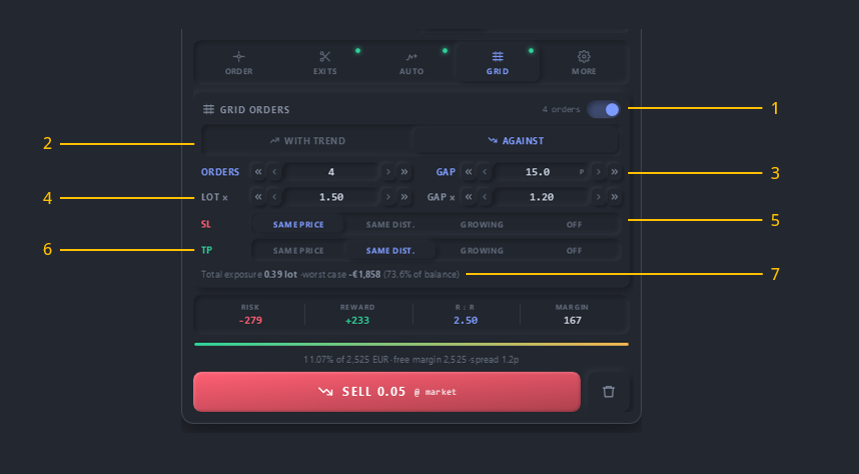
Figure 8. New Order, the Grid sub-tab
- Grid switch: turns the grid on; it shows the number of orders.
- Direction: With trend or Against the price move.
- Orders and Gap: how many orders and the distance between them.
- Lot x and Gap x: how lots and gaps grow from order to order.
- SL mode: same price, same distance, growing, or off.
- TP mode: same price, same distance, growing, or off.
- Exposure line: total lots and the loss if every SL is hit.
More sub-tab: order options and guards
Fine-tune how the order is sent and add simple guards that stop a bad order.
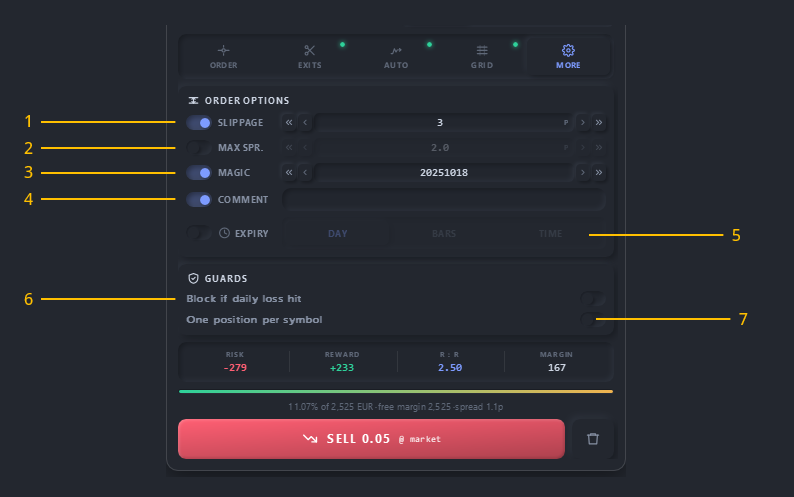
Figure 9. New Order, the More sub-tab
- Slippage: the most price may move while the order is filled.
- Max spread: the order is not sent if the spread is wider.
- Magic: the magic number written on the order.
- Comment: the text written on the order.
- Expiry: a pending order ends after a day, some bars or a time.
- Block if daily loss hit: no new order once the daily limit is hit.
- One position per symbol: no second trade on the same symbol.
Trade box on the chart
The order you build is drawn on the chart. Drag the lines to change the entry, SL, TP and exit levels with the mouse.
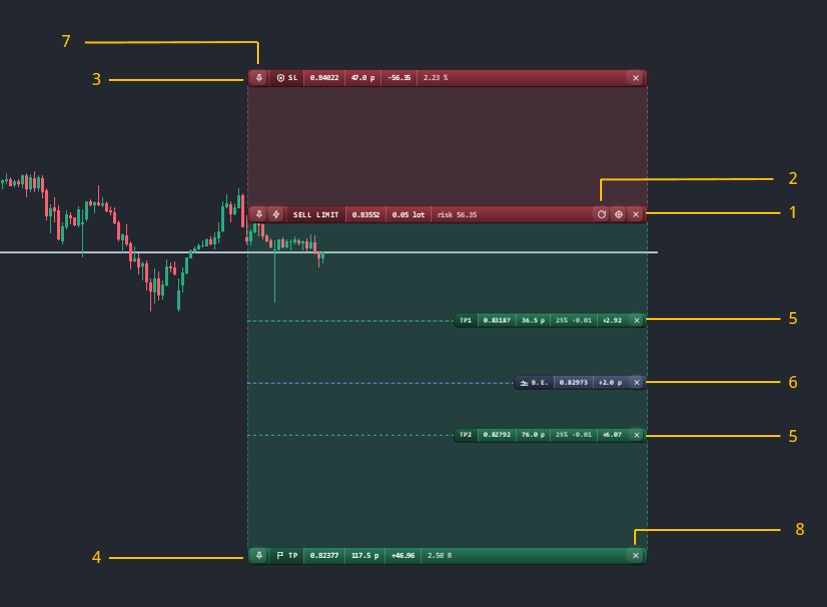
Figure 10. The trade box
- Entry line: order type, price, lots and risk; drag it to move.
- Entry buttons: reverse the side, change the type, send the order.
- SL line: the stop loss with its distance, money and percent.
- TP line: the take profit with its distance, money and R value.
- TP1, TP2: partial close levels with the part they close.
- B.E. line: where the break-even moves the SL.
- Pin: keeps a line at its price instead of its distance.
- Close (x): removes that level from the plan.
Orders: positions, pending orders and history
Orders lists your open positions, pending orders and closed deals. Edit or close one trade, or close many at once, and see the open P/L, volume and margin.
Positions
Every open trade with its entry, SL, TP and live P/L. The same trades are labelled on the chart.
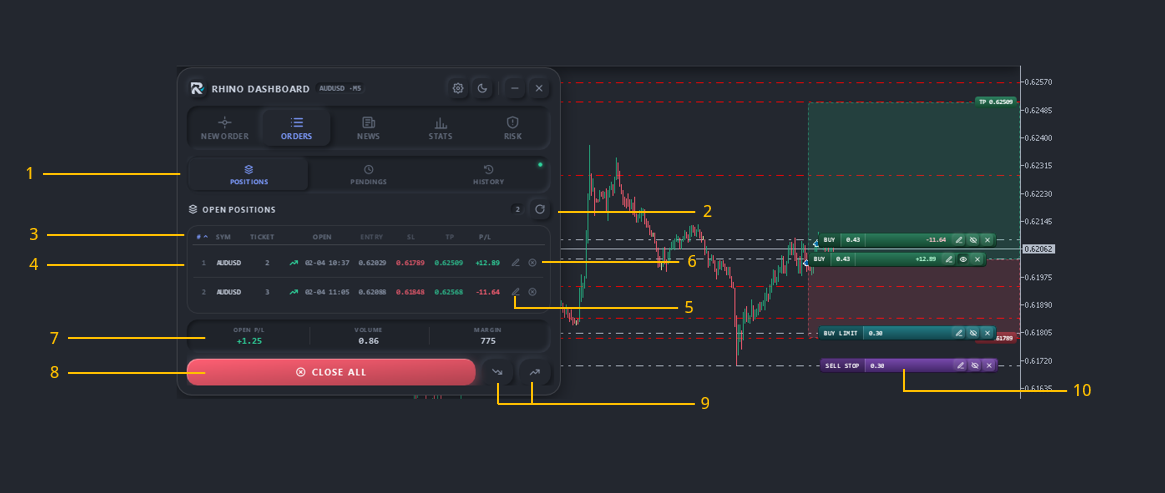
Figure 11. Orders, the Positions sub-tab
- Sub-tabs: Positions, Pendings and History.
- Refresh: reads the trades again.
- Table head: click a column to sort the table.
- Position row: symbol, ticket, time, entry, SL, TP and P/L.
- Edit: opens the trade in New Order to change its plan.
- Close: closes this position.
- Summary: open P/L, total volume and margin.
- Close all: closes every open position.
- Close losers / winners: closes only losing or winning trades.
- Trade labels: each trade on the chart, with edit and close.
Others: Pendings and History
Pendings lists the pending orders with their type, price, SL and TP. Delete one order, or delete all pending orders at once. History lists your closed deals. Filter them by period (today, week, month, custom), symbol, side, result and magic number. A summary shows the net result, wins, losses, win rate and profit factor, and you can export the deals to a CSV file.
News: economic calendar and news guard
News shows the economic calendar of MetaTrader for today, tomorrow or this week. Filter by impact and currency, get alerts, draw events on the chart, and let the news guard pause trading around a release.
News list and alert settings
See the next event with a countdown, the event list by day, and the settings for alerts and the news guard.
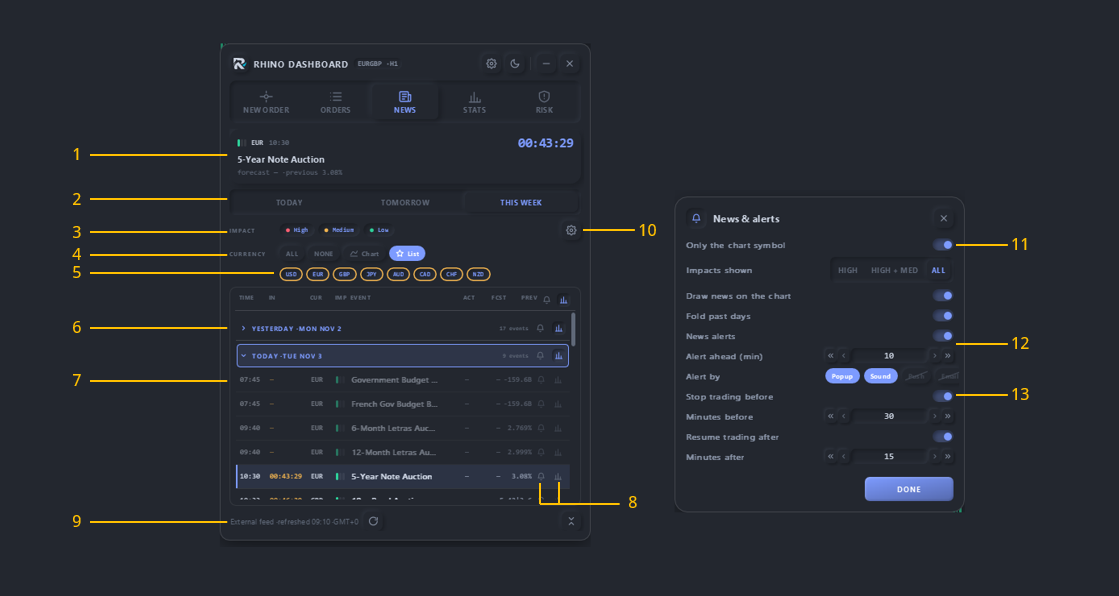
Figure 12. The News window and its settings
- Next event: currency, time, name, forecast and a countdown.
- Range: Today, Tomorrow or This week.
- Impact filter: High, Medium and Low.
- Currency filter: All, None, the chart's or the watchlist's.
- Currency chips: click a currency to show or hide it.
- Day header: folds or opens the events of a day.
- Event row: time, countdown, currency, impact, event and values.
- Bell and chart icons: sound alert and line on the chart.
- Source line: where the news comes from and the last refresh.
- Gear: opens the News and alerts settings.
- Only the chart symbol: shows only its currencies.
- Alerts: how many minutes ahead, and by popup, sound, push or mail.
- Stop trading before / resume after: the news guard minutes.
Stats: P/L calendar and trading statistics
Stats turns your trade history into trading statistics. The Calendar shows the result of each day, and Analysis gives the win rate, drawdown, expectancy and charts, filtered as you like.
Calendar
A monthly P/L calendar. Green days made money, red days lost. Click a day to see its trades.
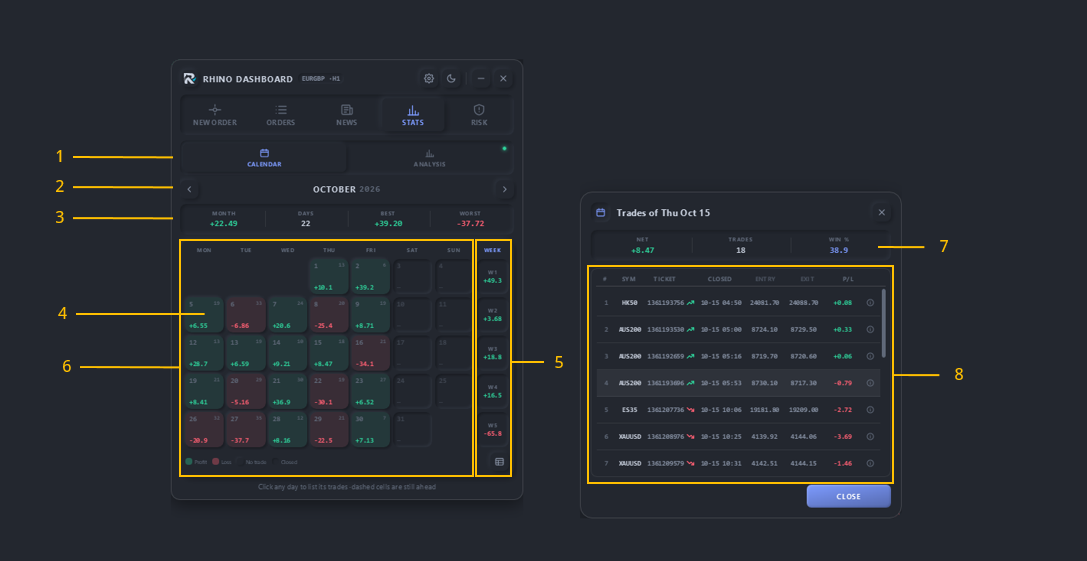
Figure 13. Stats, the P/L calendar and a day's trades
- Sub-tabs: Calendar and Analysis.
- Month: arrows go to the month before or after.
- Month summary: net result, trading days, best and worst day.
- Day cell: the day's P/L; the small number is its trade count.
- Week column: the result of each week.
- Month list: the table icon lists every trade of the month.
- Day window: net, trades and win % of the day you clicked.
- Day trades: each trade; the (i) icon opens its details.
Analysis: filter and trades
Choose the period, symbols, side and session, then read the filtered trades. Each trade has a details window.
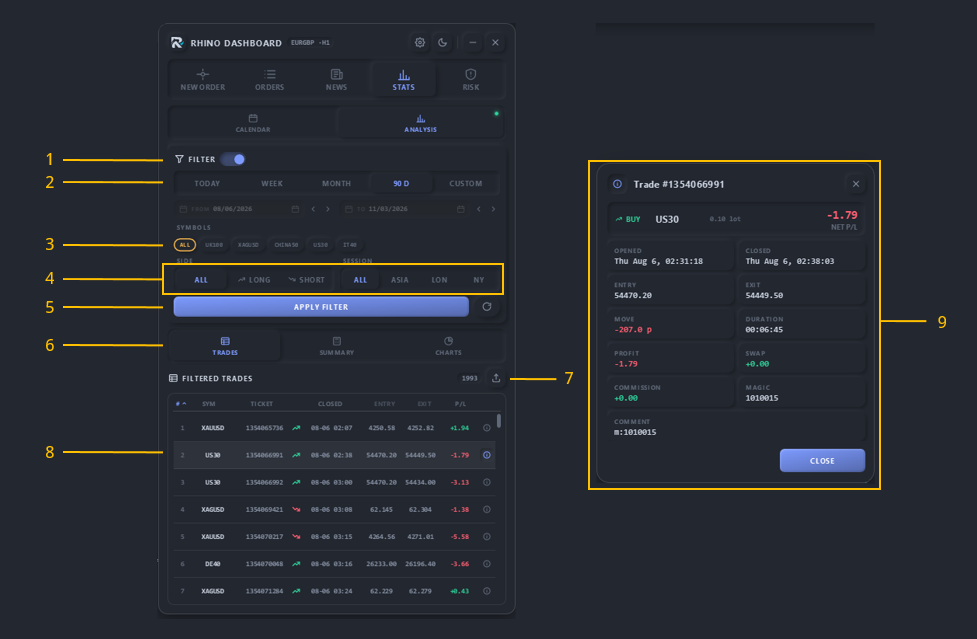
Figure 14. Stats, Analysis: the filter and the trades
- Filter switch: turns the filter on or off.
- Period: Today, Week, Month, 90 days or Custom dates.
- Symbols: all symbols, or click the ones you want.
- Side and Session: long or short; Asia, London or New York.
- Apply filter: runs the filter; the round button resets it.
- Views: Trades, Summary and Charts.
- Export: saves the filtered trades to a CSV file.
- Trade row: some details of trade and more info button.
- Trade details: times, prices, move, profit, swap and commission.
Analysis: summary
The key numbers of your trading for the filter: profit, win rate, averages, expectancy, drawdown and streaks.
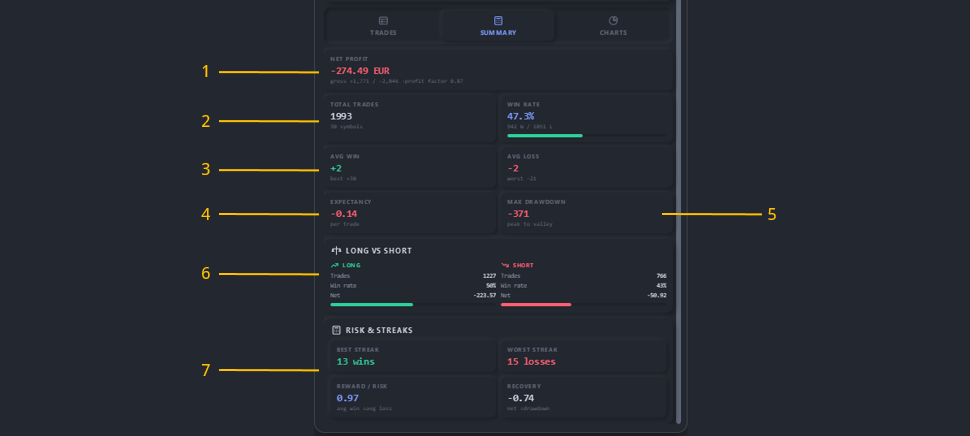
Figure 15. Stats, Analysis: the summary
- Net profit: the result, gross profit and loss, and profit factor.
- Total trades and Win rate: count, wins and losses.
- Avg win and Avg loss: average result, with the best and worst.
- Expectancy: the average result per trade.
- Max drawdown: the largest fall from a peak.
- Long vs Short: trades, win rate and net for each side.
- Risk and streaks: best and worst streak, reward/risk, recovery.
Analysis: charts
See your trading as pictures: the balance curve, the win and side split, monthly results and sessions.
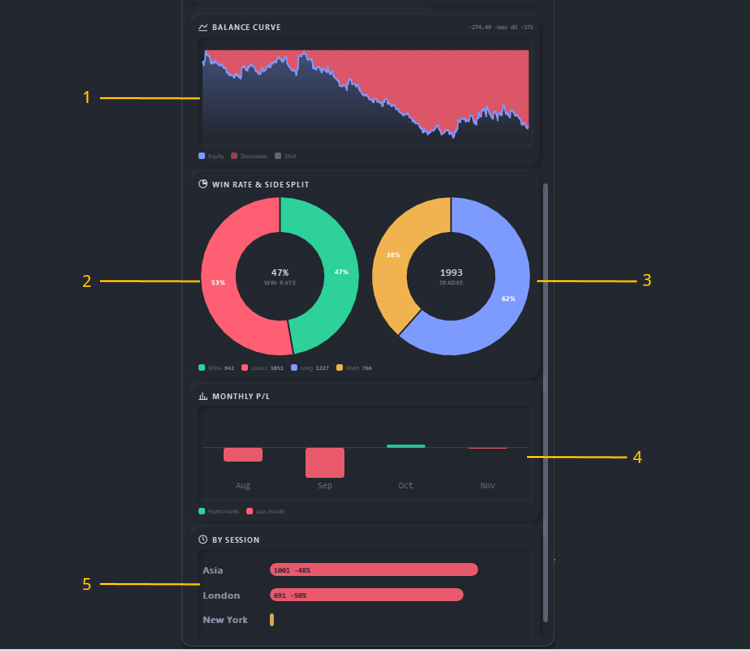
Figure 16. Stats, Analysis: the charts
- Balance curve: equity over time with the drawdown area.
- Win rate: the share of winning and losing trades.
- Side split: the share of long and short trades.
- Monthly P/L: a bar for the result of each month.
- By session: trades and win rate in Asia, London and New York.
Risk: loss limits, targets and the kill switch
Risk is the risk manager. Set a daily loss limit, weekly and monthly rules, profit targets and trading limits. When a limit is hit, the dashboard warns you, blocks new trades or closes positions.
P/L Rules
A loss limit and a profit target for each day, week and month, in money or percent, each with its alerts and actions.
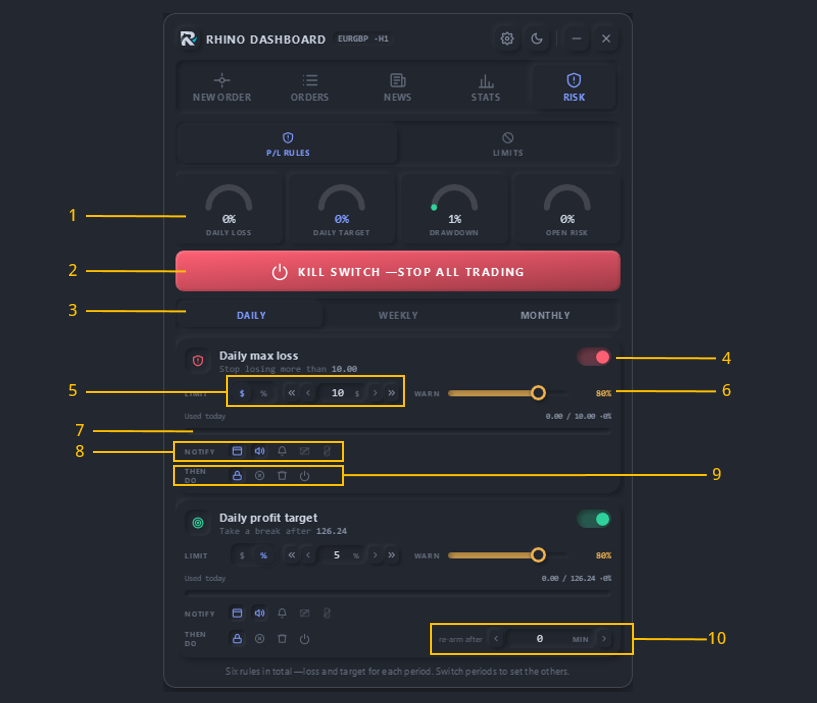
Figure 17. Risk, the P/L Rules sub-tab
- Gauges: daily loss, daily target, drawdown and open risk used.
- Kill switch: closes everything and stops all new trading.
- Period: Daily, Weekly or Monthly rules.
- Rule switch: turns the loss limit or the profit target on.
- Limit: the amount in money ($) or percent (%).
- Warn: you get a warning at this percent of the limit.
- Used bar: how much of the limit is used in this period.
- Notify: popup, sound, alert, e-mail or push.
- Then do: block trades, close positions, delete orders, stop EA.
- Re-arm after: minutes before a target rule works again.
Limits
Rules for every trade and for your trading day: risk per trade, counts, streaks, hours and the Friday close.
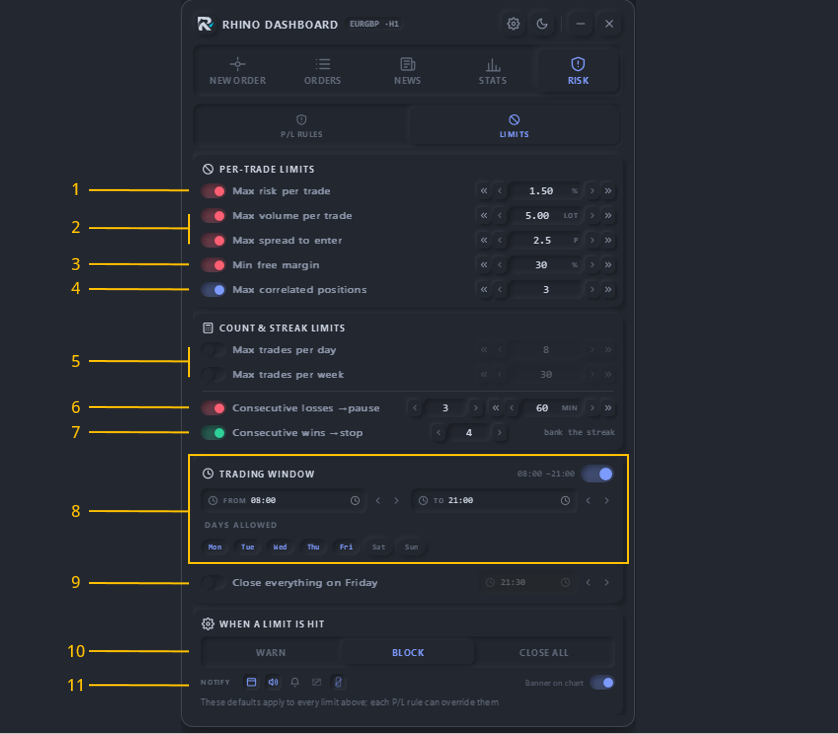
Figure 18. Risk, the Limits sub-tab
- Max risk per trade: the largest risk one trade may take.
- Max volume and spread: the largest lot and spread allowed.
- Min free margin: no new trade below this free margin.
- Max correlated positions: limit trades on related symbols.
- Max trades per day / week: how many trades you may open.
- Consecutive losses: pause for some minutes after N losses.
- Consecutive wins: stop for the day after N wins.
- Trading window: the hours and days you may trade.
- Close everything on Friday: closes all at this Friday time.
- When a limit is hit: Warn, Block or Close all.
- Notify and banner: how you are told, and a banner on the chart.
Settings
Settings holds every option of the dashboard in eleven sections. Open it from the gear button in the top bar or the panel. Restore defaults puts all values back.
General
The basic behaviour of the dashboard and its language.
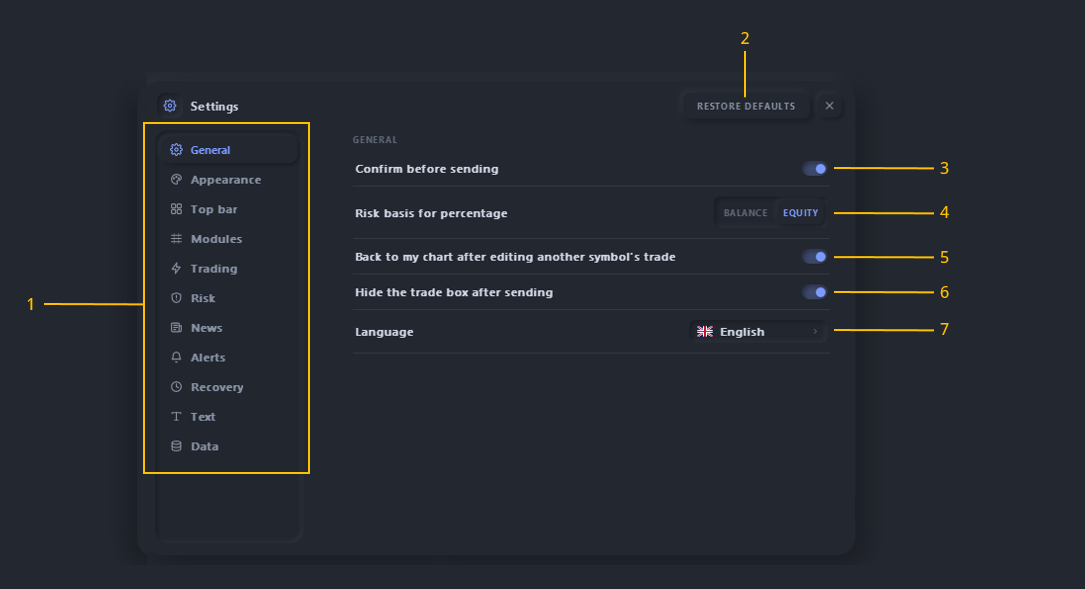
Figure 19. Settings, General
- Sections: the list of the eleven settings sections.
- Restore defaults: puts every setting back to its default.
- Confirm before sending: asks before each order is sent.
- Risk basis: percent risk from balance or from equity.
- Back to my chart: returns after editing another symbol's trade.
- Hide the trade box after sending: clears the box after a send.
- Language: English, Russian, Chinese or Spanish.
Appearance
Make the dashboard look the way you like and fit your screen.
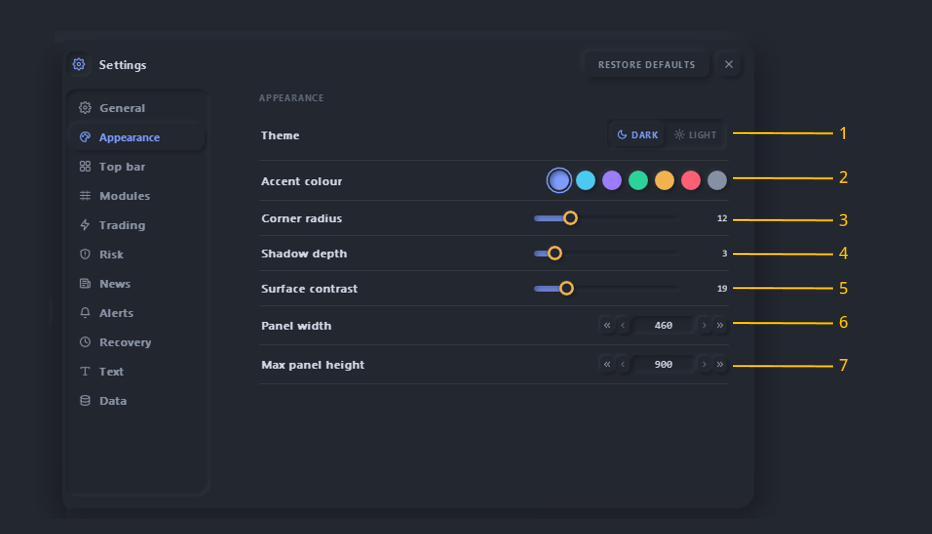
Figure 20. Settings, Appearance
- Theme: dark or light.
- Accent colour: the colour of buttons and highlights.
- Corner radius: how round the corners are.
- Shadow depth: how strong the shadows are.
- Surface contrast: how much the parts stand out.
- Panel width: the width of the main panel in pixels.
- Max panel height: the tallest the panel may grow.
Others: the other settings sections
- Top bar: show or hide the quotes, P/L, account and clock groups, and set the bar height.
- Modules: show or hide each main tab and its sections, the watchlist, and the Exits, Auto and Grid tools.
- Trading: default size, SL, TP and R:R, slippage, magic number, comment, the trade box and close confirmations.
- Risk: turn the risk manager and its rule groups on or off, the default limits, the warn level and the allowed actions.
- News: the news source and refresh, the time shift, and what the news guard may do (close, delete, widen the SL).
- Alerts: popup, sound, push and e-mail, the sounds, repeat until seen, and quiet hours.
- Recovery: what to do with plans that were passed while the terminal was off, for example a missed break-even.
- Text: fonts, number, currency and date formats, tooltips, hints and label size.
- Data: the output folder and file names of exports, and diagnostic logs.
Strategy Tester controls
The same dashboard runs in the Strategy Tester in visual mode, so you can practise and check your rules on history. In the tester, values are set with the step buttons, and extra controls let you skip bars.
Tester toolbar
Shown in the top bar only in the tester. It moves time forward quickly while you wait for a setup.
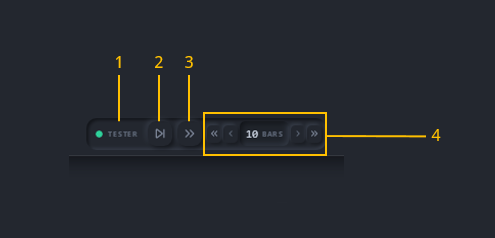
Figure 21. The tester toolbar
- Tester badge: the dashboard runs in the Strategy Tester.
- Skip one bar: hides the dashboard until the next candle.
- Skip: hides the dashboard and runs fast for the bars set.
- Bars: how many bars to skip when press item 3.
Skipping
While bars are skipped, a small card shows the progress, and you can stop at any time.
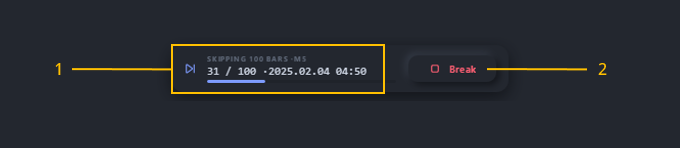
Figure 22. Skipping bars
- Progress: bars skipped, the total, and the tester time.
- Break: stops skipping and shows the dashboard again.
The Strategy Tester replays historical data: results there are a simulation, not real trading results. The economic calendar, push and e-mail do not work in the tester.
Support, questions and feedback
If you have a question, a suggestion or a bug report, please write a comment on the product page, so other traders can see the answer too. Your ideas shape the next versions. If the dashboard helps your trading, a review on the product page helps other traders decide.
Product pages:
Rhino Dashboard Trade Panel MT5
Rhino Dashboard Trade Panel MT4
Free 7-day trial: download the trial version