
Order Flow Footprint Workspace 1.00 — Complete User Guide for MetaTrader 5
8 October 2026, 09:50

0
30
Order Flow Footprint Workspace for MT5 — Complete User Guide
Order Flow Footprint Workspace is a read-only order-flow and market microstructure workspace for MetaTrader 5.
It transforms the tick information supplied by your broker into a session-based footprint interface with price-level activity, profiles, historical navigation and diagnostics.
A central design principle of the workspace is data honesty: it adapts to what the broker feed can actually support instead of manufacturing information that is not present in the source data.
This guide explains the complete v1.00 workflow: installation, feed modes, live use, historical navigation, price grouping, profiles, diagnostics, inputs and troubleshooting.
1. First start
Install Order Flow Footprint Workspace from MQL5 Market and attach it to a MetaTrader 5 chart.
The workspace is an Expert Advisor because it needs persistent runtime access to tick data, storage and chart interaction, but it is strictly read-only:
• it does not place orders;
• it does not modify positions;
• it does not close positions;
• it does not generate trading signals.
After initialization, the original chart is replaced visually by the Order Flow Footprint Workspace.
The top-left badge indicates the semantic mode selected from the available broker data.
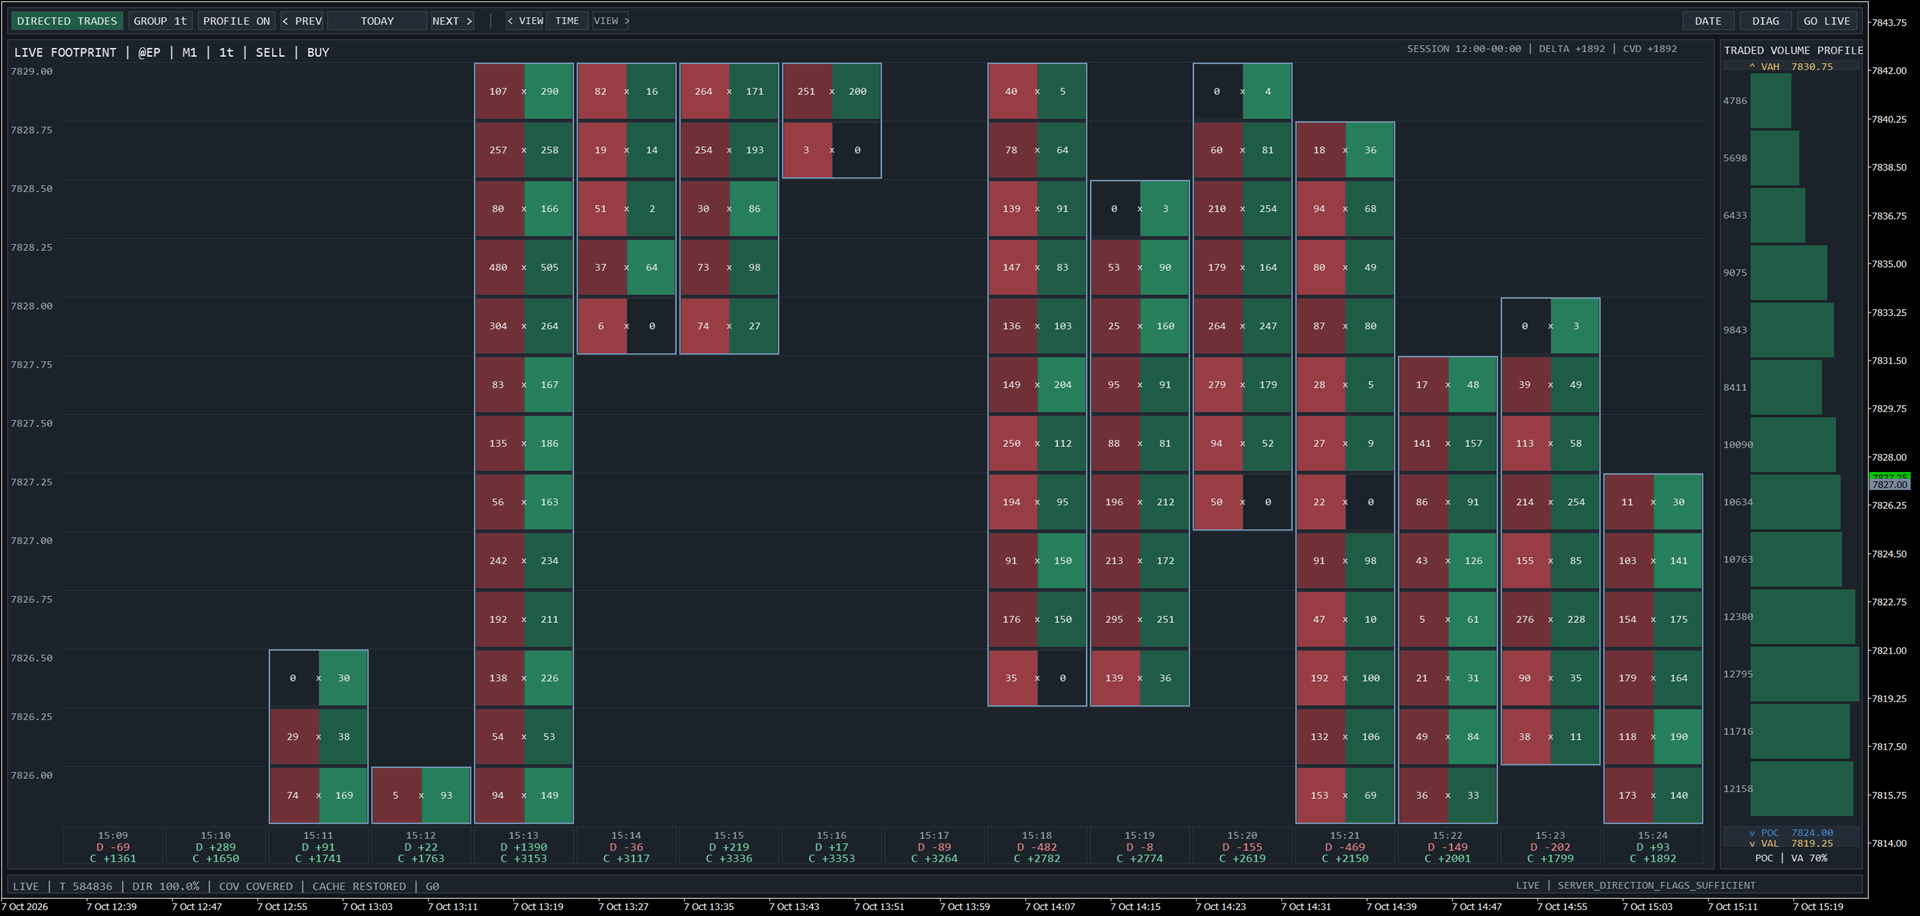
Order Flow Footprint Workspace in LIVE DIRECTED TRADES mode, with SELL × BUY footprint candles and the session traded-volume profile.
2. Understanding broker feed modes
Not every MetaTrader 5 broker supplies the same tick information.
This is particularly important for order-flow tools.
Order Flow Footprint Workspace therefore inspects the available feed and selects a compatible semantic mode automatically.
You cannot manually force a richer mode than the source data supports.
DIRECTED TRADES
When the server provides reliable trade-direction information, the workspace can display:
• SELL × BUY footprint values;
• bar Delta;
• Cumulative Volume Delta;
• Traded Volume Profile;
• POC;
• Value Area High;
• Value Area Low.
The red side of a footprint level represents SELL volume and the green side represents BUY volume.
Below each footprint candle:
• D = Delta of that candle;
• C = cumulative Delta from the configured session start.
QUOTE ACTIVITY
Many FX and CFD feeds do not provide sufficiently reliable information to determine the true aggressor side of executed trades.
In that case the workspace switches to QUOTE ACTIVITY rather than estimating a synthetic BUY/SELL order flow.
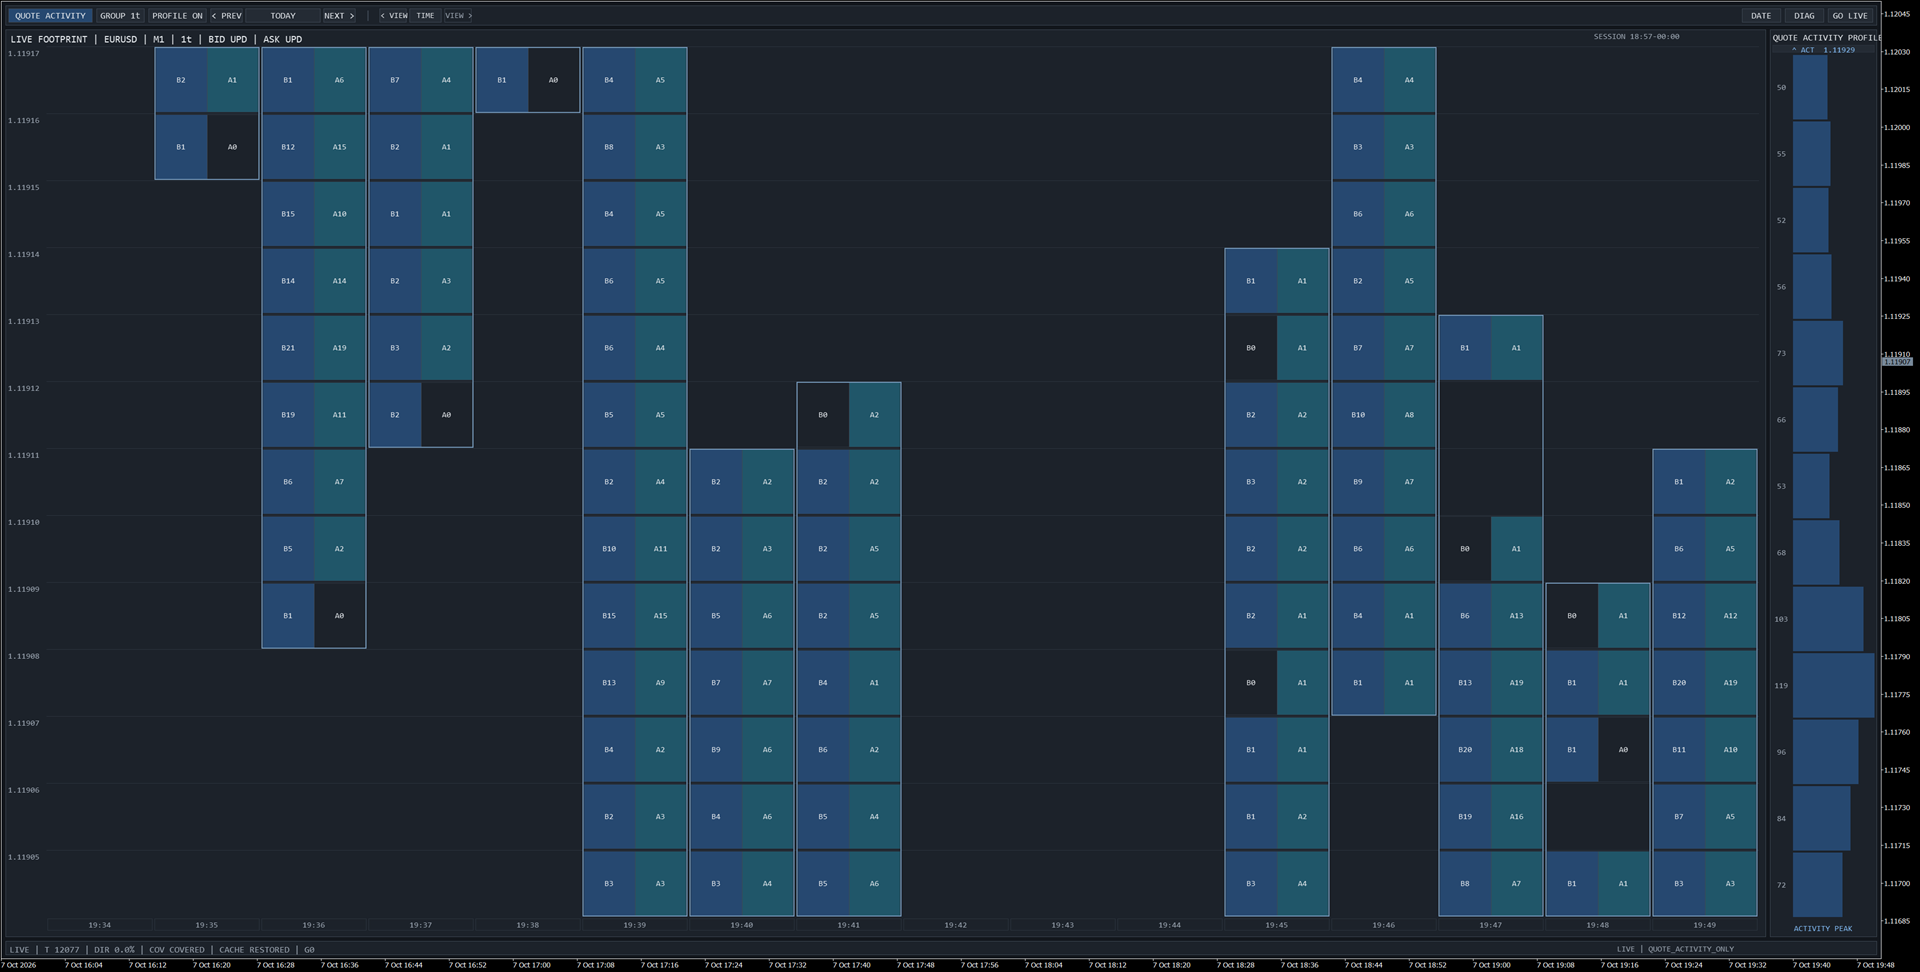
QUOTE ACTIVITY mode on EURUSD. BID and ASK update activity are displayed in blue, with an Activity Profile instead of traded-volume statistics.
In Quote Activity mode the workspace can display:
• BID update activity;
• ASK update activity;
• Quote Activity footprint;
• Activity Profile;
• Activity Peak.
Delta, CVD and traded-volume POC/Value Area are intentionally not displayed when the feed cannot support them.
This difference is expected behavior and does not indicate a malfunction.
3. The main workspace
The toolbar contains the controls used during normal operation.
Depending on the current state and available chart width, you can see controls such as:
DATA MODE | GROUP | PROFILE | PREV | TODAY/DATE | NEXT | < VIEW | TIME | VIEW > | DATE | DIAG | GO LIVE
The workspace supports the following MetaTrader chart timeframes:
• M1
• M5
• M15
• M30
• H1
Changing timeframe changes the temporal aggregation of the footprint. It does not artificially alter the underlying stored session information.
4. Price grouping
Use the GROUP button to cycle through:
• 1 tick
• 2 ticks
• 5 ticks
• 10 ticks
Grouping changes the number of native price levels combined into one displayed footprint row.
A smaller grouping provides greater price detail.
A larger grouping produces a more compressed view and is useful when the visible price range becomes dense.
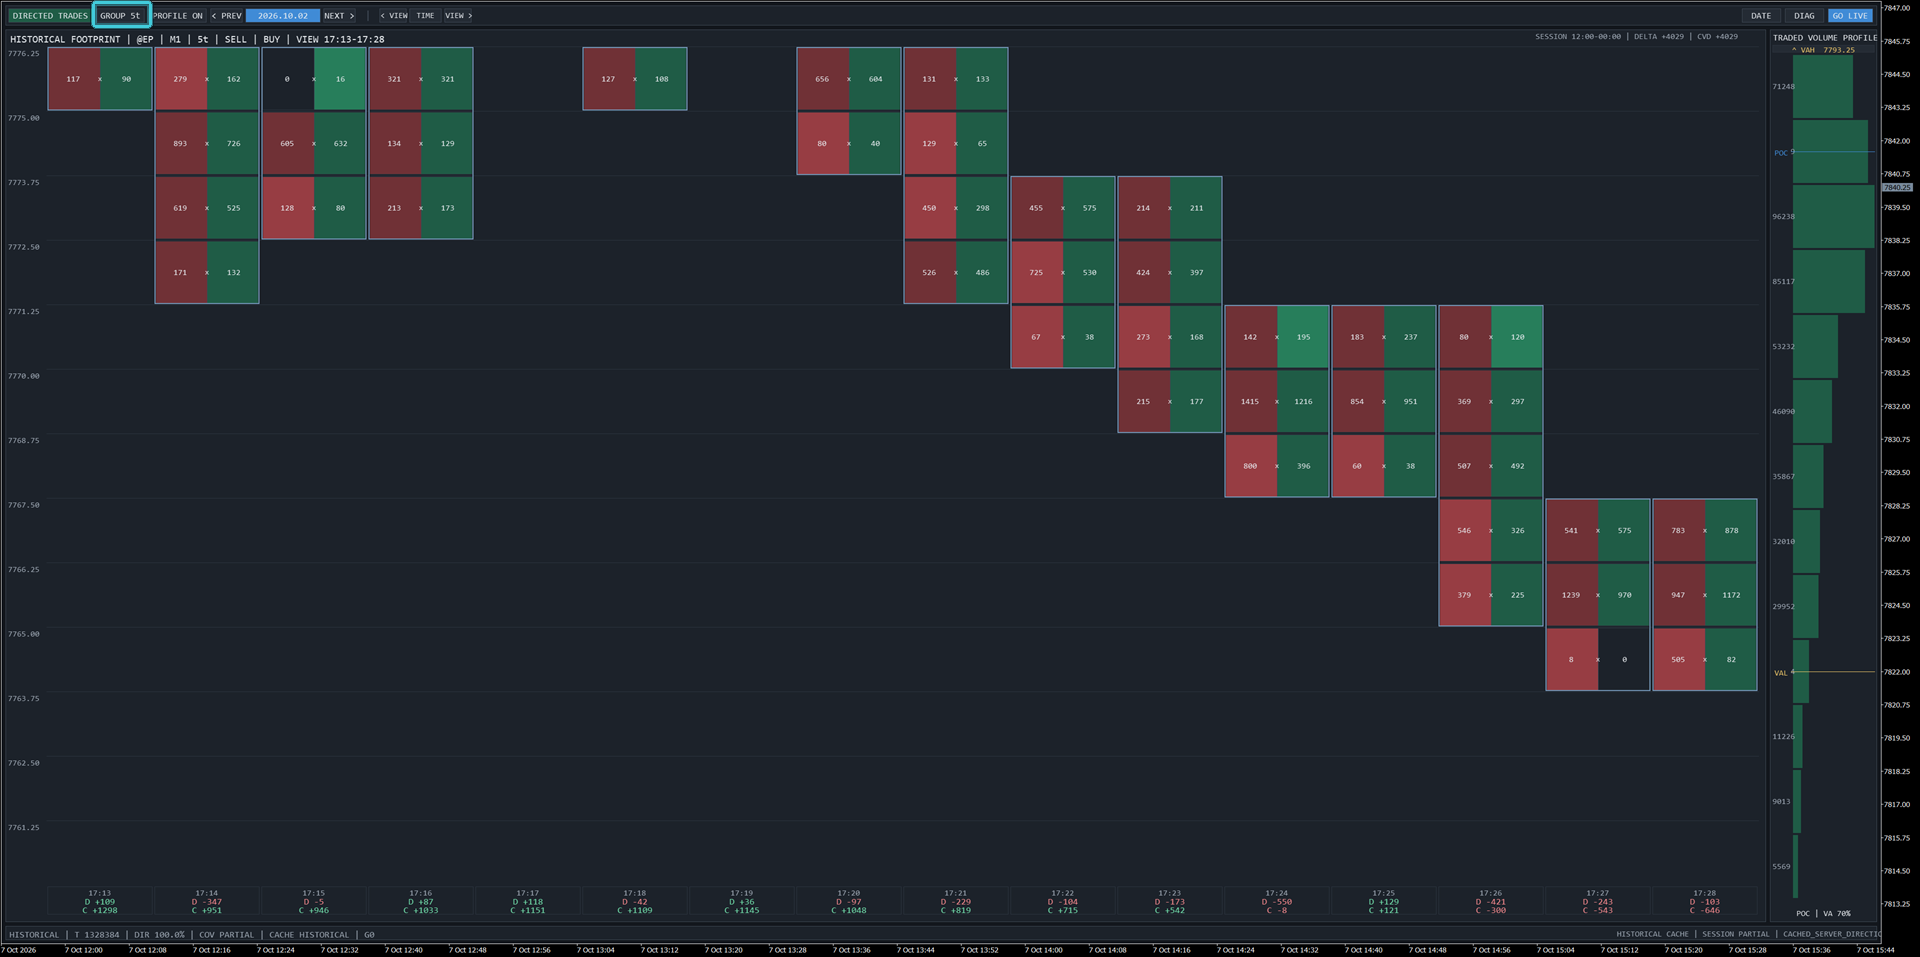
The same footprint workspace using 5-tick price grouping.
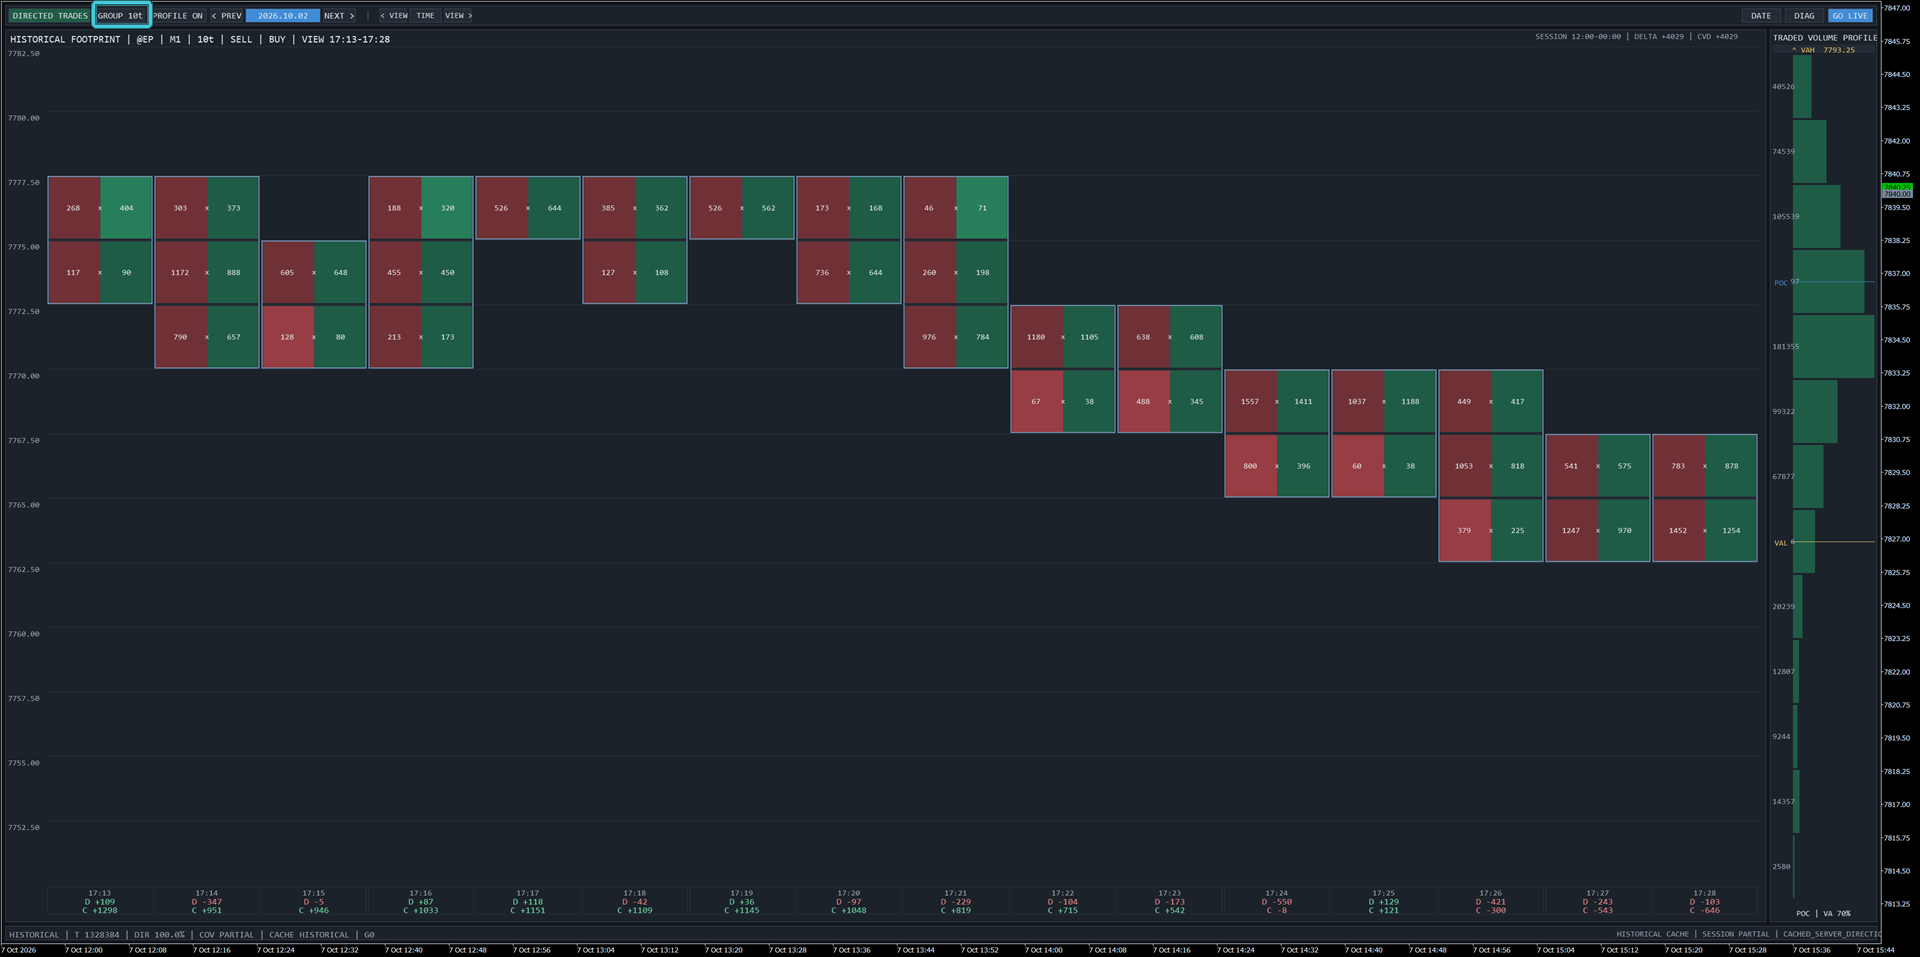
10-tick grouping provides a more compressed view while keeping session statistics and profile information available.
Grouping is a display transformation. It does not create additional market information.
When profile markers such as POC and VAH fall into the same grouped display level, the workspace can combine their labels, for example:
POC/VAH
This prevents one marker from visually hiding another.
5. Session Profile, POC and Value Area
Select PROFILE ON to display the profile on the right side of the workspace.
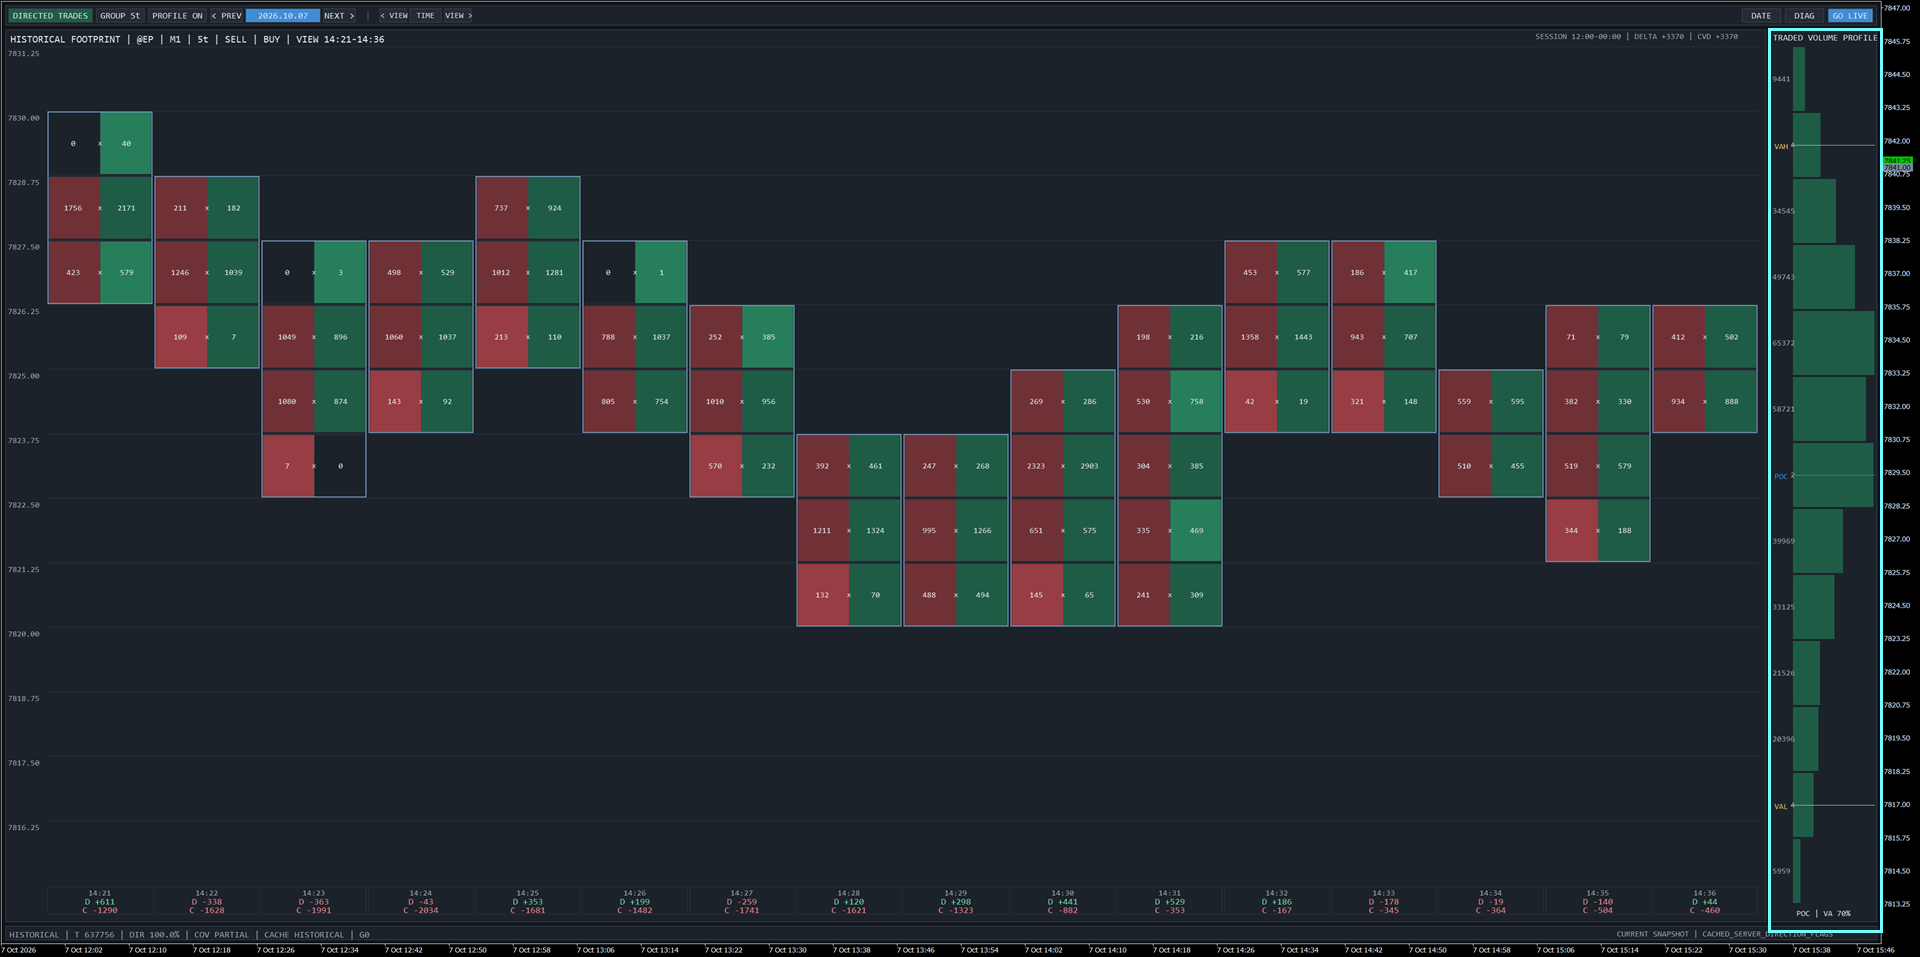
Traded Volume Profile with POC, VAH and VAL displayed on the right side of the workspace.
In DIRECTED TRADES mode, the profile represents traded volume.
The main levels are:
• POC — Point of Control: the price level with the highest qualifying session volume;
• VAH — Value Area High: upper boundary of the configured Value Area;
• VAL — Value Area Low: lower boundary of the configured Value Area.
The Value Area percentage can be changed in the EA inputs. The default value is 70%.
In QUOTE ACTIVITY mode, this profile becomes an Activity Profile, and the main highlighted level is the Activity Peak.
Select PROFILE OFF if you prefer to use more horizontal space for the footprint.
6. LIVE mode
In LIVE mode the workspace continuously processes the available tick stream.
The bottom status bar provides a compact summary of the runtime state, including information such as:
• LIVE / HISTORICAL state;
• tick count;
• directional coverage;
• data coverage;
• cache state;
• current session condition.
The future portion of an active session is not treated as missing data.
However, if the workspace was started after the configured session had already begun and the missing earlier data cannot be recovered, the overall session may be marked as partial.
This distinction is important:
COV COVERED
can be true for the currently requested live window while the complete configured session is still:
SESSION PARTIAL
7. Historical sessions
Order Flow Footprint Workspace stores collected sessions locally.
A historical session is a read-only snapshot. Viewing it does not stop the live data collector in the background.
Available controls include:
• PREV — open the previous stored session;
• NEXT — move to the next stored session;
• TODAY / displayed date — open the current-day snapshot;
• DATE — open a specific stored date;
• GO LIVE — return to the current live session.
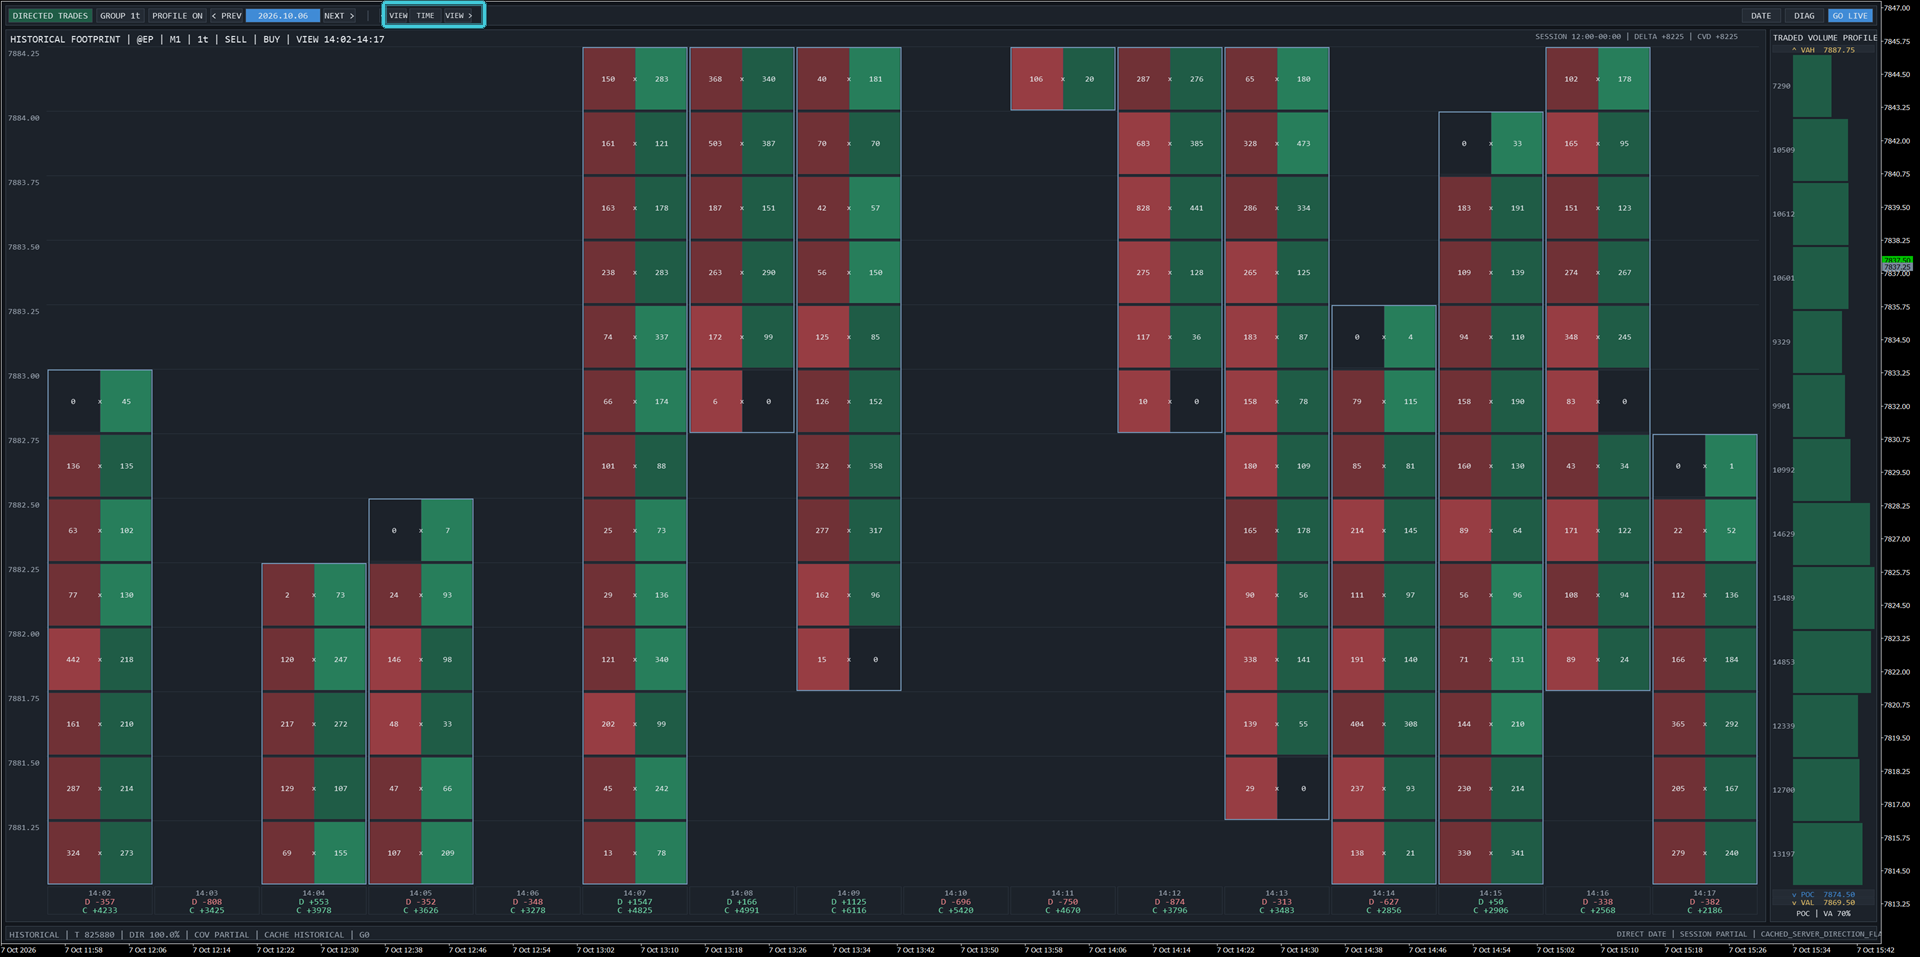
Historical session view. PREV/NEXT change sessions, while the VIEW controls navigate inside the selected day.
When you return to GO LIVE, the live collector resumes on screen with the ticks that arrived while you were reviewing history.
8. Opening a specific date
Click DATE to open the date-entry overlay.
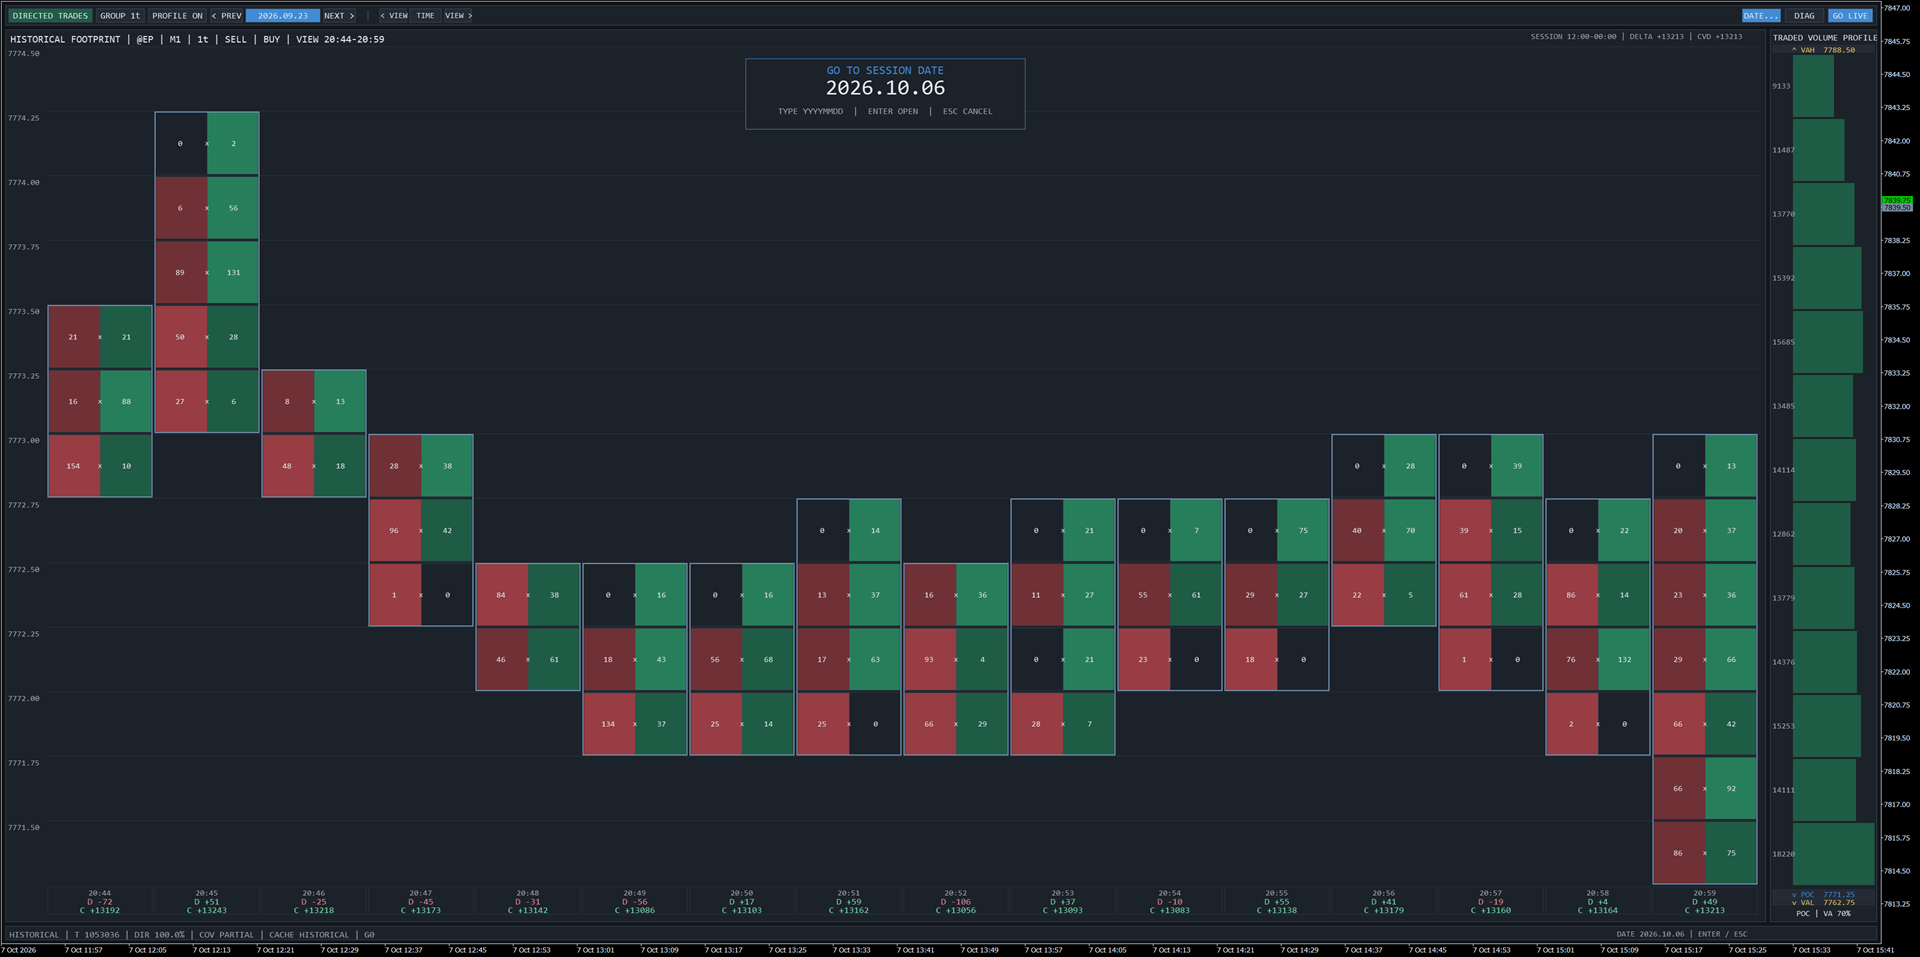
Direct historical date selection. Enter a date in YYYYMMDD format and press Enter.
The expected format is:
YYYYMMDD
Example:
20261007
Controls:
• digits — enter the date;
• Backspace — correct the input;
• Enter — open;
• Esc — cancel.
If the requested date is not available in the local session cache, the workspace reports:
DATE NOT CACHED
and keeps the current view unchanged.
9. Navigating inside a historical day
A stored session can contain much more data than can be displayed comfortably on one screen.
RC2 therefore provides intra-session navigation:
< VIEW | TIME | VIEW >
VIEW controls
< VIEW moves to an earlier window.
VIEW > moves to a later window.
The viewport normally keeps a small overlap between consecutive windows so that visual context is not lost.
At the boundaries you may see:
START OF AVAILABLE DATA
or:
END OF AVAILABLE DATA
Direct TIME selection
Click TIME to go directly to a specific point inside the current session.
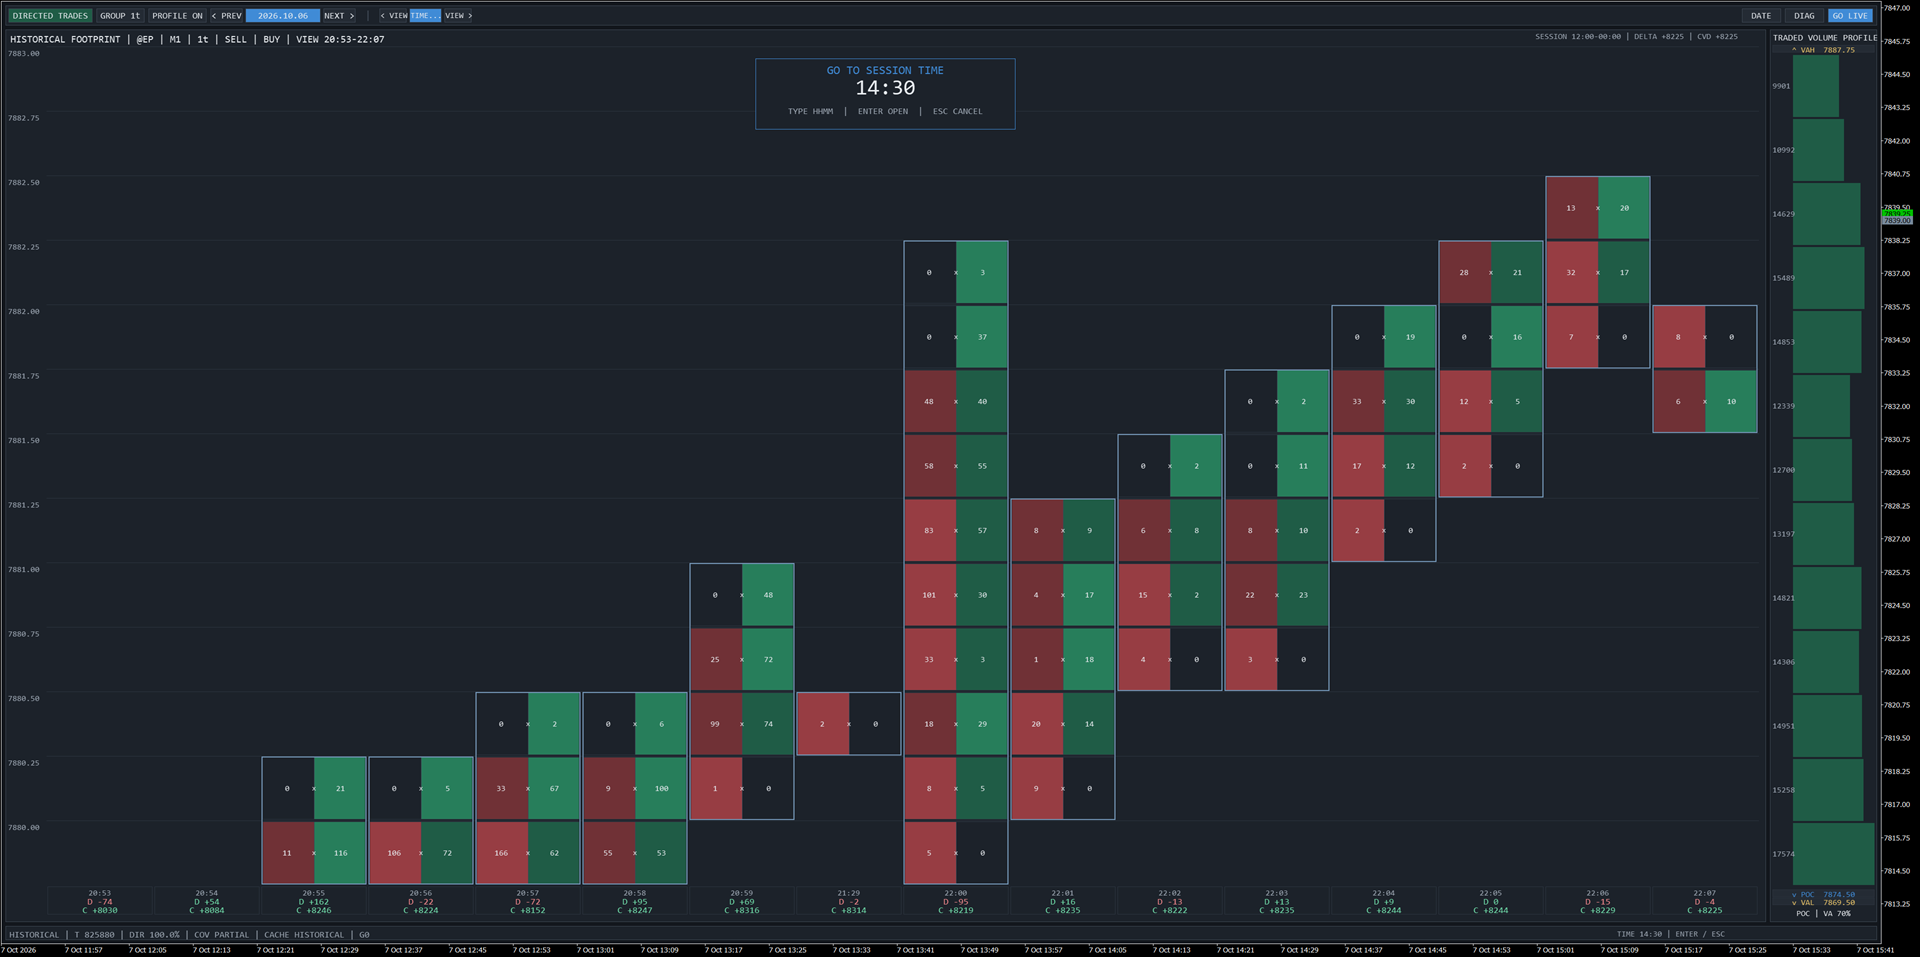
Direct intra-session navigation using TIME. Enter an HHMM value to jump to an available time in the selected session.
The expected format is:
HHMM
Example:
1430
If the requested time does not exist in the collected data, the overlay remains open and displays:
TIME NOT AVAILABLE
If the requested time is outside the configured session window:
TIME OUTSIDE SESSION
The selected historical time context is preserved as logically as possible when changing between supported MetaTrader timeframes.
10. LIVE-to-history navigation
The VIEW and TIME controls are also available directly from LIVE mode.
This allows you to inspect an earlier part of the current day without first pressing TODAY manually.
From LIVE:
• < VIEW creates/opens a current-session snapshot and moves backward;
• TIME can jump directly to an available time;
• VIEW > is disabled when you are already at the live edge.
The live collector continues operating in the background.
Use GO LIVE whenever you want to return to the current market state.
11. Diagnostics
Click DIAG to open the built-in read-only diagnostic page.
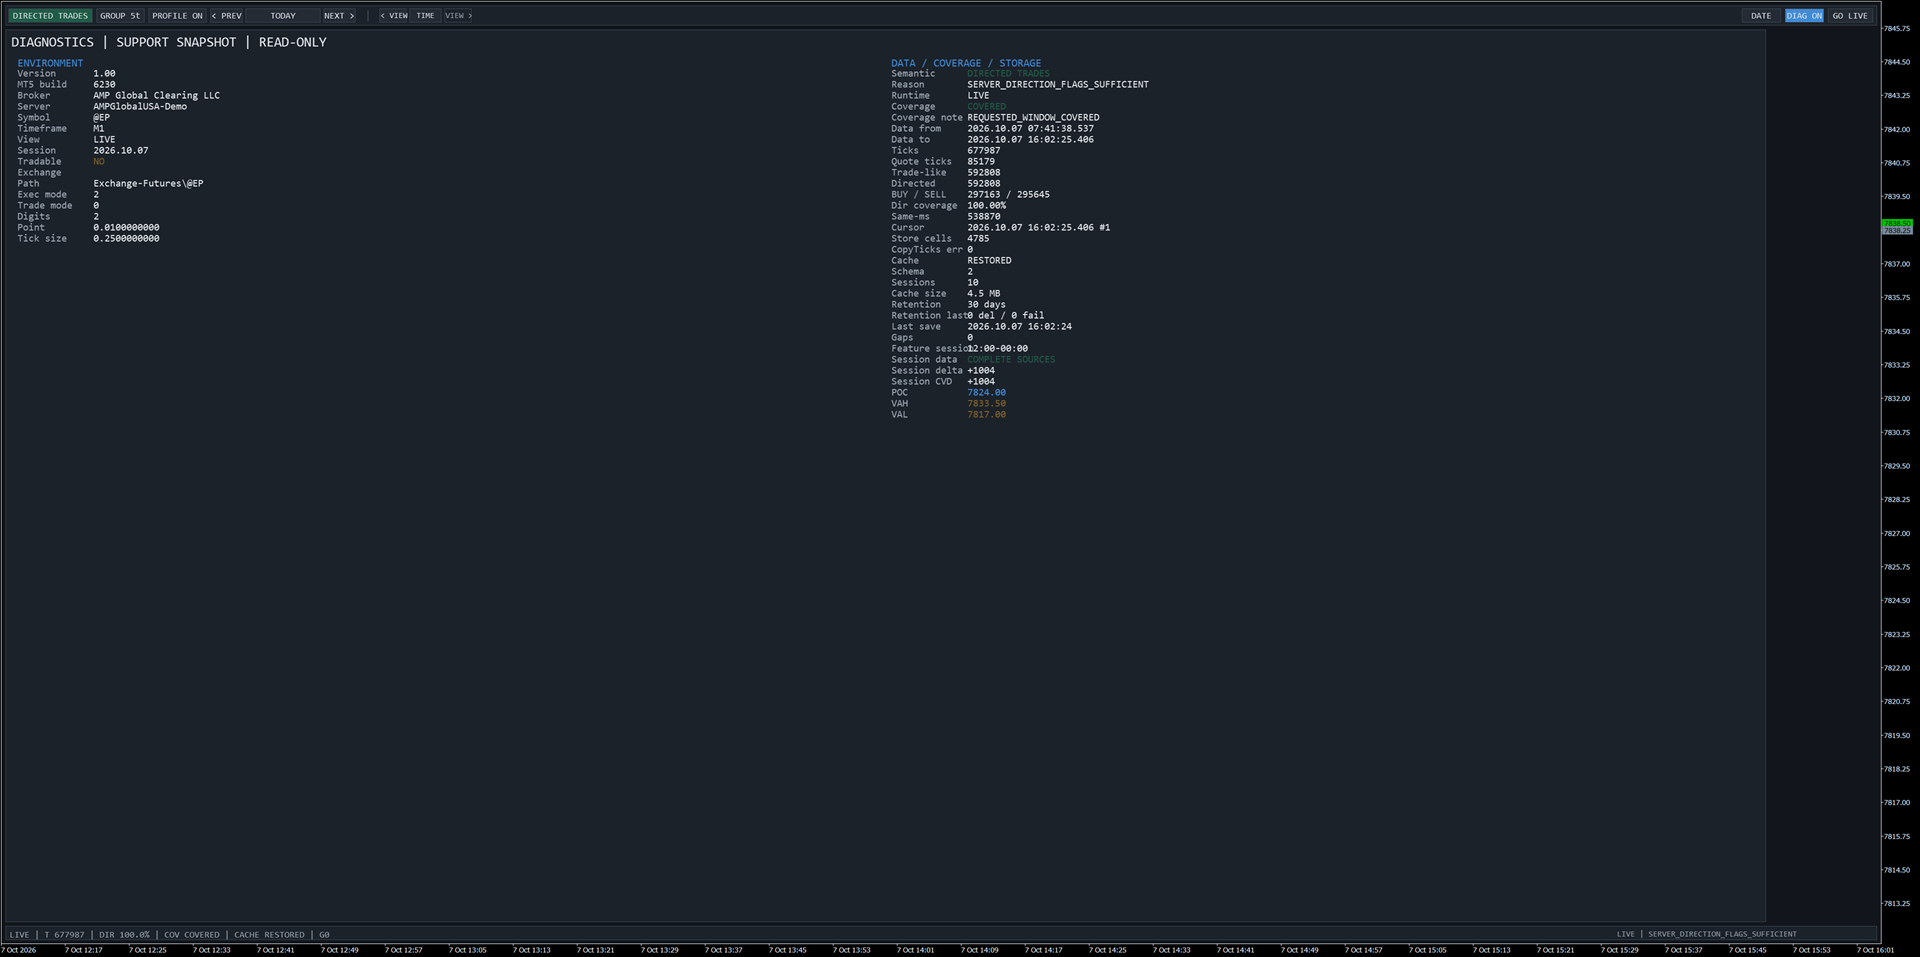
Built-in Diagnostics page showing feed classification, directional coverage, cache state, session information and runtime statistics.
DIAG can display information such as:
• product version;
• broker and server;
• symbol;
• timeframe;
• exchange / provenance information;
• semantic mode;
• classification reason;
• runtime state;
• data coverage;
• tick counts;
• quote / trade-like / directed statistics;
• BUY / SELL coverage;
• current cursor;
• stored cells;
• CopyTicks error state;
• cache status;
• cache schema;
• number of stored sessions;
• cache size;
• retention setting;
• last save;
• gaps;
• configured session;
• session data status;
• Delta and CVD where applicable;
• POC / VAH / VAL where applicable.
The Diagnostics page is particularly useful when requesting support, because one screenshot can provide most of the environment information needed to understand a problem.
12. Recommended screenshot for support
When reporting an issue, provide whenever possible:
1. a screenshot of the workspace showing the problem;
2. a screenshot of DIAG;
3. broker/server name;
4. symbol;
5. whether the issue occurred in LIVE or HISTORICAL mode.
For advanced troubleshooting, support capture files can also be enabled temporarily.
They are disabled by default.
13. Inputs and configuration
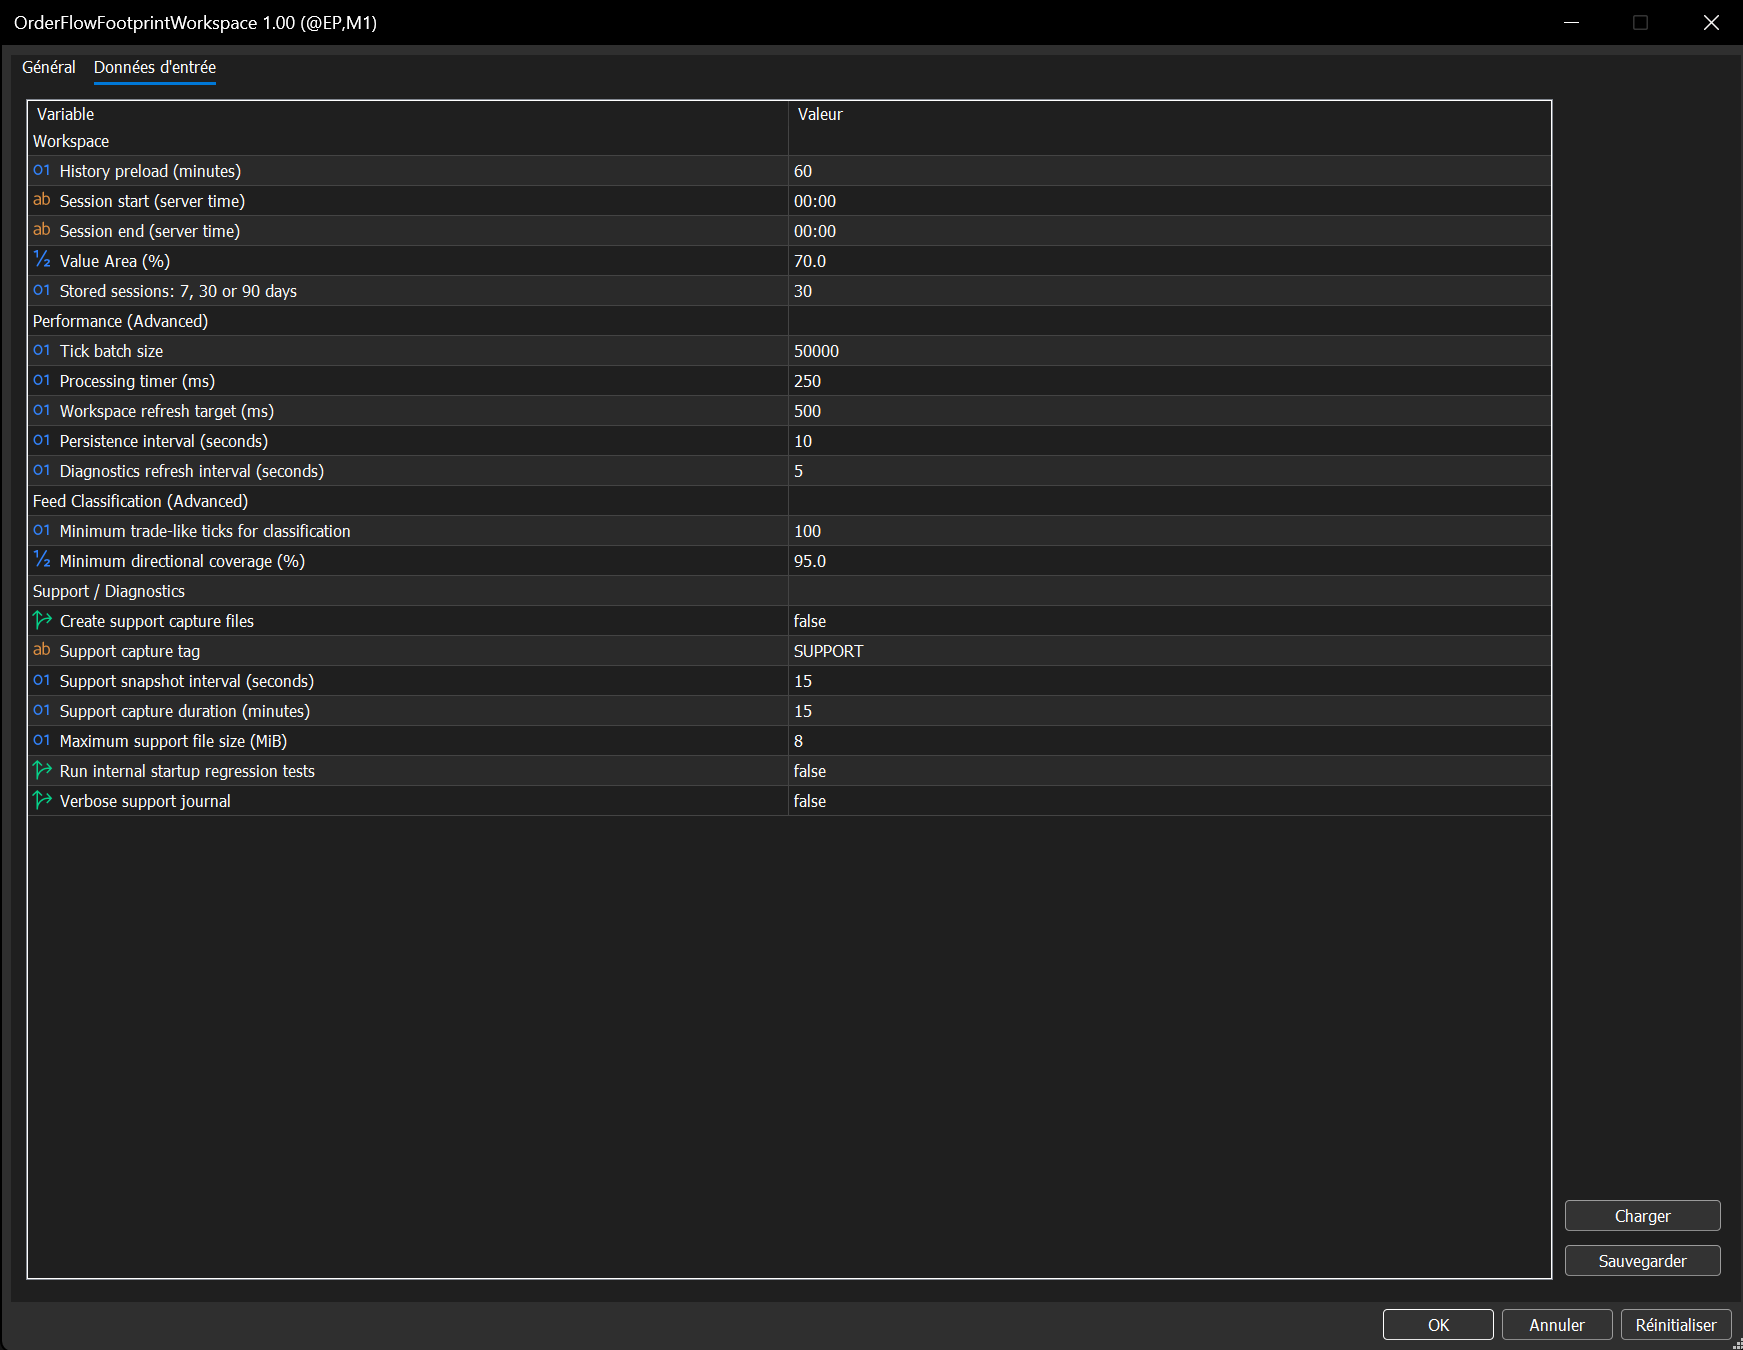
Order Flow Footprint Workspace inputs. Normal users can generally keep the advanced and support settings at their defaults.
Workspace
History preload (minutes)
Defines how much recent history is requested when the workspace starts.
This does not guarantee that the broker will provide every requested historical tick.
Session start / Session end
Defines the analytical session using broker-server time.
Example:
09:00 → 17:00
Overnight sessions are also supported:
22:00 → 02:00
The special configuration:
00:00 → 00:00
represents a complete broker day.
Value Area (%)
Sets the percentage used to calculate VAH and VAL when traded-volume semantics are available.
Default:
70.0
Stored sessions
Controls local retention.
Available values:
• 7 days
• 30 days
• 90 days
Default:
30 days
14. Performance settings
The Performance section is intended for advanced users.
The default values were selected and validated for normal use.
Tick batch size
Maximum number of ticks requested in a processing batch.
Processing timer
Internal processing cadence.
Workspace refresh target
Target refresh cadence for the visual workspace.
Persistence interval
Controls how frequently session state is saved.
Diagnostics refresh interval
Controls the refresh frequency of the DIAG page.
Unless troubleshooting a specific environment, keeping these settings at their defaults is recommended.
15. Feed Classification settings
These parameters control the conservative threshold used before the workspace accepts directional trade semantics.
Minimum trade-like ticks for classification
Minimum observation count required before directional capability can be accepted.
Minimum directional coverage
Minimum percentage of reliable directional observations required.
These are advanced settings.
Changing them does not create new data in the broker feed. Lowering the thresholds cannot turn an inherently quote-only feed into a genuine directed-trade feed.
16. Support / Diagnostics inputs
These settings are disabled or conservative by default.
Create support capture files
Enables the technical support capture system.
Leave this disabled during normal use unless support specifically requests a capture.
Support capture tag
Optional identifier attached to a support run.
Support snapshot interval
Controls how frequently technical snapshots are written during a capture.
Support capture duration
Maximum capture duration.
Maximum support file size
Limits the size of support files.
Run internal startup regression tests
Runs the internal technical regression suite at startup.
This is disabled by default and is primarily intended for validation and advanced support.
Normal users should leave it disabled.
Verbose support journal
Enables additional technical logging.
Also disabled by default.
17. Understanding SESSION PARTIAL
SESSION PARTIAL does not necessarily mean that the data currently visible on screen is wrong.
It means that the complete configured session cannot be considered fully covered.
Example:
Configured session:
00:00 → 00:00
Workspace started:
12:00
If the broker cannot provide the missing earlier portion, the workspace may have valid data from 12:00 onward but cannot honestly claim that the complete broker day is available.
It therefore reports:
SESSION PARTIAL
rather than silently pretending the missing period exists.
This is intentional.
18. Understanding data gaps and unavailable history
Historical data availability depends on:
• broker;
• server;
• symbol;
• asset class;
• how long MetaTrader exposes the required tick history;
• when the workspace started collecting;
• local retained sessions.
Order Flow Footprint Workspace does not interpolate or manufacture unavailable periods.
Possible user-visible states include unavailable dates, unavailable times and partial sessions.
This conservative behavior is part of the product design.
19. Persistence and restart recovery
Collected session information is stored locally inside the MetaTrader environment.
After restarting MetaTrader or reattaching the workspace, the product attempts to restore the local session state and continue from the available broker data.
Historical snapshots remain read-only.
The live pipeline remains authoritative for the current session.
Retention is bounded according to the selected 7 / 30 / 90-day option.
20. Timeframe behavior
The product stores its analytical session information independently from the chart’s visual timeframe and rebuilds supported views from the underlying session data.
Changing:
M1 → M5 → M15 → M30 → H1
changes the displayed temporal aggregation.
Session-wide statistics remain associated with the same underlying session.
When reviewing a historical time window, the workspace preserves the time context across timeframe changes rather than returning automatically to the latest data.
21. What the workspace does not do
Order Flow Footprint Workspace is not:
• an automated trading system;
• a BUY/SELL signal generator;
• a strategy backtester;
• a synthetic Delta generator;
• a DOM-history reconstruction tool;
• a guarantee of “institutional order flow” on feeds that do not provide the necessary source information.
Its purpose is to visualize, organize, preserve and explain the order-flow or quote-activity information that is actually available through MetaTrader 5 and the connected broker.
22. Recommended first-use workflow
For a new user, the simplest workflow is:
1. Attach Order Flow Footprint Workspace to an M1 chart.
2. Leave the default inputs unchanged.
3. Check the semantic badge:
• DIRECTED TRADES, or
• QUOTE ACTIVITY.
4. Leave PROFILE ON.
5. Try GROUP 1t, 2t, 5t and 10t.
6. Open DIAG once to understand what the broker feed provides.
7. Let the workspace collect data.
8. Use TODAY, PREV/NEXT, DATE, TIME and VIEW to explore stored sessions.
9. Use GO LIVE to return instantly to the current session.
23. Final notes
Order-flow information in MetaTrader 5 is only as rich as the data supplied by the broker and symbol.
A centralized/exchange-style feed with reliable direction flags can expose substantially richer information than an OTC FX/CFD feed containing mainly quote updates.
Order Flow Footprint Workspace is deliberately designed around that constraint.
When the data supports a richer interpretation, it uses it.
When the data does not, it displays a more conservative representation instead of inventing information.
That behavior is one of the central principles of the workspace.
Order Flow Footprint Workspace for MetaTrader 5
Read-only footprint visualization, session profiles, persistent historical navigation and transparent broker-feed diagnostics.




