
Available on the MQL5 Market: Supply Demand RSJ PRO
Risk notice. Trading involves risk of loss. This indicator marks price zones on the chart; it does not predict the market, does not place trades and does not guarantee any result. Use it together with your own analysis and risk management, and test on a demo account first.
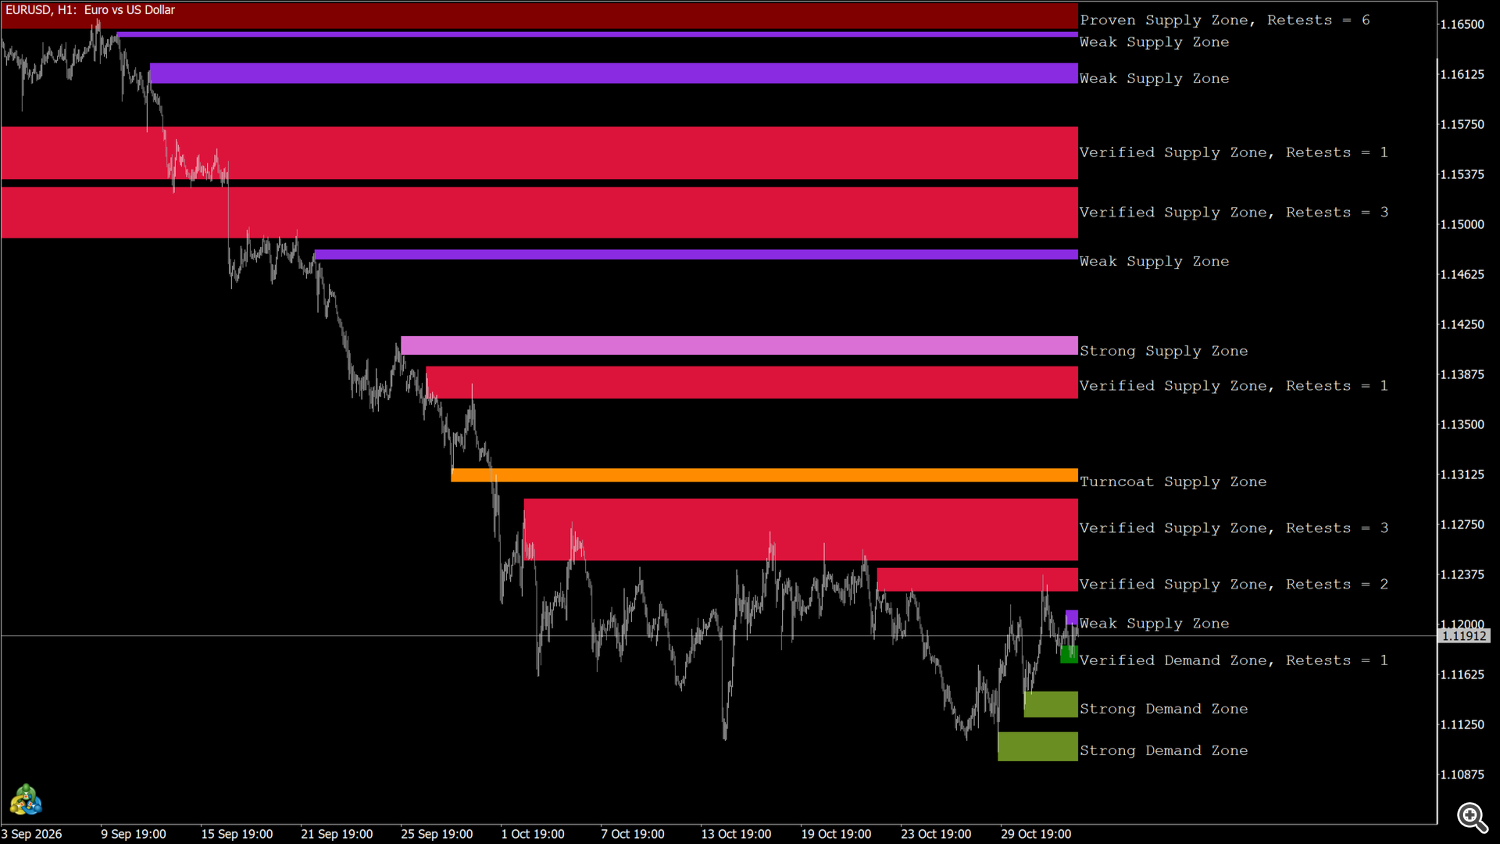
Supply Demand RSJ PRO draws supply and demand zones built from swing highs and swing lows, grades each zone in five levels (weak, strong, verified, proven, turncoat), counts how many times price has retested it, flips zones that were broken once and removes zones that were broken twice. Overlapping zones can be merged, every zone can carry a text label, and an alert can fire when price enters a zone. It works on any symbol, any broker and any timeframe. It does not open trades.
1. Installation and quick start
- Buy or rent the indicator on the MQL5 Market and install it from the Market tab of the terminal (Toolbox → Market → Purchased → Install).
- Open a chart and drag Supply Demand RSJ PRO from the Navigator (Indicators → Market) onto it.
- Keep the default inputs or adjust them (section 11) and press OK.
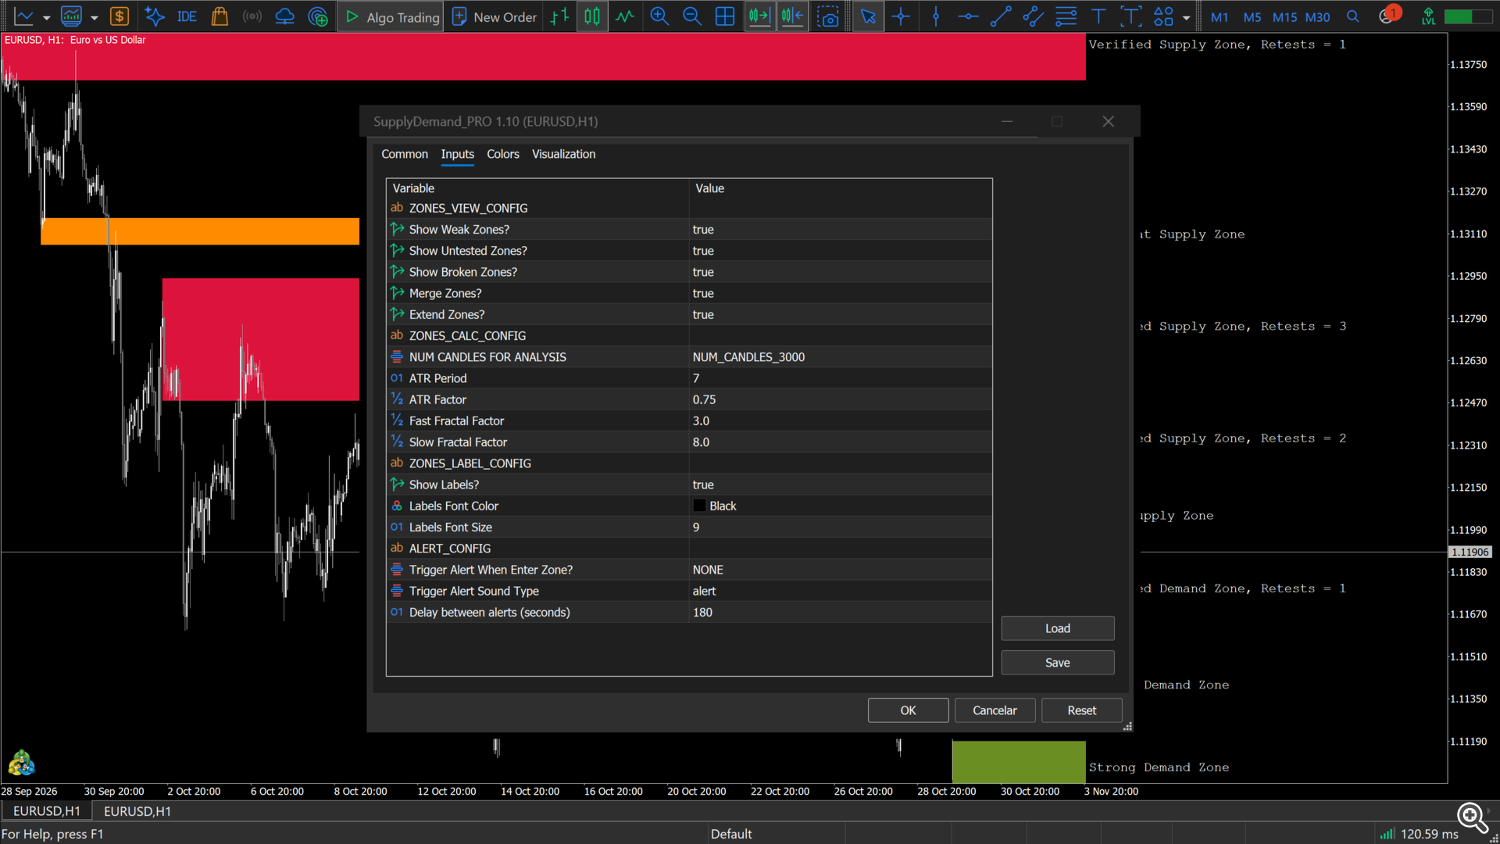
The indicator analyses the last 3000 bars (input NUM CANDLES FOR ANALYSIS) and rebuilds all zones at the first tick of every new bar; if the history is not ready yet, it tries again on the following ticks. With Show Labels? on (default), the chart shift is switched on so that the labels have room to the right of the last bar; if it was off before, it is switched off again when the indicator is removed (unless another copy is still on the chart).
Quick start
- Read the grade on the label: Proven and Verified zones have already held retests, Strong zones come from a major swing that was never retested, Weak zones come from a minor swing, Turncoat zones were broken once and changed side.
- The default label colour is black. On a dark chart, change Labels Font Color (for example to white or silver).
- For a cleaner chart, turn off Show Weak Zones? first.
- To be warned when price enters a zone, set Trigger Alert When Enter Zone? (section 10).
2. Chart legend
| On the chart | Meaning |
|---|---|
| Filled box above the price (crimson / maroon / orchid / blue-violet) | Supply zone. Colour by grade: Verified crimson, Proven maroon, Strong orchid, Weak blue-violet. |
| Filled box below the price (green / royal blue / olive / cornflower blue) | Demand zone. Colour by grade: Verified green, Proven royal blue, Strong olive drab, Weak cornflower blue. |
| Dark orange filled box | Turncoat ("broken") zone: broken once, now acting on the other side (former supply as demand, or the reverse). |
| Text such as Verified Demand Zone, Retests = 2 | Label of the zone (optional), drawn to the right of the last bar, in the upper third of the zone. |
Each box starts at the bar of the swing that created it and ends at the current bar. Hover the mouse over a box to read its tooltip, for example SDRSJ#123456#S4 Type = Verified, Test Count = 2 (S = demand, R = supply). All objects of the indicator start with SDRSJ# followed by a number that is different for each copy of the indicator, and are drawn in the background, behind the candles.
3. How zones appear
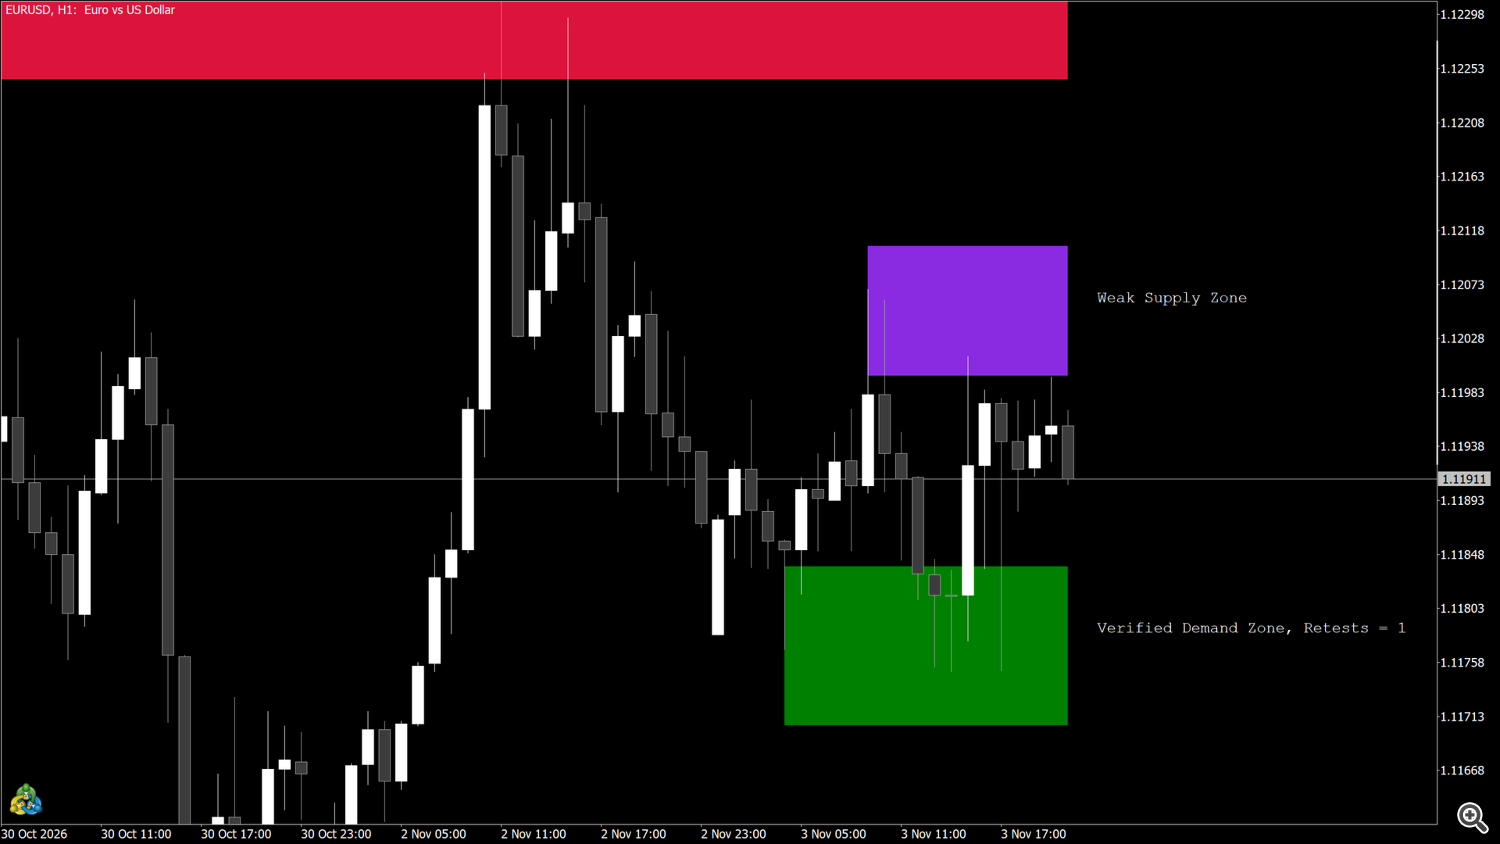
- Zones are drawn around market turning points (swing highs and swing lows) found in the last NUM CANDLES FOR ANALYSIS bars.
- A turning point is confirmed only after some bars have closed on its right, so a new zone appears a few bars after the turn, never on the forming bar.
- With Extend Zones? on, the zone covers a little more than the wick of the turning bar.
- ATR Factor makes zones wider or narrower; the fractal factors set how large a turn must be to create a zone (section 11).
4. Zone grades
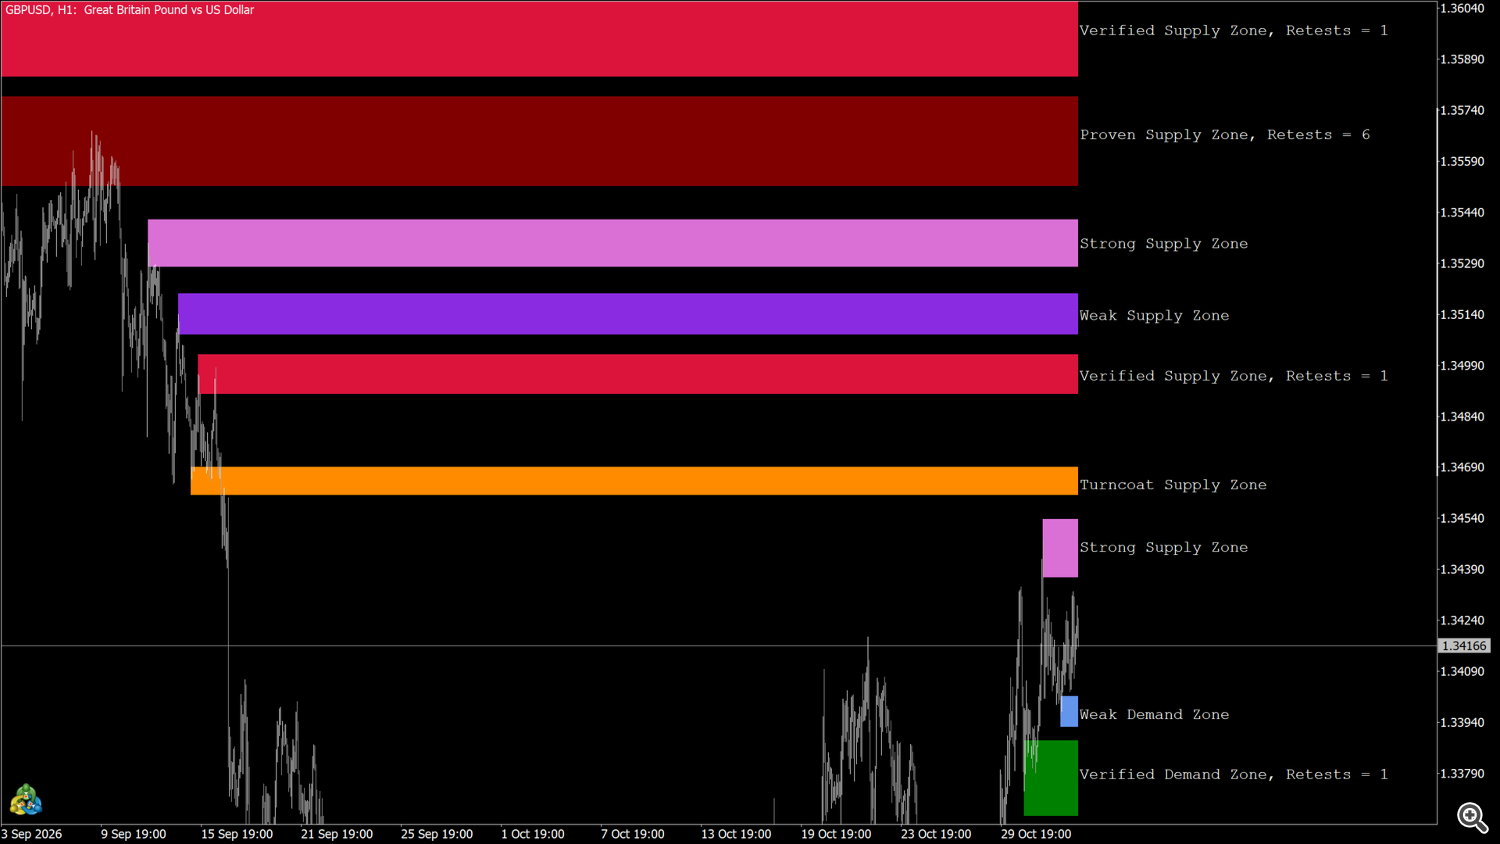
| Grade (label) | Meaning | Default colour (supply / demand) | Filter input |
|---|---|---|---|
| Weak | Zone from a minor turn, never retested. | Blue-violet / Cornflower blue | Show Weak Zones? |
| Strong | Zone from a major turn, never retested and never broken — an untested zone. | Orchid / Olive drab | Show Untested Zones? |
| Verified | 1 to 3 retests. | Crimson / Green | always shown |
| Proven | 4 or more retests. | Maroon / Royal blue | always shown |
| Turncoat | Broken once and changed side, no retest since the break. | Dark orange / Dark orange | Show Broken Zones? |
A zone that flipped and was then retested is graded Verified or Proven again. A recent zone can first appear as Weak and become Strong later, when its turn is confirmed as a major one. Grades are updated on every new bar.
5. Retests, breaks and turncoat zones
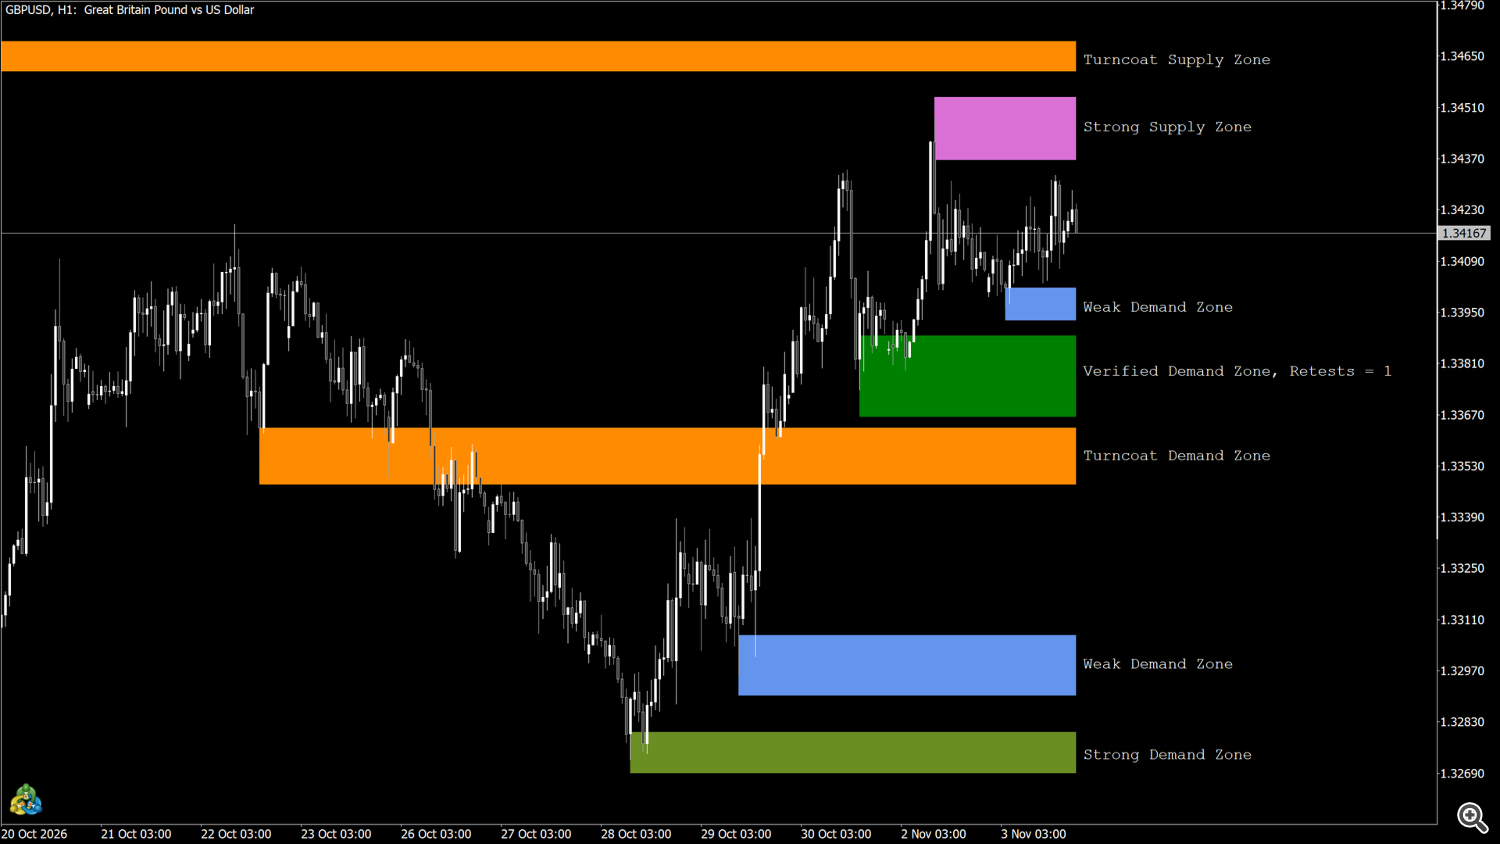
Retest. A retest is counted when price later turns again inside the zone, on the side the zone acts on.
Break. A supply zone is broken when a later bar trades above its top (high above the top); a demand zone when a bar trades below its bottom. Wicks count.
- A weak zone is removed at its first break.
- A strong, verified or proven zone that is broken once flips: it becomes a turncoat zone on the other side (a broken supply zone is now read as demand, and the reverse) and its retest count starts again at 0.
- A second break without a retest in between removes the zone. A retest after the flip resets this, so a well-respected level can flip more than once.
Turncoat zones are drawn in dark orange (labelled Turncoat) until they are retested on their new side.
6. Supply or demand?
Whether a zone is drawn as supply or demand depends on where price is now relative to the zone, not on the turn that created it: a zone below price is read as demand, a zone above price as supply. When price moves through a zone, its side can therefore change some bars later.
7. Merging overlapping zones
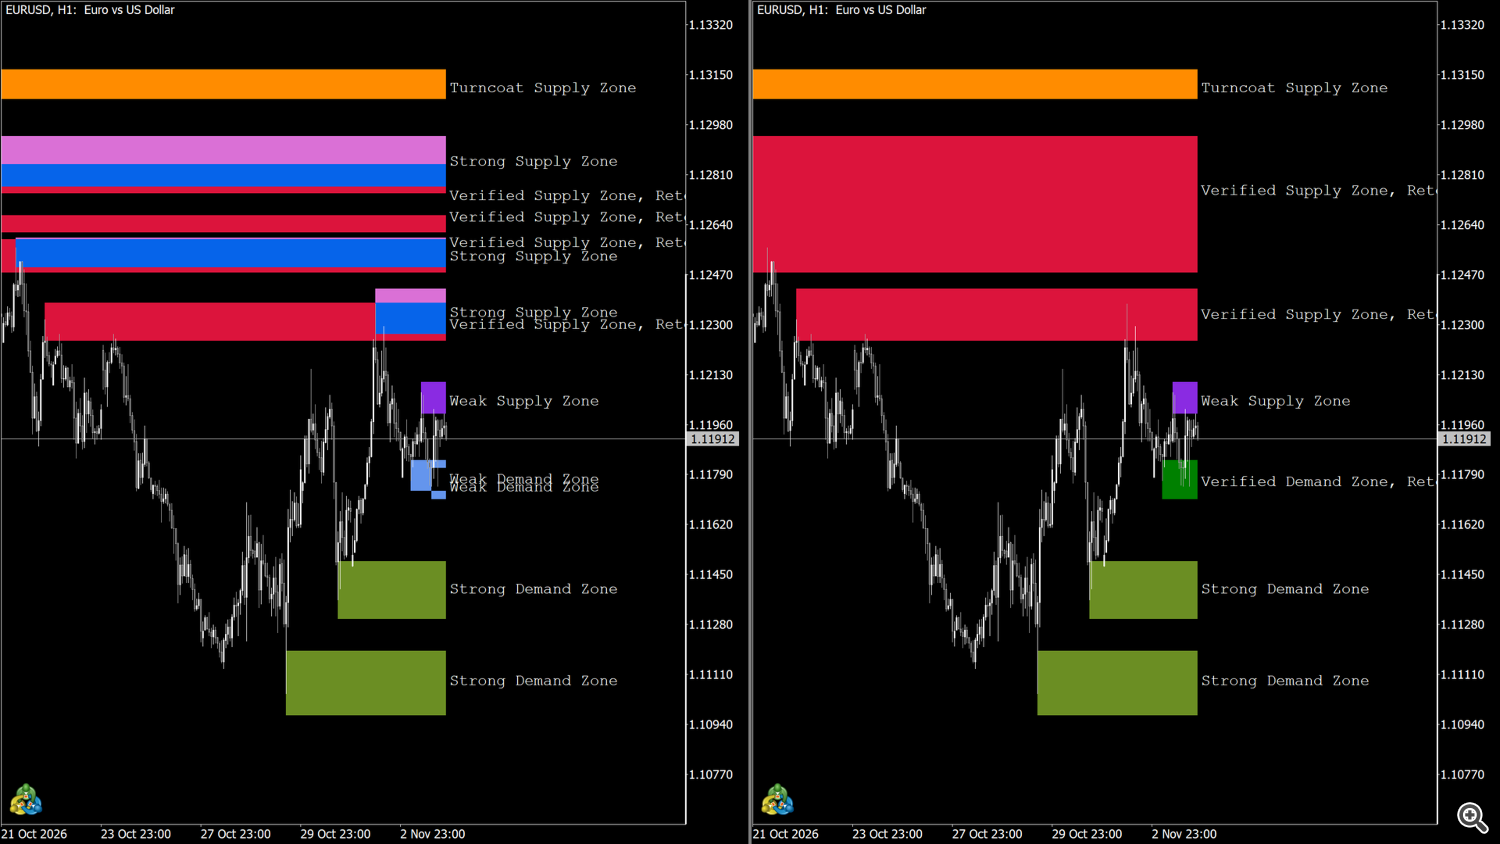
With Merge Zones? on (default), zones that overlap are joined into one wider zone; the retest counts are combined and the label shows the resulting grade.
Turn it off to see every swing zone separately.
8. Labels
With Show Labels? on, each visible zone gets a text label: grade + side, plus the retest count for verified and proven zones, for example:
- Weak Supply Zone
- Strong Demand Zone
- Verified Supply Zone, Retests = 2
- Proven Demand Zone, Retests = 5
- Turncoat Demand Zone
The labels use Courier New, Labels Font Size (default 9) and Labels Font Color (default black). They are placed about two bars to the right of the current bar; the indicator switches on the chart shift for that.
9. Colours
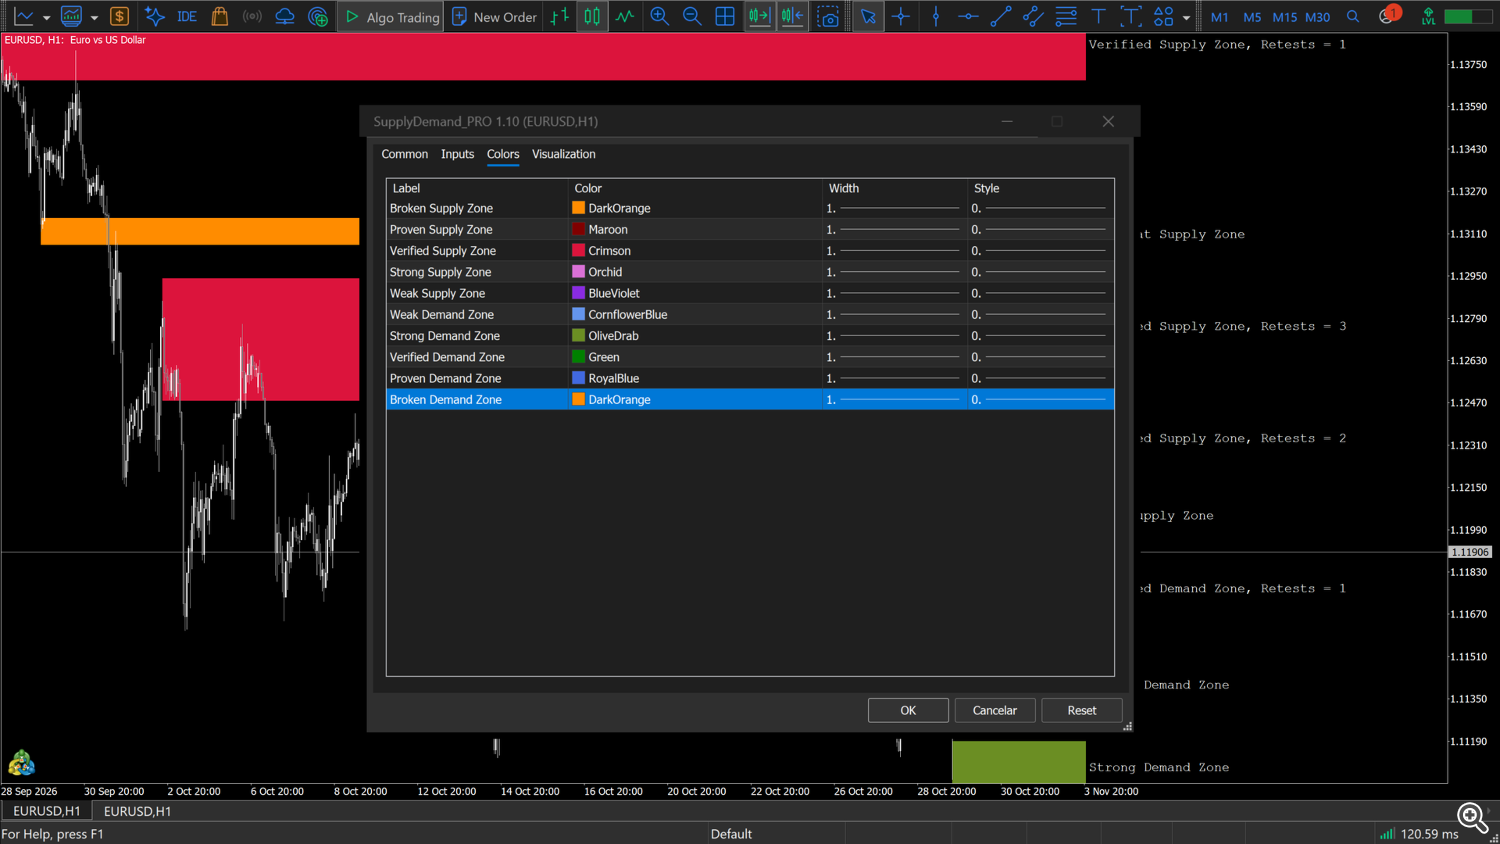
The zone colours are set on the Colors tab of the indicator properties (not on the Inputs tab). Each entry is one grade and side:
| Colors tab entry | Used for | Default |
|---|---|---|
| Broken Supply Zone | Turncoat zone shown as supply | Dark orange |
| Proven Supply Zone | Proven supply | Maroon |
| Verified Supply Zone | Verified supply | Crimson |
| Strong Supply Zone | Strong (untested) supply | Orchid |
| Weak Supply Zone | Weak supply | Blue-violet |
| Weak Demand Zone | Weak demand | Cornflower blue |
| Strong Demand Zone | Strong (untested) demand | Olive drab |
| Verified Demand Zone | Verified demand | Green |
| Proven Demand Zone | Proven demand | Royal blue |
| Broken Demand Zone | Turncoat zone shown as demand | Dark orange |
Only the colour is used; style and width have no effect. The boxes are filled and drawn in the background.
10. Alerts
| Input | Fires when | Message |
|---|---|---|
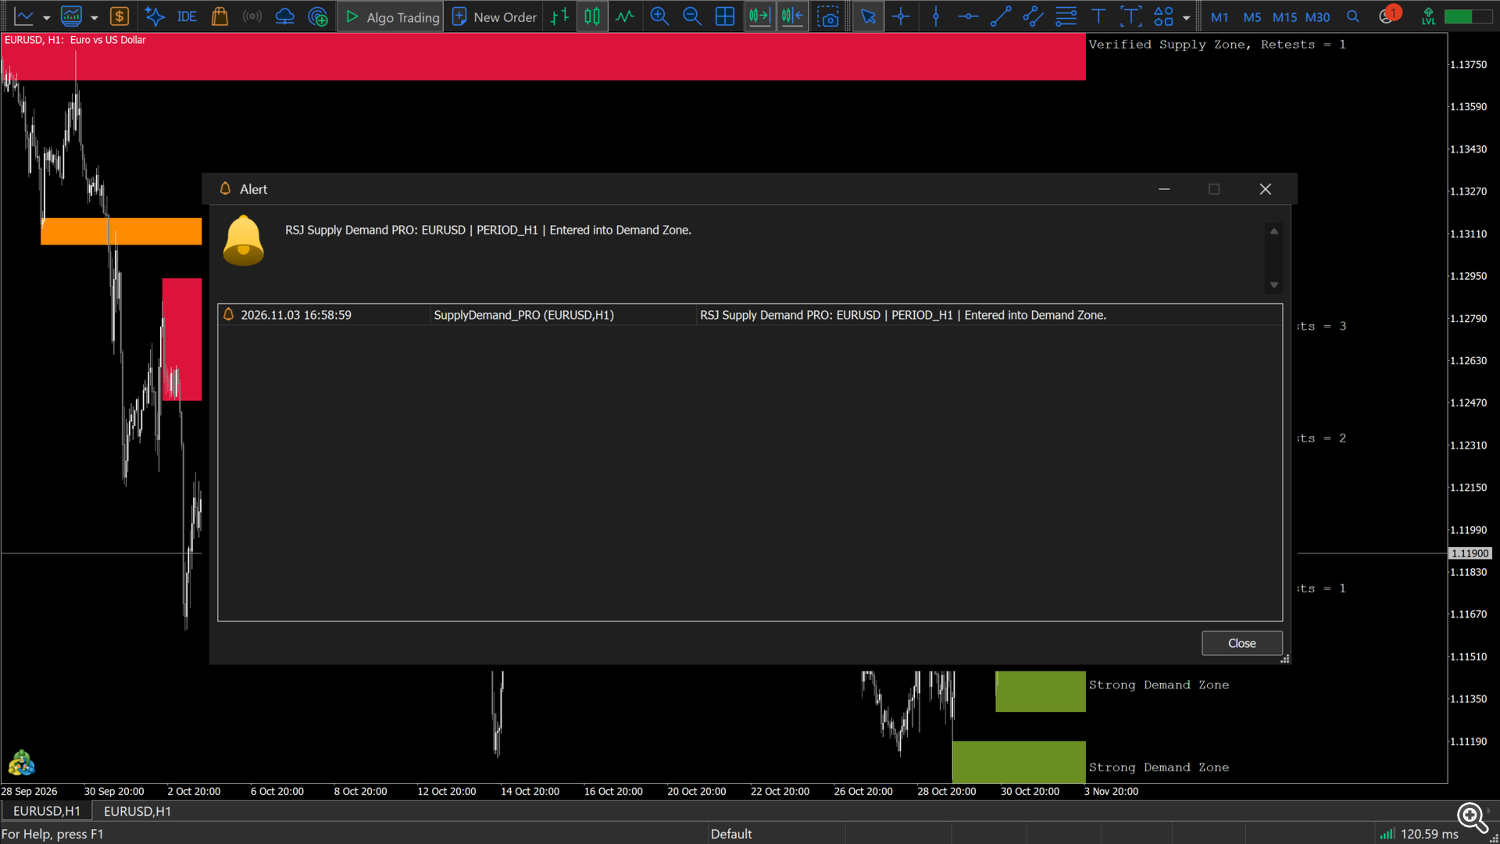
| Trigger Alert When Enter Zone? | the current Bid enters a visible zone (bottom ≤ price < top) | Entered into Demand Zone. or Entered into Supply Zone. |
Modes: NONE (default, no alert), POPUP, SOUND, NOTIFICATION (smartphone push), POPUP_SOUND, NOTIFICATION_SOUND, POPUP_NOTIFICATION, POP_SOUND_NOTIFICATION. Trigger Alert Sound Type selects one of 13 terminal sounds (default alert).
The text includes the product, symbol and timeframe, e.g. RSJ Supply Demand PRO: EURUSD | PERIOD_H1 | Entered into Demand Zone.
How often it fires:
- The check runs on every tick. The alert fires once, when price enters a zone; it is not repeated while price stays inside. After price leaves the zone, a new entry can fire again.
- After an alert, entries are ignored until Delay between alerts (seconds) (default 180) have passed on the clock since that alert. An entry that happens during the delay is skipped, not sent later.
- One alert covers one zone (the first zone found that price has just entered).
- Only visible zones are checked: grades hidden by the Show ... Zones? filters do not trigger alerts.
- No alert is sent when the indicator is attached with price already inside a zone, nor when a zone appears around the price at a recalculation (for example a new swing or a merge).
Push notifications need the MetaQuotes ID in Tools → Options → Notifications. The sound modes play the sound without pausing the indicator. The Strategy Tester shows no pop-ups, sounds or notifications.
11. Inputs
The headings below are the separator lines of the Inputs tab (they have no value to set).
ZONES_VIEW_CONFIG
| Input | Default | Description |
|---|---|---|
| Show Weak Zones? | true | Shows Weak zones. |
| Show Untested Zones? | true | Shows Strong (untested) zones. |
| Show Broken Zones? | true | Shows Turncoat zones. |
| Merge Zones? | true | Joins overlapping zones (section 7). |
| Extend Zones? | true | The zone covers a little more than the wick of the turning bar (section 3). |
Verified and Proven zones are always shown.
ZONES_CALC_CONFIG
| Input | Default | Description |
|---|---|---|
| NUM CANDLES FOR ANALYSIS | NUM_CANDLES_3000 | Bars searched for zones: NUM_CANDLES_500 to NUM_CANDLES_5000, in steps of 500. |
| ATR Period | 7 | Adapts the zone size to the recent volatility of the symbol. |
| ATR Factor | 0.75 | Larger values give wider zones and more merging. |
| Fast Fractal Factor | 3.0 | Size of the minor turns that create zones: larger values keep only larger turns. |
| Slow Fractal Factor | 8.0 | Size of the major turns (Strong grade): larger values keep only larger turns. |
The fractal factors are used as whole numbers (3.5 works as 3; values below 1 work as 1).
ZONES_LABEL_CONFIG
| Input | Default | Description |
|---|---|---|
| Show Labels? | true | Draws the text labels and turns on the chart shift. |
| Labels Font Color | Black | Colour of the labels. |
| Labels Font Size | 9 | Font size of the labels. |
ALERT_CONFIG
| Input | Default | Description |
|---|---|---|
| Trigger Alert When Enter Zone? | NONE | Alert mode (section 10). |
| Trigger Alert Sound Type | alert | alert, alert2, connect, disconnect, email, expert, news, ok, request, stops, tick, timeout, wait. |
| Delay between alerts (seconds) | 180 | Minimum gap between two alerts, in seconds measured by the clock. |
12. Buffers for Expert Advisors / dashboards
The indicator exposes 8 buffers that can be read with iCustom + CopyBuffer . They are hidden from the Data Window. Buffers 0-3 are written when the zones are rebuilt at a new bar; buffers 4-7 are updated on every tick.
| Buffer | Content | Values | Empty |
|---|---|---|---|
| 0 | Slow swing low | low price on the bar of a confirmed slow (major) swing low | 0 |
| 1 | Slow swing high | high price on the bar of a confirmed slow swing high | 0 |
| 2 | Fast swing low | low price on the bar of a confirmed fast (minor) swing low | 0 |
| 3 | Fast swing high | high price on the bar of a confirmed fast swing high | 0 |
| 4 | Nearest zone above - top | top of the nearest visible zone entirely above the Bid (the one with the lowest bottom) | 0 |
| 5 | Nearest zone above - bottom | bottom of the same zone as buffer 4 | 0 |
| 6 | Nearest zone below - top | top of the nearest visible zone entirely below the Bid (the one with the highest top) | 0 |
| 7 | Nearest zone below - bottom | bottom of the same zone as buffer 6 | 0 |
Notes on buffers 4-7:
- They are written on bar 0 on every tick, with the current Bid. Shift 1 keeps the last value of the previous bar; older bars are 0 .
- "Above" and "below" are measured against the zone edges, not the zone side: the zone above the price is usually supply, but it can be a demand zone that price has just left downwards (section 6). Only zones entirely above or entirely below the price are considered: a zone that contains the price is not reported, and the buffers show the next zone beyond it.
- Only visible zones are considered (the Show ... Zones? filters apply).
- 0 means "no such zone", in all four buffers.
Swing buffers 0-3 are 0 on the last bars: a turn is known only once it is confirmed.
Loading. The Market version is installed in MQL5\Indicators\Market\ ; check the exact file name in the Navigator. With no parameters after the name the default inputs are used. To change inputs, pass them in the order of section 11. Each separator line (ZONES_VIEW_CONFIG, ZONES_CALC_CONFIG, ZONES_LABEL_CONFIG, ALERT_CONFIG) is a parameter too: pass an empty string "" in its place, otherwise every following value shifts. NUM CANDLES FOR ANALYSIS is passed as a number: 0 = 500, 1 = 1000 … 5 = 3000 … 9 = 5000. Inputs left out at the end keep their defaults.
```mql5 // "" = ZONES_VIEW_CONFIG, then show weak = false int h = iCustom(_Symbol, PERIOD_H1, "Market\Supply Demand RSJ PRO", "", false);
double up_top[1], up_bot[1], dn_top[1], dn_bot[1]; if (BarsCalculated(h) > 0) { if (CopyBuffer(h, 4, 0, 1, up_top) == 1 && CopyBuffer(h, 5, 0, 1, up_bot) == 1 && up_top[0] != 0.0) Print("nearest zone above ", up_bot[0], " - ", up_top[0]); if (CopyBuffer(h, 6, 0, 1, dn_top) == 1 && CopyBuffer(h, 7, 0, 1, dn_bot) == 1 && dn_top[0] != 0.0) Print("nearest zone below ", dn_bot[0], " - ", dn_top[0]); } ```
Notes: an indicator created by iCustom draws its zones and labels on the chart of the calling program, with its own object names, so it does not erase the zones of a copy attached by hand; the zones cannot be turned off, only the labels (Show Labels? = false). Wait until BarsCalculated(h) > 0 before the first read (history may still be loading). The grade, the side and the retest count of a zone are not available in buffers — only on the chart (labels and tooltips).
13. Free vs PRO
The free Supply Demand RSJ Zones draws the same kind of zones with fixed settings.
| Supply Demand RSJ Zones (free) | Supply Demand RSJ PRO | |
|---|---|---|
| Grades | 2: strong (full colour) and weak (faded) | 5: weak, strong, verified, proven, turncoat |
| Labels with grade and retest count | — | yes |
| Filter per grade | — | weak / untested / turncoat |
| Merge and extend switches | always on | on / off |
| Bars analysed | 300-1500 (default 1000) | 500-5000 (default 3000) |
| ATR and fractal settings | fixed | adjustable |
| Colours | supply and demand colour, weak tone automatic | 10 colours (grade × side) |
| Alerts | — | pop-up, sound, push |
| Buffers | 8 (same layout); nearest supply above / demand below, 0 when none | 8; nearest zone entirely above / below, 0 when none (section 12) |
14. Tips
- Less clutter: turn off Show Weak Zones?; then Show Untested Zones? to keep only zones that already held a retest (plus turncoats).
- Wider or narrower zones: raise or lower ATR Factor. Wider zones also merge more often.
- Major levels only: raise Fast Fractal Factor so that only larger swings create zones.
- Higher timeframe context: open the indicator on H4 or D1 next to your trading chart; zones of a higher timeframe are not drawn on a lower one.
- Dark chart: set Labels Font Color to a light colour.
- Speed: 5000 bars on many charts can make the terminal slower at each new bar; 1000-3000 bars are usually enough.
- Several copies on one chart: each copy uses its own object names, so two or more copies with different settings can run on the same chart without erasing each other's zones. Enable the alert on one copy only to avoid duplicates.
15. Questions and troubleshooting
- Does it repaint? Swings are confirmed on closed bars and are never moved. Zones, however, are rebuilt from the history at every new bar: a zone appears only once its turn is confirmed, its grade can change (Weak → Strong when the slow swing is confirmed, more retests, a flip) and it is removed when it is broken twice. The forming bar is not used for the zones until the next bar opens; the alert and buffers 4-7 follow the live Bid.
- I see no labels. Check Show Labels? and Labels Font Color: black labels are invisible on a black chart.
- A zone changed from supply to demand. Price closed through it and it became a turncoat zone, or price moved to the other side of the zone (section 6).
- A zone disappeared. It was broken a second time without a retest, or a weak zone was broken once, or it is older than NUM CANDLES FOR ANALYSIS, or its grade is filtered out.
- Why is a strong zone missing near the last bars? A major turn needs more closed bars to be confirmed; until then the zone is Weak — hidden if Show Weak Zones? is off.
- How often do alerts come? Once per entry into a zone, not while price stays inside, and never closer together than Delay between alerts (seconds) (section 10). Raise the delay for fewer alerts on short timeframes.
- Price is inside a zone but there was no alert. Price was already inside when the indicator was attached, the zone appeared around the price at a recalculation, the entry came during the delay after the previous alert, or the zone is hidden by a Show ... Zones? filter (hidden zones do not alert).
- Strategy Tester. Works in visual and non-visual mode; pop-ups, sounds and notifications are not sent in the tester.
Support: send a private message on MQL5 to the author.




