Gold took the Asian high, then fell: one session through LiquidityLens

Many price action traders start the day the same way. They mark the previous day high and low, then the Asian session high and low, and wait to see which one London or New York takes out. LiquidityLens by Plug 101 is an MT5 indicator I built to do that marking for me and to show, candle by candle, when one of those levels gets swept.
Here is one real session, so you can see exactly what it draws and what it doesn't.
XAUUSD M15, Monday 23 March 2026 (server time)
- During the Asian session, from 01:00 to 08:00, gold built a range. Its high was 4510.94. LiquidityLens drew that high as a dotted level once the session closed.
- At 16:15, in the New York session, a candle traded up to 4512.81, above the Asian high, and closed back below it at 4486.32. That is a sweep: price took the liquidity above the level and did not hold. The level line stops on that candle, and a small sweep marker is drawn.
- The next candle, at 16:30, closed at 4479.48 with a long upper wick. That is a bearish rejection pin bar. Because it formed right after a sweep inside a session, LiquidityLens placed an arrow on it once it closed. It also drew reference lines: a stop at 4518.11 (beyond the sweep high plus a small ATR buffer) and a target at 4402.22 (two times that risk).
- Price reached the 4402.22 reference level on the 17:45 candle.
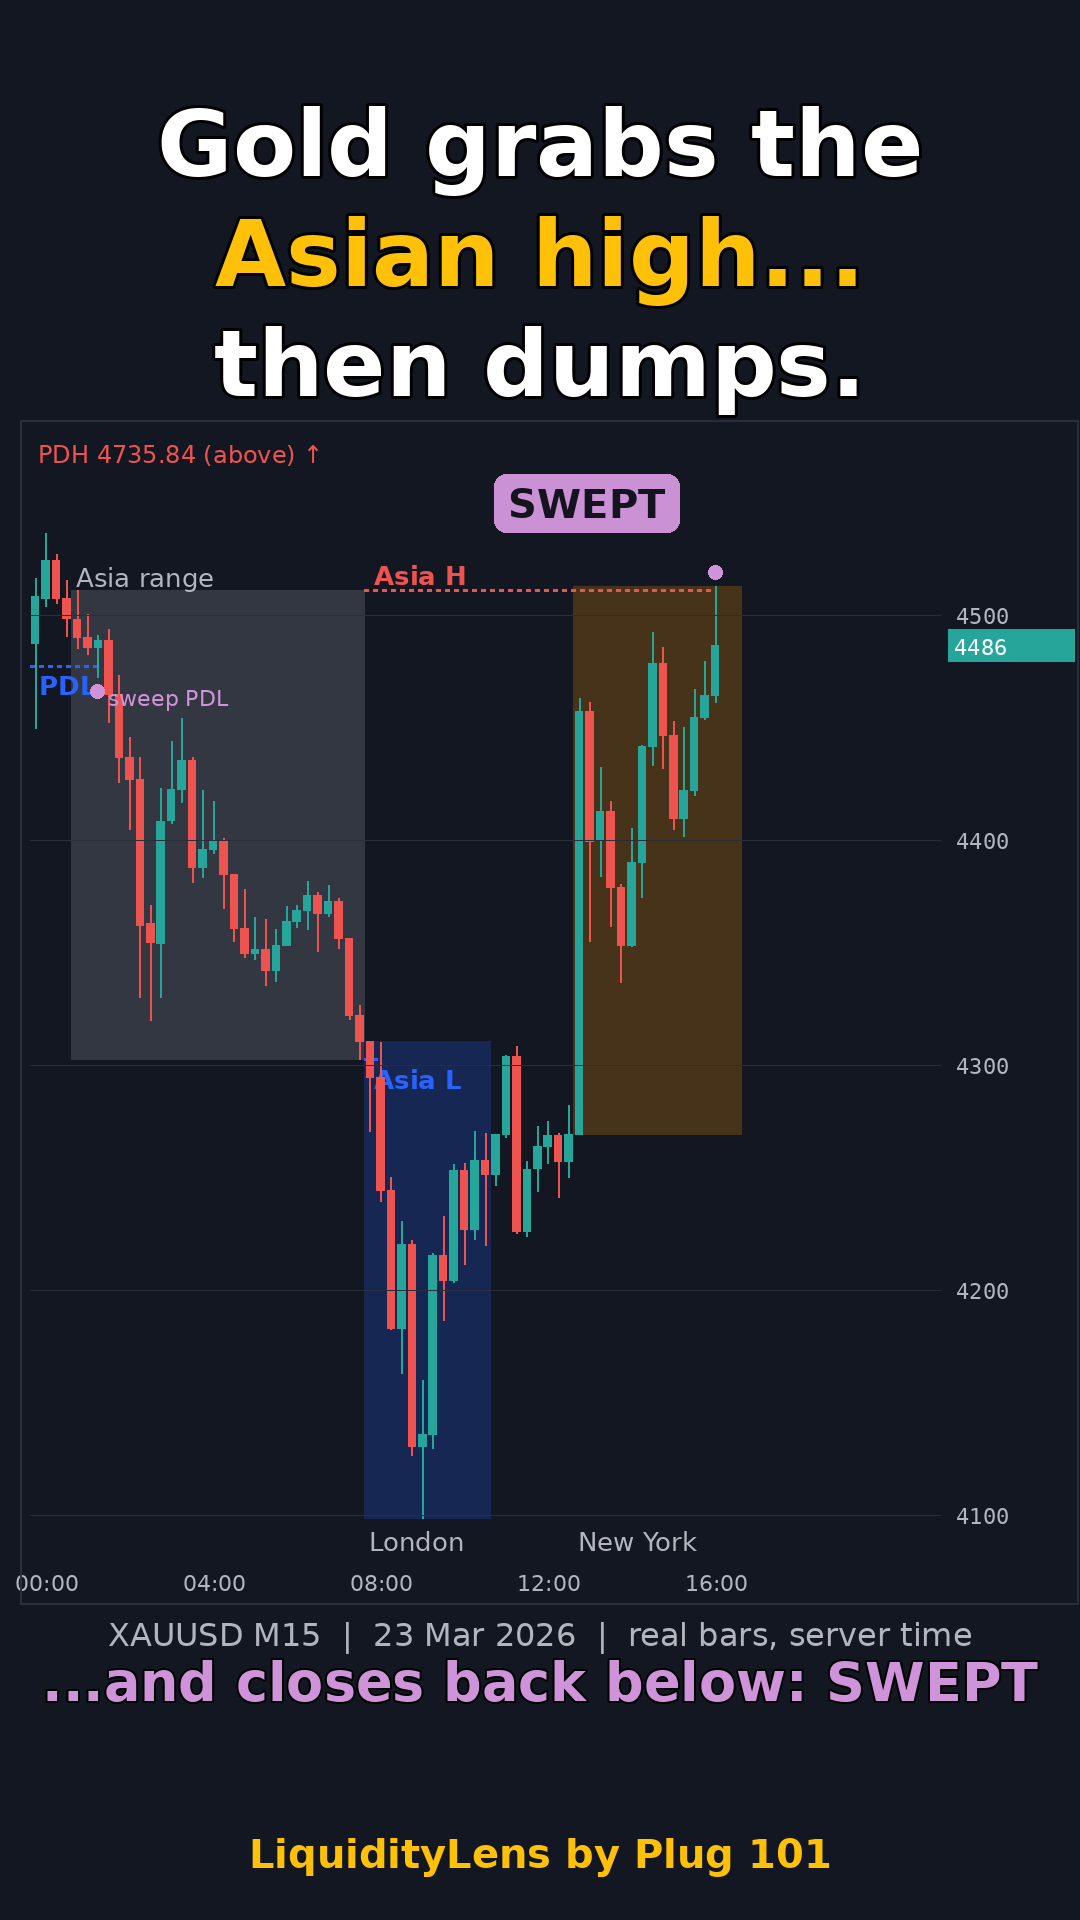
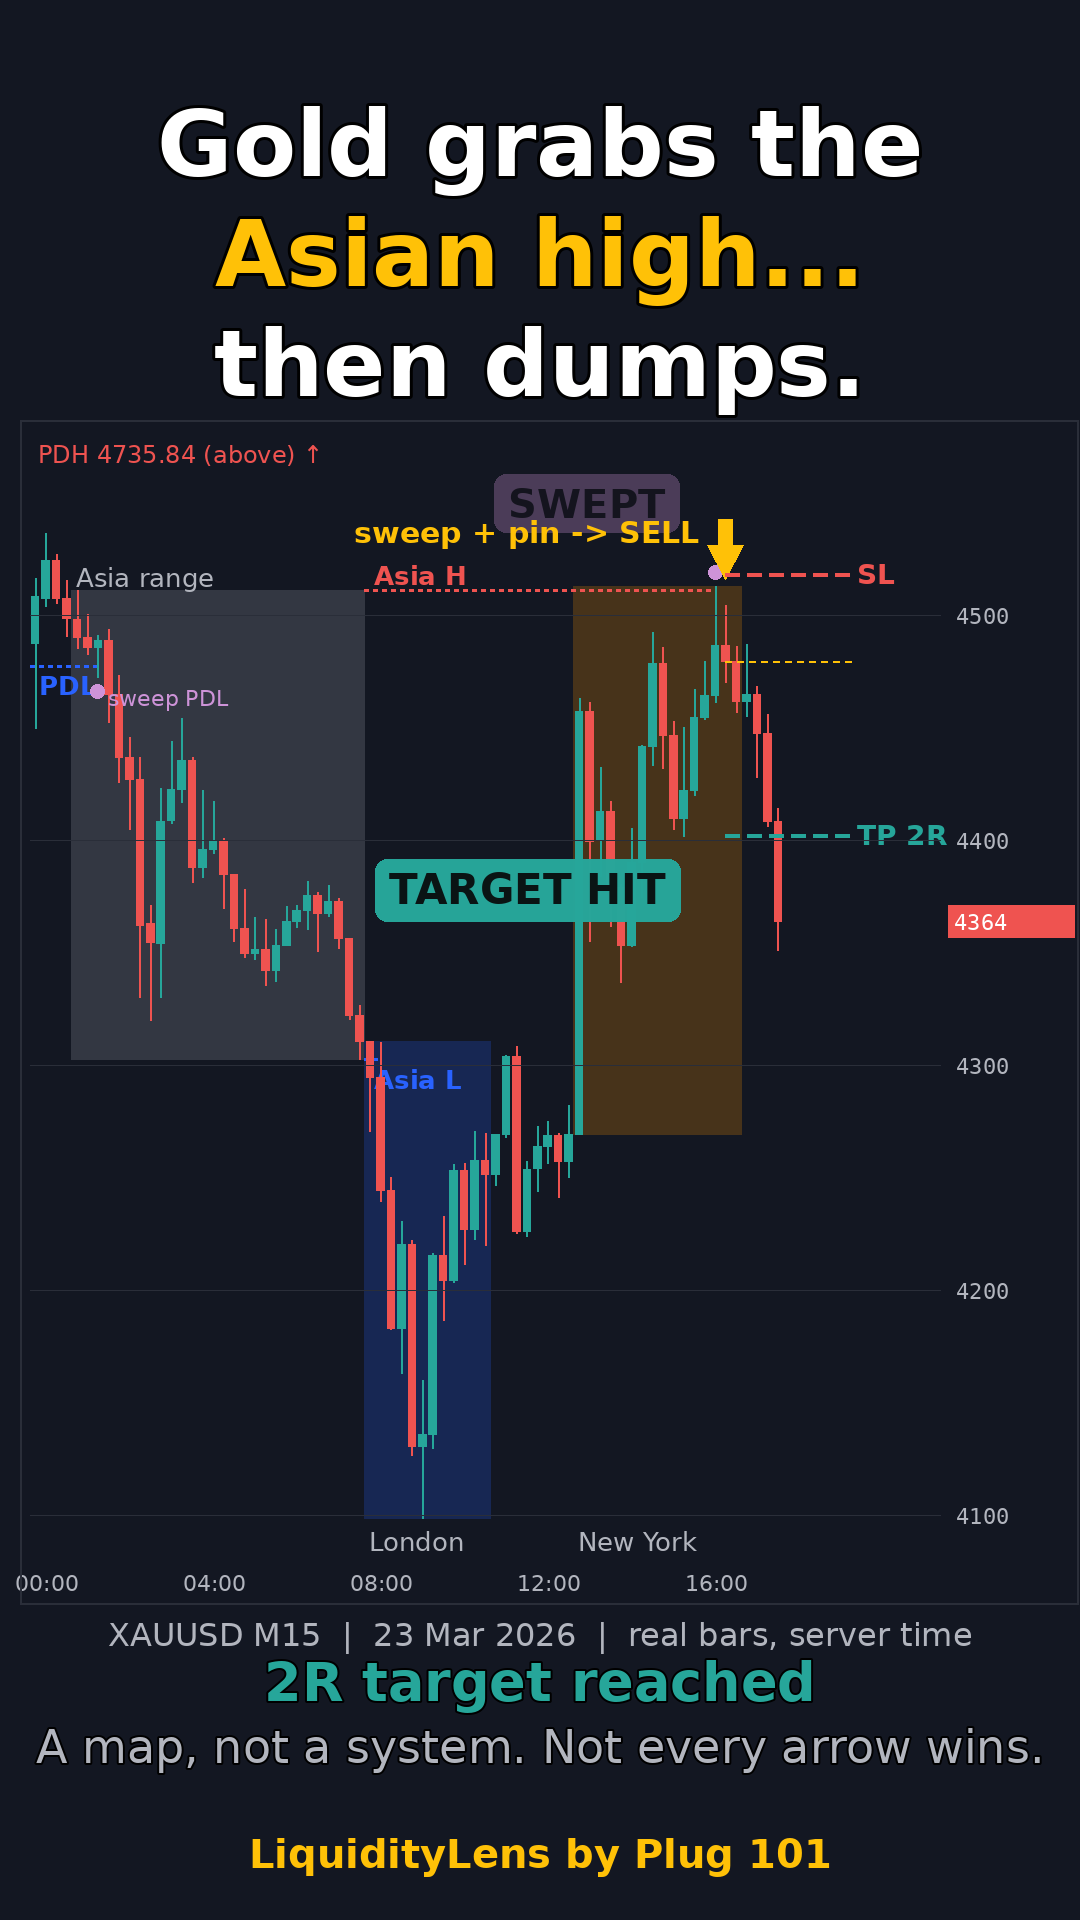 Everything above was drawn on closed bars. The arrow appeared after the 16:30 candle closed, and it was not moved or redrawn afterwards.
A map, not a system
This example worked. Many don't, and I want to be clear about that. In my Strategy Tester checks on XAUUSD H1 from 2018 to 2026 with default inputs, there were 805 arrows. Price reached two times the reference risk before the reference stop on 33.0 percent of them. At 2R you need about 33.3 percent just to break even, and that test had no spread or commission. On XAUUSD M15 the figure was 30.1 percent from 2284 arrows. So taking every arrow blindly is roughly break-even before costs, and not every arrow wins.
What the tool is good for is the map: where the obvious liquidity sits today, which side has already been taken, and when a sweep has just happened. Whether a marker is worth acting on depends on your own context. That means the higher timeframe structure, nearby order blocks and fair value gaps, and the news calendar. LiquidityLens shows those too, but the decision and the risk are yours.
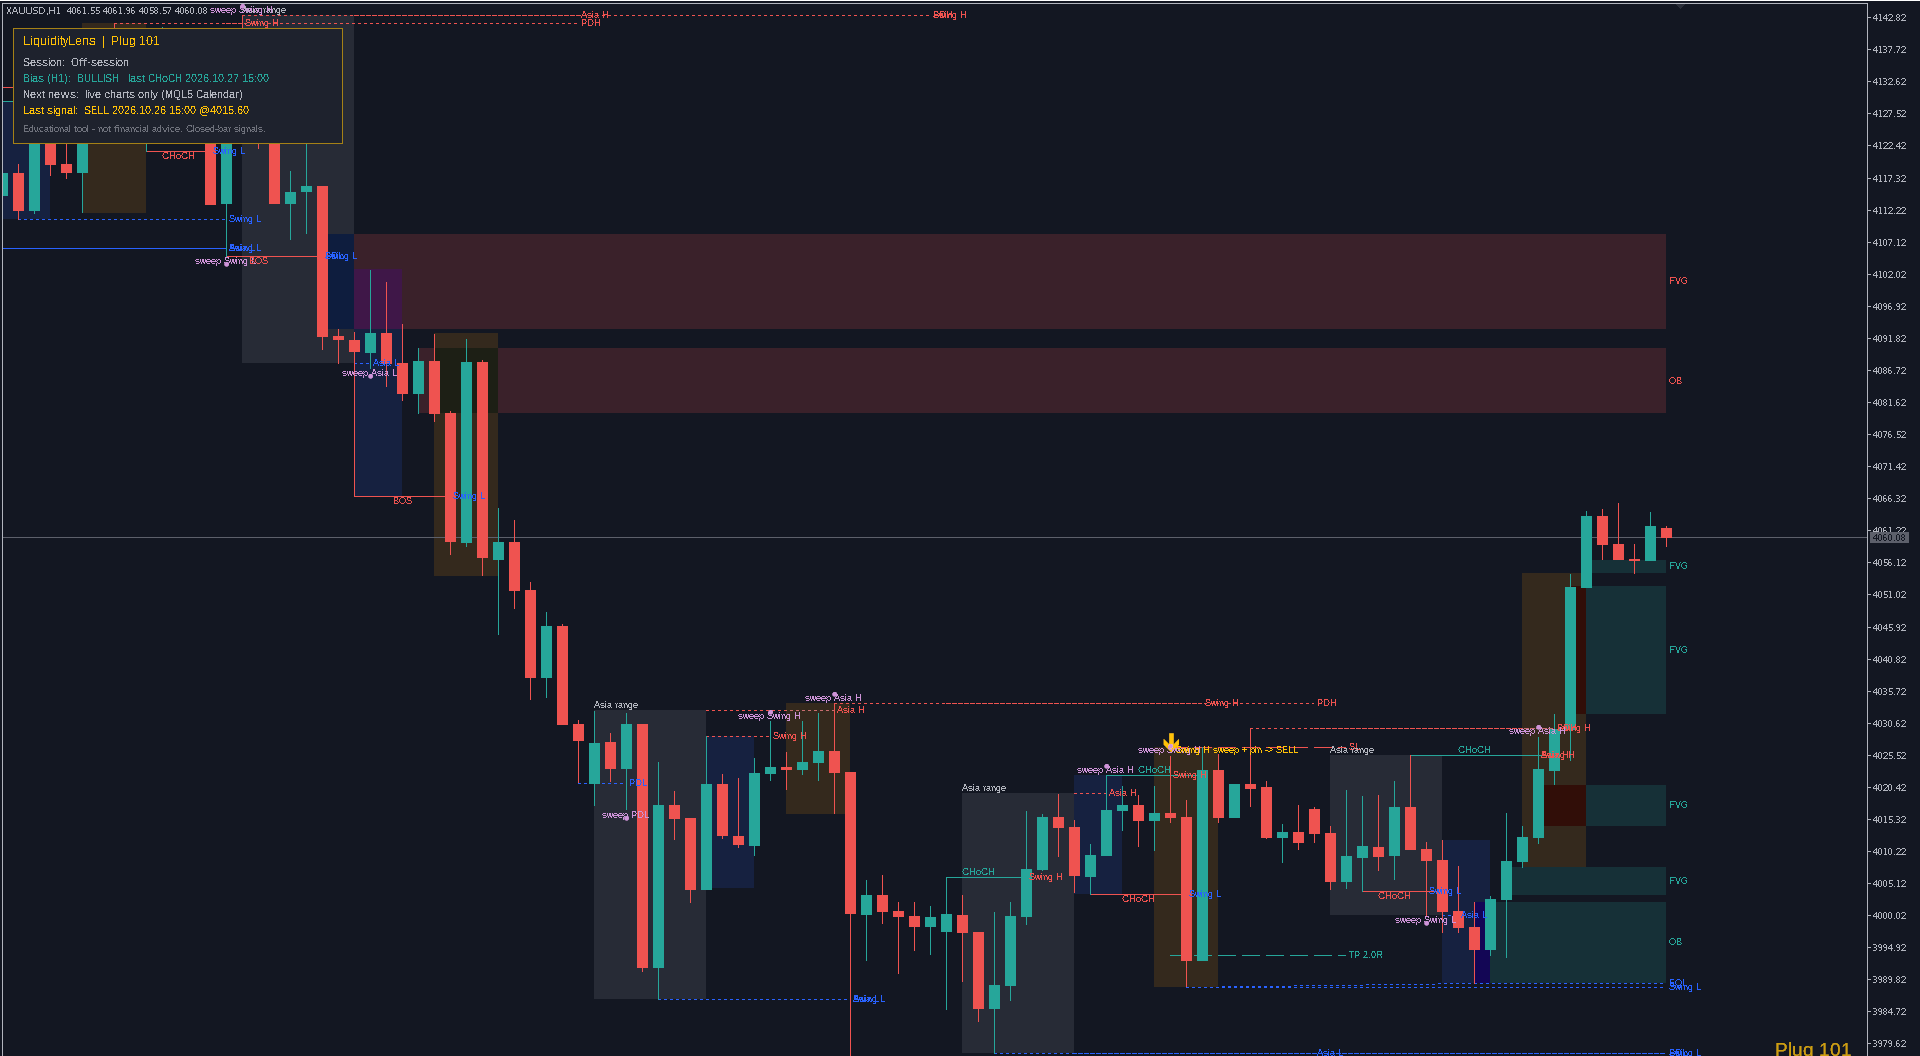
What else it draws
- London and New York session boxes behind the candles
- recent swing highs and lows, and equal highs and lows
- H1 break of structure and change of character labels
- unmitigated order blocks and fair value gaps
- the next high impact news event on live charts
- a small dashboard: session, bias, next news and the last marker
- optional pop-up, push and sound alerts
How I use it
- Before London or New York, I note the Asian range and the nearest levels.
- I wait for a sweep and a candle that closes back.
- I check it against structure, zones and news, and skip it if they disagree.
- I size the risk myself. The stop and target lines are reference levels, not orders. The indicator never trades.
Try it
LiquidityLens by Plug 101 on the MQL5 Market:
https://www.mql5.com/en/market/product/205438
The free demo runs in the Strategy Tester in visual mode, so you can replay any day, including 23 March 2026, before you decide.
If you have questions or want a feature, leave a comment on the product page. I read all of them.
Trading involves risk. Past test results do not guarantee future results. This is not financial advice.




