Available on the MQL5 Market: Trend Confluence PRO
Risk notice. Trading involves risk of loss. This indicator shows the trend of a higher timeframe, reference levels and the statistics of its own past signals on your chart. It does not predict the market, does not place trades and does not guarantee any result; past statistics do not describe future results. Use it with your own analysis and risk management, and test on a demo account first.
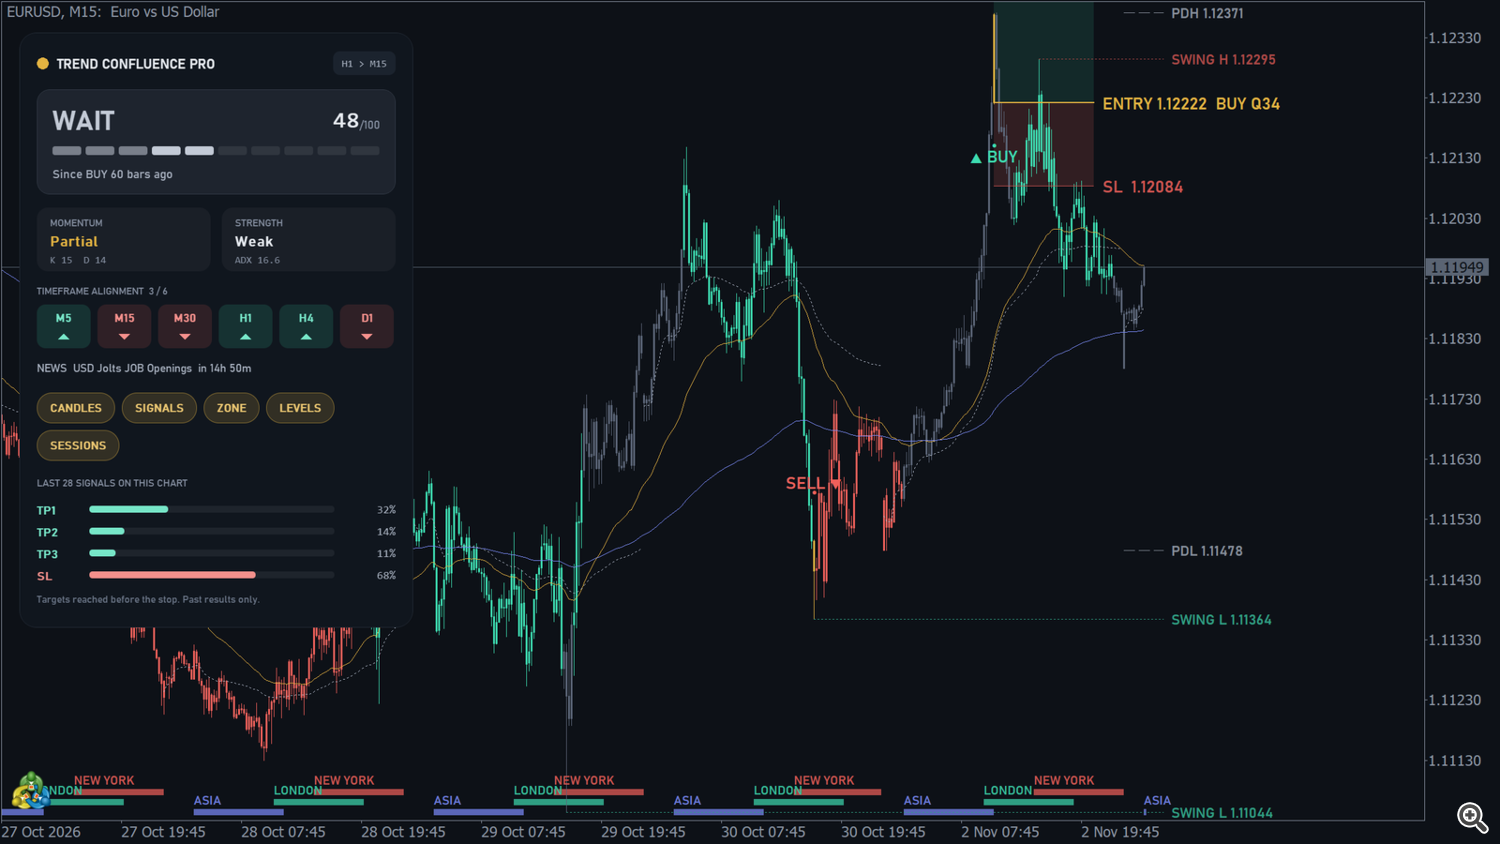
Trend Confluence PRO projects the trend of a higher timeframe onto any chart: it paints the candles by trend state, marks the first bar of every new trend as a BUY or SELL signal with a quality score (0-100), draws an entry zone with a stop loss and three targets for the latest signal, adds confluence levels (EMAs, daily VWAP, previous day high / low, untouched swings), a session strip, high-impact news awareness and a statistics card computed on the signals of your own chart. Every chart bar uses only trend bars that were already closed when it opened, so colours, arrows and buffers do not change afterwards. It works on any symbol, any broker and any timeframe.
New in version 2.00
- New inputs Show the entry zone and Show the signal marks (on by default, so nothing changes for current users). Turn them off for a clean chart or when the indicator feeds an Expert Advisor or a dashboard (section 13).
- Buffers are unchanged: trend state, quality and signal (direction, entry, SL, TP1-TP3) remain available with the zone and the marks off.
1. Installation and first start
- Buy or rent the indicator on the MQL5 Market and install it from the Market tab of the terminal (Toolbox → Market → Purchased → Install).
- Open a chart and drag Trend Confluence PRO from the Navigator (Indicators → Market) onto it.
- Keep the default inputs or adjust them (section 12) and press OK.
The chart needs at least 300 bars. The indicator calculates the last 5000 chart bars (input Chart bars to calculate). With Hide the chart's own candles while painting on (default), the terminal's candles are made invisible so that only the painted candles are seen; the original chart colours are restored when the indicator is removed.
2. Chart legend
| On the chart | Meaning |
|---|---|
| Green candles | Bullish trend of the trend timeframe. |
| Red candles | Bearish trend. |
| Grey candles | Weak trend: ADX of the trend timeframe below Weak trend below this ADX (default 20). |
| Gold candle | Trend change bar (first chart bar of a new trend). |
| Green ▲ arrow + ▲ BUY label below the bar | Buy signal (new bullish trend). |
| Red ▼ arrow + SELL ▼ label above the bar | Sell signal (new bearish trend). |
| Gold thick line + ENTRY (or LIMIT) label with side and Q score | Entry of the latest signal; NEWS is added when it was near high-impact news. |
| Green-tinted area + dotted lines TP1 / TP2 / TP3 | Targets of the latest signal with their R multiple (e.g. TP1 1:1.5). |
| Red-tinted area + line SL | Stop loss of the latest signal. |
| Gold line | Fast EMA (default 50). |
| Blue-violet line | Slow EMA (default 200). |
| Grey dotted line | Daily VWAP (restarts every day). |
| Grey dashed lines PDH / PDL | Previous day high / low. |
| Red-tinted dotted SWING H / green-tinted dotted SWING L | Untouched swing highs above / swing lows below the price. |
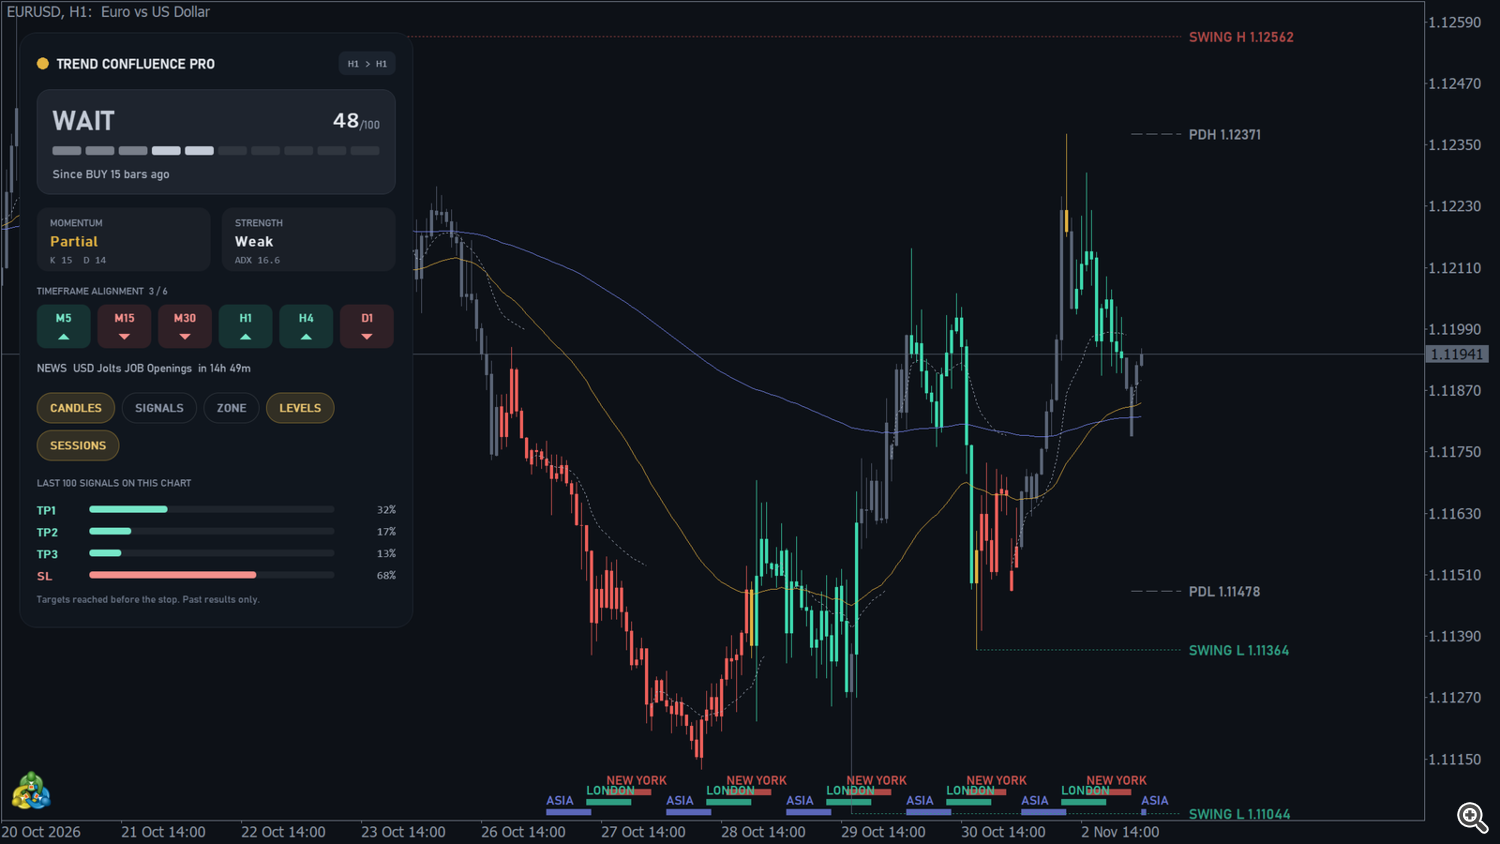
| Thin bands ASIA / LONDON / NEW YORK at the bottom | Session strip (H1 and lower charts). |
| Dark panel (top left) | Trend state, score, momentum, strength, timeframe alignment, news, toggles and statistics. |
3. Trend engine and painted candles
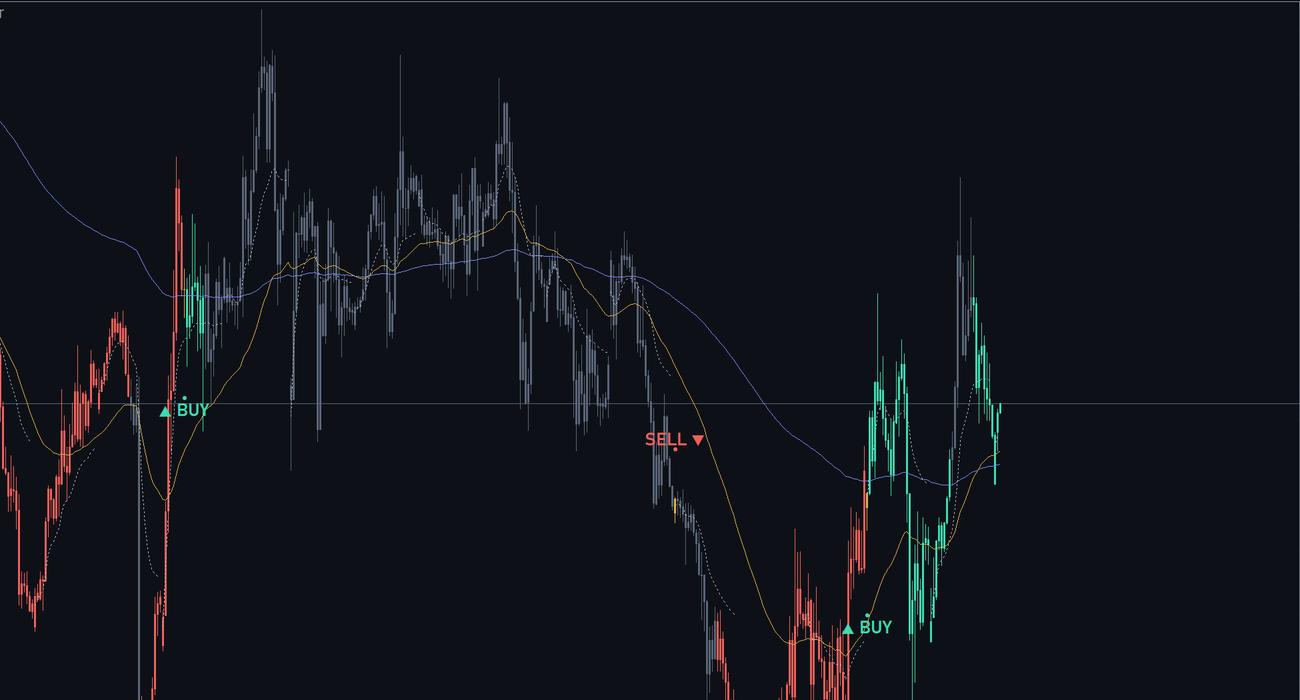
The trend is read from the trend timeframe (input Trend timeframe, default H1). When the chart timeframe is equal to or higher than it, the chart timeframe itself is used. The panel header shows the pair in use, for example H1 > M15 (trend timeframe > chart timeframe).
- The trend state is an ATR band trend (SuperTrend type) controlled by Trend ATR period (default 10) and Trend ATR multiplier (default 3.0): a larger multiplier gives fewer, longer trends.
- Each chart bar takes the state of the last trend-timeframe bar that was closed when the chart bar opened. A new H1 trend therefore appears on the first M15 bar after the H1 bar closed.
- Candle colour: bull / bear by the trend; grey when the ADX (14) of the trend timeframe is below Weak trend below this ADX; gold on the trend change bar.
- Bars without enough trend history at the start of the chart are not painted.
Paint candles with the trend = false turns the painting off (the terminal's candles stay visible).
4. Signals and quality score
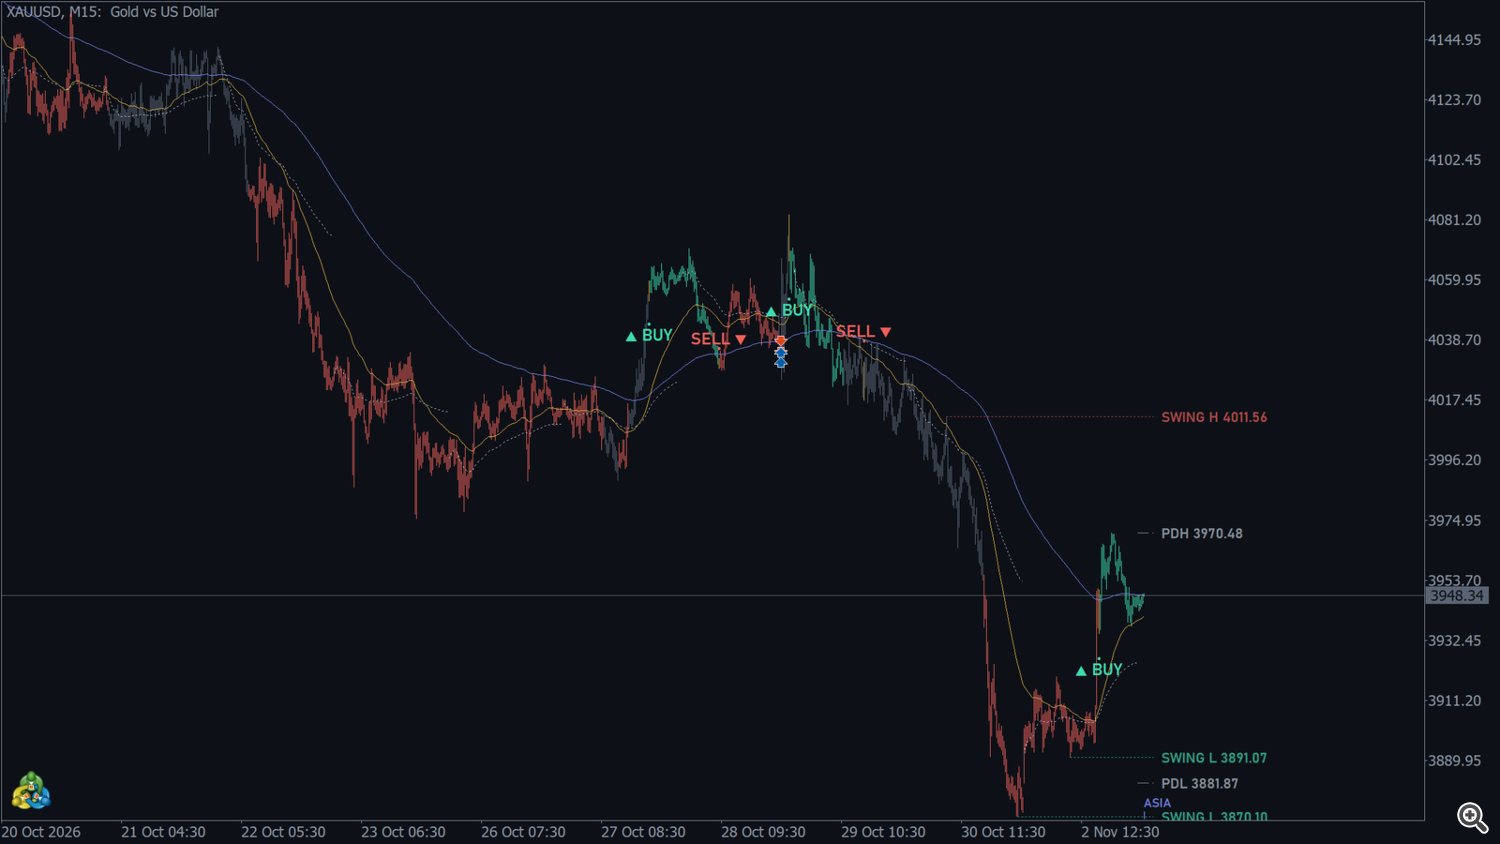
A signal is printed on the first chart bar of every new trend: BUY when the trend turns bullish, SELL when it turns bearish. The arrow is placed below / above the bar and a text mark is added for the last 60 signals (the arrows alone are small on high-resolution screens).
Arrows only above this ADX (default 0 = every trend change): with a value above 0, trend changes with a lower ADX still paint the gold candle but produce no signal, no zone, no alert and no buffer value.
Every signal has a quality score from 0 to 100, built from three parts of the trend timeframe at the signal:
- Strength — the ADX: stronger trends score higher.
- Extension — distance of the price from its fast EMA in ATR: a trend that starts close to the average scores higher than one that is already stretched.
- Momentum — the stochastic (14, 3, 3) agreeing with the new direction.
When the signal falls within Minutes before and after high-impact news of an event, its score is capped at 20 and it is flagged NEWS. The score describes the conditions at the signal; it is not a probability.
5. Entry zone: entry, stop loss and TP1-TP3
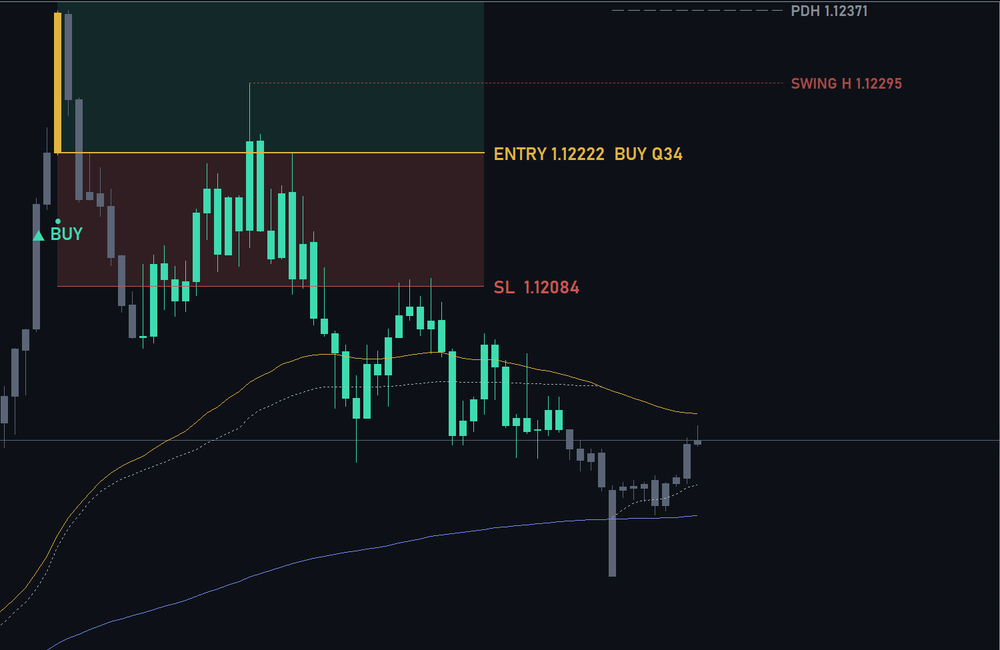
For the latest signal the indicator draws a zone Zone length chart bars long (default 40):
- Entry — At the open of the signal bar (default, label ENTRY) or Limit on a pullback (label LIMIT): the entry is placed Pullback distance × ATR (default 0.3) below the open for a buy, above it for a sell.
- SL — Stop loss × ATR (default 1.0) from the entry. This distance is 1R.
- TP1 / TP2 / TP3 — Target 1 / 2 / 3 R multiples (defaults 1.5, 2.5, 4.0). The labels show the multiple and the price, e.g. TP2 1:2.5 1.08750 .
ATR is the ATR (14) of the trend timeframe. The entry label also shows the side and the quality, e.g. ENTRY 1.08500 BUY Q72 . The zone moves to each new signal; older zones are not kept. Show the entry zone = false (2.00) hides it.
6. Confluence levels
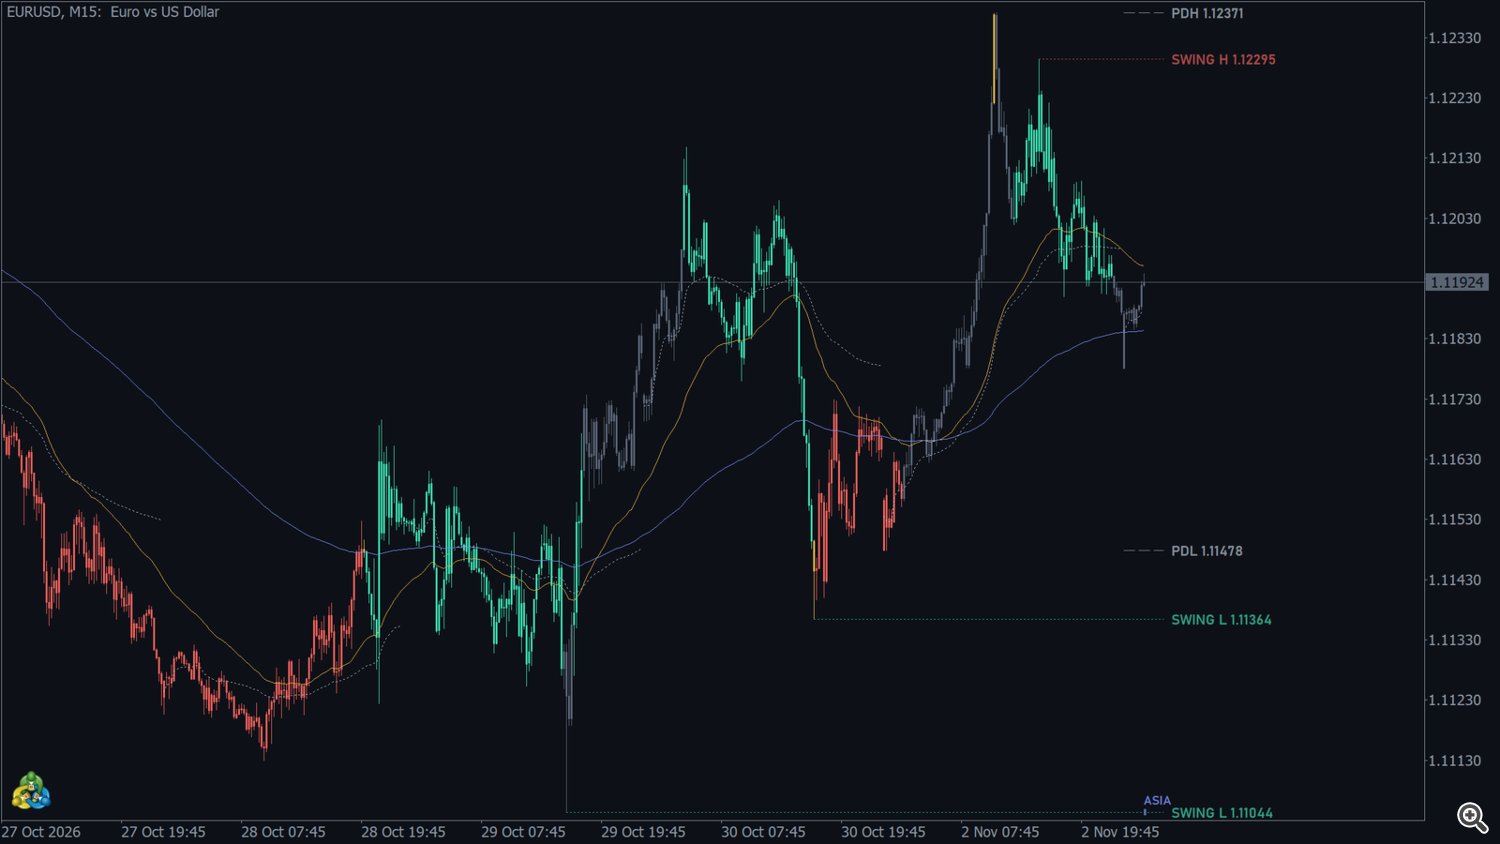
- Fast EMA / Slow EMA (default 50 / 200) of the chart timeframe — gold and blue-violet lines.
- Daily VWAP — volume-weighted average price of the day (tick volume), restarting at the start of each server day; grey dotted line.
- PDH / PDL — previous day high and low, from the start of the current day to just right of the last bar (charts below D1; input Previous day high and low).
- SWING H / SWING L — swing highs above the current price and swing lows below it that no bar has closed beyond since they formed. Swing strength (default 12 bars on each side) sets how significant a swing must be; Untouched swing levels on each side (default 2) how many are shown. A swing level very close to PDH / PDL is not drawn twice.
The levels are redrawn on every new bar. The LEVELS button of the panel shows or hides all of them, including the EMAs and VWAP.
7. Session strip

At the bottom of the chart three thin bands show when each session was open during the last Days of sessions to draw days (default 5):
| Band | Local market time |
|---|---|
| ASIA (blue-violet) | Tokyo 09:00-18:00 |
| LONDON (green) | London 08:00-17:00 |
| NEW YORK (red) | New York 08:00-17:00 |
UK and US daylight saving are applied, so the bands do not drift twice a year. The strip stays at the bottom when you scroll or zoom, and is drawn on H1 and lower timeframes.
Server time zone (needed to convert the chart time):
- Auto (live) / GMT+2/+3 in tester (default): the offset is measured from the terminal clock; brokers on GMT+2 / GMT+3 (New York close) are followed through history with US daylight saving. In the Strategy Tester GMT+2 / GMT+3 is assumed.
- GMT+2 / GMT+3 (New York close brokers): forces that rule.
- Fixed GMT offset: uses Fixed GMT offset (hours) (default 2) all year.
8. News awareness
With Use the MQL5 economic calendar on (default), the indicator reads the high-impact events of the MetaTrader economic calendar for the base and profit currencies of the symbol (for EURUSD: EUR and USD).
- Signals within Minutes before and after high-impact news (default 30) of an event get the NEWS flag and a quality of at most 20.
- The panel shows the next event and the time to it (e.g. NEWS USD Nonfarm Payrolls in 2h 15m ), in gold while a news window is open; the state card adds NEWS NOW.
- The list of events is refreshed every 30 minutes.
The calendar needs the terminal connected to the MetaQuotes servers and is not available in the Strategy Tester (the panel says so). The news filter never blocks anything: it only flags signals and caps their score.
9. Statistics card
The bottom of the panel shows LAST N SIGNALS ON THIS CHART with four bars:
- TP1 / TP2 / TP3 — percentage of signals that reached that target before the stop;
- SL — percentage stopped before reaching TP1.
How it is counted:
- Up to Signals used in the statistics card (default 100) of the most recent signals of the chart are used, on the bars of the chart timeframe.
- Only finished signals count (TP3 or SL reached). Signals still running are left out.
- In Limit on a pullback mode, a signal counts only if its limit price was reached within Zone length bars.
- If one bar touches both the stop and a target, the stop is counted (conservative).
- Spread, commission and slippage are not included.
The card shows past results of this chart only. It changes with the symbol, timeframe and inputs and is not a forecast.
10. The panel
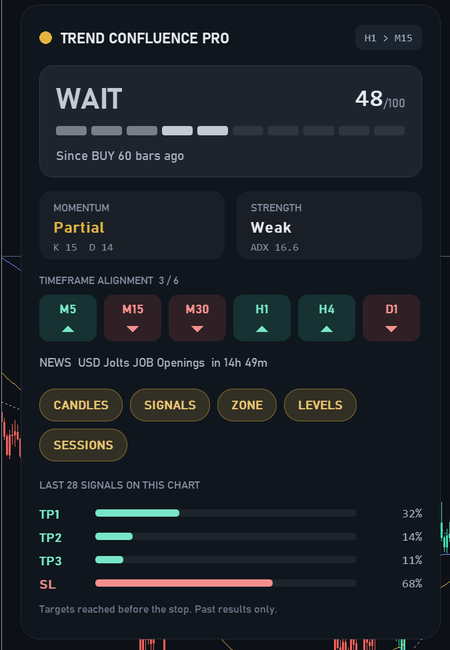
| Part | Content |
|---|---|
| Header | Gold dot, product name and the trend timeframe > chart timeframe chip. Click the header to collapse / expand the panel. |
| State card | BULLISH, BEARISH or WAIT (weak trend), the current trend score /100 with a 10-segment bar, and Since BUY / SELL N bars ago (bars since the last signal). The score uses the last closed trend bar and is capped at 20 during a news window. |
| MOMENTUM | Confirmed, Partial or Not confirmed (stochastic agreement with the trend), with the K and D values. |
| STRENGTH | Strong (ADX 25 or more), Moderate or Weak (below the weak level), with the ADX value. |
| TIMEFRAME ALIGNMENT n / 6 | Trend state of M5, M15, M30, H1, H4 and D1 (▲ bullish, ▼ bearish, ● no data) with the same ATR settings, on closed bars; n = how many agree with the current trend. |
| News line | Next high-impact event, "No high-impact news in the next 7 days", "News filter off", or the tester message. |
| Buttons | CANDLES, SIGNALS, ZONE, LEVELS, SESSIONS: click to show / hide each layer (gold = on). |
| Statistics | Section 9. |
The panel is refreshed every 2 seconds. Position: Panel X / Panel Y (pixels at 100 %), size: Panel size (%); it also follows the Windows display scale. The button states and the collapsed state are remembered for the chart until the indicator is removed. At each start, Show the entry zone = false and Show the signal marks = false turn the ZONE and SIGNALS buttons off; they can still be turned on from the panel.
11. Alerts
An alert is sent when a new signal appears, at the open of the signal bar:
Trend Confluence PRO: EURUSD | M15 | BUY (H1 trend) Q72 entry 1.08500 SL 1.08350 TP1 1.08725
- Alert on new signal: Off, Popup, Sound, Smartphone notification, Popup + Sound (default), Notification + Sound, Popup + Notification, Popup + Sound + Notification.
- Sound: terminal sound (default "alert2").
- Also send e-mail: adds an e-mail.
- Alert only from this quality (0-100): signals with a lower score are not alerted (they are still drawn).
Signals with the NEWS flag carry "NEWS" in the message. Push notifications need the MetaQuotes ID in Tools → Options → Notifications; e-mail needs the e-mail settings of the terminal. Nothing is sent in the Strategy Tester.
12. Inputs
Trend engine
| Input | Default | Description |
|---|---|---|
| Trend timeframe (used when higher than the chart) | 1 Hour | Timeframe whose trend is projected. |
| Trend ATR period | 10 | ATR period of the trend band. |
| Trend ATR multiplier | 3.0 | Band width; higher = fewer trend changes. |
| Weak trend below this ADX (grey candles) | 20.0 | Below it candles are grey and the panel shows WAIT. |
| Arrows only above this ADX (0 = every trend change) | 0.0 | Minimum ADX for a signal. |
| Chart bars to calculate | 5000 | History calculated on the chart. |
Entry zone
| Input | Default | Description |
|---|---|---|
| Entry | At the open of the signal bar | Or Limit on a pullback. |
| Pullback distance (ATR of the trend timeframe) | 0.3 | Used by Limit on a pullback. |
| Stop loss (ATR of the trend timeframe) | 1.0 | Distance of the SL = 1R. |
| Target 1 (R multiple) | 1.5 | |
| Target 2 (R multiple) | 2.5 | |
| Target 3 (R multiple) | 4.0 | |
| Zone length (chart bars) | 40 | Length of the zone; also the fill window of the limit in the statistics. |
Confluence levels
| Input | Default | Description |
|---|---|---|
| Fast EMA | 50 | Also used for the extension part of the quality score. |
| Slow EMA | 200 | |
| Previous day high and low | true | PDH / PDL lines. |
| Swing strength (bars on each side) | 12 | Size of the swings used for SWING H / L. |
| Untouched swing levels on each side | 2 | 0 = no swing levels. |
Sessions
| Input | Default | Description |
|---|---|---|
| Server time zone | Auto (live) / GMT+2/+3 in tester | Also: GMT+2 / GMT+3 (New York close brokers), Fixed GMT offset. |
| Fixed GMT offset (hours) | 2 | Used by Fixed GMT offset. |
| Days of sessions to draw | 5 | 0 = no session strip. |
News
| Input | Default | Description |
|---|---|---|
| Use the MQL5 economic calendar | true | High-impact news flag and score cap. |
| Minutes before and after high-impact news | 30 | News window. |
Statistics
| Input | Default | Description |
|---|---|---|
| Signals used in the statistics card | 100 | Most recent finished signals counted. |
Alerts
| Input | Default | Description |
|---|---|---|
| Alert on new signal | Popup + Sound | Alert mode. |
| Sound | alert2 | Terminal sound. |
| Also send e-mail | false | |
| Alert only from this quality (0-100) | 0 | Minimum score for an alert. |
Display
| Input | Default | Description |
|---|---|---|
| Paint candles with the trend | true | Painted candles. |
| Hide the chart's own candles while painting | true | Makes the terminal's candles invisible while painting. |
| Show the panel | true | |
| Panel X (px at 100%) | 16 | Distance from the left edge. |
| Panel Y (px at 100%) | 28 | Distance from the top edge. |
| Panel size (%) | 100 | Panel scale. |
| Bull color | 61,219,176 | Bullish candles, BUY marks, targets. |
| Bear color | 240,96,90 | Bearish candles, SELL marks, stop. |
| Weak trend color | 91,101,119 | Weak-trend candles. |
| Trend change / entry color | 227,179,65 | Change bar, entry line, panel accents. |
| Show the entry zone (box, SL, TP1-TP3) | true | 2.00 — false hides the zone. |
| Show the signal marks (arrows and BUY / SELL labels) | true | 2.00 — false hides arrows and labels. |
13. Buffers for Expert Advisors / dashboards
The signal and trend data can be read with iCustom + CopyBuffer . Read shift 1 (last closed chart bar) for final values: the newest bars can be recalculated once when a new trend-timeframe bar arrives.
| Buffer | Name | Values | When | Empty |
|---|---|---|---|---|
| 0-3 | Candle open / high / low / close | chart prices (painted candles) | every bar with trend data | EMPTY_VALUE |
| 4 | Candle color | 0 bull, 1 bear, 2 weak trend, 3 trend change bar | every bar | 0 |
| 5 | Buy arrow | price of the arrow | buy signal bar only | EMPTY_VALUE |
| 6 | Sell arrow | price of the arrow | sell signal bar only | EMPTY_VALUE |
| 7 / 8 | EMA fast / EMA slow | price | every bar | EMPTY_VALUE |
| 9 / 10 | VWAP (even days / odd days) | price; one of the two is filled per day | every bar | EMPTY_VALUE |
| 11 | Trend state | +1 bullish, -1 bearish; 0 = not enough history | every bar | 0 |
| 12 | Signal quality | 0 - 100 | signal bar only | 0 |
| 13 | Signal direction | +1 buy, -1 sell | signal bar only | 0 |
| 14-18 | Entry / SL / TP1 / TP2 / TP3 | prices of the signal | signal bar only | 0 |
Buffers 13-18 follow the JET signal layout (direction, entry, SL, TP1, TP2, TP3). They are filled with the zone and the marks off.
Loading. The Market version is installed in MQL5\Indicators\Market\ ; check the exact file name in the Navigator. With no parameters after the name the default inputs are used. To change inputs, pass them in the order of section 12. Every input group heading is a parameter too: pass an empty string "" in its place, otherwise every following value shifts. Inputs left out at the end keep their defaults.
```mql5 // "" = group "Trend engine", then trend TF, ATR period, ATR multiplier, weak ADX, min ADX, chart bars int h = iCustom(_Symbol, PERIOD_M15, "Market\Trend Confluence PRO", "", PERIOD_H1, 10, 3.0, 20.0, 0.0, 1000);
double st[1], dir[], q[1], e[1]; if (BarsCalculated(h) > 0) { if (CopyBuffer(h, 11, 1, 1, st) == 1) Print("trend ", (int)st[0]); // +1 / -1 if (CopyBuffer(h, 13, 1, 300, dir) == 300) // dir[299] = shift 1 for (int i = 299; i >= 0; i--) if (dir[i] != 0.0) { const int shift = 299 - i + 1; CopyBuffer(h, 12, shift, 1, q); CopyBuffer(h, 14, shift, 1, e); Print("signal ", (int)dir[i], " Q", (int)q[0], " entry ", e[0], " ", shift, " bars ago"); break; } } ```
Notes:
- An indicator created by iCustom draws its panel, zone and marks on the chart of the calling program. For a clean dashboard pass the full input list with Show the panel, Show the entry zone and Show the signal marks = false, Alert on new signal = Off and Hide the chart's own candles while painting = false (true would hide the candles of the calling chart).
- Keep Paint candles with the trend = true when reading buffers 15-18 (with false they cannot be read: error 4806).
- Wait until BarsCalculated(h) > 0 before the first read. 1000 chart bars are enough for a dashboard (minimum 300).
14. Tips
- Typical pairs: M5 / M15 chart with the H1 trend, or H1 chart with the H4 trend. Check that the chip in the panel header shows the pair you expect.
- Fewer signals: raise Arrows only above this ADX (e.g. 20) or the ATR multiplier.
- Alert filter:Alert only from this quality = 50 keeps every signal on the chart but alerts only the stronger ones.
- Compare settings with the statistics card: change the targets, the stop or the entry mode and look at how the card changes on the same chart — remembering that it is past data of one symbol and timeframe.
- Clean chart: use the panel buttons, or the 2.00 inputs Show the entry zone / Show the signal marks = false.
15. Questions and troubleshooting
- Does it repaint? No. A chart bar uses only trend bars closed before it opened. When a trend-timeframe bar arrives late from the server, the newest chart bars are recalculated once with it; values on older bars never change.
- The candles disappeared after removing the indicator. The original colours are restored on removal. If the terminal was closed abruptly, set the candle colours again in the chart properties (F8) or reload your template.
- No signals on a D1 / W1 chart. On charts at or above the trend timeframe the chart timeframe is used; signals are rarer there.
- Panel says "Economic calendar not available in the tester". Normal: the calendar exists only on live charts.
- The ZONE / SIGNALS button is off after a restart.Show the entry zone / Show the signal marks are false in the inputs, or the button was turned off earlier on that chart.
- Statistics show "-". No signal has finished yet (reached TP3 or SL) in the calculated history; increase Chart bars to calculate.
- No session strip. It is drawn only on H1 and lower charts and with Days of sessions to draw above 0, and the SESSIONS button must be on.
Support: send a private message on MQL5 to the author.