Aurelia Forge on Gold Real Ticks (2021-2026): Why I Replaced My Old Sets and the Three I Use Now

This post explains how I tested Aurelia Forge on XAUUSD, why I threw away part of my first results, and which three sets I use now. The set files are attached at the end. Everything below is a backtest in the MetaTrader 5 Strategy Tester. It is simulated, not live trading, so please read the caveats too.
Why I tested everything again
My first sets were optimised and checked on the tick history of a broker demo server. That server only had real XAUUSD ticks from May 2025, so for the years before, the tester generated ticks from the bars. The report said "24% real ticks". For a grid Expert Advisor that is not good enough, because the order of the ticks inside a bar decides when grid levels open and when the take profit is hit.
So I downloaded the full XAUUSD tick history from Dukascopy (about 323 million ticks, 4 January 2021 to 23 October 2026) and imported it into MT5 as a custom symbol. With that, the tester reported 99% real ticks. I then ran my five old sets again, with exactly the same settings:
| Old set | Net profit, old data | Net profit, real ticks | Worst floating DD, real ticks | Result |
|---|---|---|---|---|
| Conservative | +15,996 | +3,679 | 4,257 USD | lost money in 2021 (-424) and 2022 (-1,687) |
| Balanced | +20,324 | +17,066 | 6,914 USD | held up, but the worst dip doubled |
| Balanced (alt) | +18,360 | +13,092 | 6,312 USD | held up, weaker than Balanced |
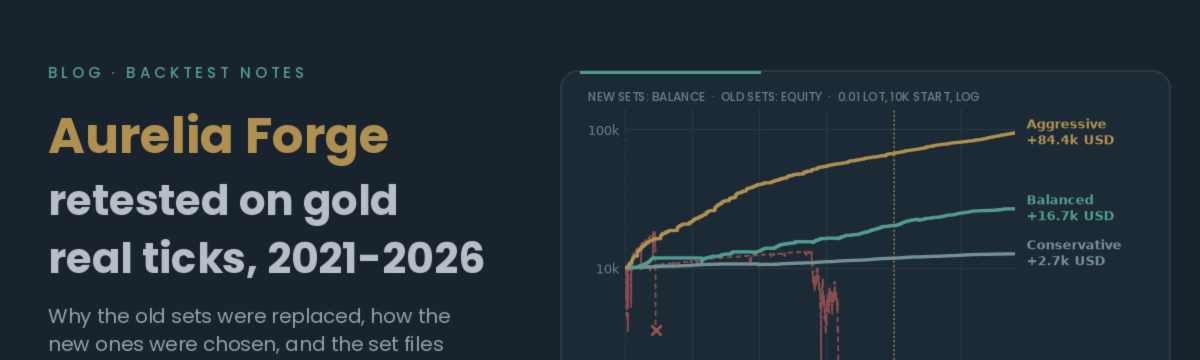
| Aggressive | +77,811 | -9,316 | 17,569 USD (96%) | blew the account on 17 June 2021 |
| Two-way | +5,311 | -9,768 | 12,940 USD (98%) | blew the account on 7 March 2024 |
Two of the five sets blew the account on real ticks, and the old Conservative was close to break-even (profit factor 1.02 in 2021 to 2024). That was enough for me: I removed all old results and charts from the product page and started the search again, this time with real ticks as the final judge.
The test setup
- Data: Dukascopy XAUUSD tick history as a custom symbol. Contract size and swaps copied from a standard demo account. Spreads come from the Dukascopy bid and ask prices. No commission or extra slippage was added.
- Period: 1 January 2021 to 23 October 2026, M5 chart, hedging account, leverage 1:100.
- Account: 10,000 USD start, fixed 0.01 starting lot, no compounding. So profit and drawdown scale with the lot: at 0.02 everything is roughly double.
- Optimisation / check split: the optimiser only saw 2021 to 2024. The period from 1 January 2025 to 23 October 2026 was kept apart as a check on data it had never seen. Trades are counted in the year in which they closed.
- Switched off in all tests: news filter, Forge Cortex, Risk-True sizing and Equity Shield.
How the new sets were found
A real-tick test of the full period needs about 6.5 GB of memory and a few minutes, so a genetic optimisation on real ticks was not possible. I did it in steps:
- Genetic search on Dukascopy 1-minute bars, separately for buy-only, sell-only and two-way: 4,970, 6,488 and 6,265 passes, so about 17,700 in total.
- Real-tick re-run: the 40 most robust and most different passes per direction were tested again over the full period on 99% real ticks (120 runs).
- Neighbour checks on real ticks: for every shortlisted set I moved the band deviation, the grid ATR multiplier and the take profit one step down and one step up, one at a time. If a set only works at one exact value, it is a spike, not a plateau, and I don't want it.
Counting the retries and the corrected runs, that is about 220 completed real-tick runs.
A set was kept only if, on real ticks:
- the profit factor was at least about 1.3 in both 2021 to 2024 and 2025 to 2026,
- every calendar year was profitable, with no blow-up and at least 300 trades,
- the worst floating drawdown made sense against a suggested deposit,
- and all six neighbours were also good.
The Balanced set below came out of the two-way search, but it trades buy-only (sell trades are switched off in its file), so I publish it as what it is: a buy-only set.
What did not make it
Most candidates failed somewhere, and some of the best-looking ones failed in the neighbour check:
- A Balanced candidate with +24,406 USD and profit factor 5.25 looked better than the one I kept. But with the take profit one step different it lost 20,962 USD in 2026.
- An Aggressive candidate with +68,769 USD blew the account in 2021 when the grid distance was one step wider.
- Other candidates lost between 6,695 and 25,730 USD in 2026 in one neighbour, or had losing years.
- Sell-only: none passed. Most made fewer than 300 trades in almost six years, one lost money in 2023 and one blew up.
- Two-way: six of the corrected two-way sets blew up. Three passed the single-run screen, the best one with +49,019 USD and 18,506 trades. But I could not run their neighbour checks (one real-tick test at a time is all the memory allows), so I do not publish any of them as a two-way set.
The three sets
All three are buy-only, fixed 0.01 starting lot, 10,000 USD start, real ticks. Profit factor is gross profit divided by gross loss. The worst floating drawdown is the deepest drop of equity including open grid positions.
| Set | Net profit | PF 2021-2024 | PF 2025-2026 | Net 2021-24 / 2025-26 | Worst floating DD | Trades | Suggested deposit per 0.01 lot |
|---|---|---|---|---|---|---|---|
| Conservative | +2,654 | 4.33 | 3.69 | +1,773 / +881 | 1,342 USD (Sep 2022) | 1,020 | 6,000 USD |
| Balanced | +16,734 | 5.20 | 2.76 | +10,238 / +6,496 | 4,810 USD (9 Aug 2021 flash crash) | 3,723 | 15,000 USD |
| Aggressive | +84,390 | 2.43 | 2.66 | +56,805 / +27,585 | 26,116 USD (Nov 2024) | 3,998 | 60,000 USD |
Net profit per calendar year in USD per 0.01 lot (2026 until 23 October):
| Set | 2021 | 2022 | 2023 | 2024 | 2025 | 2026 |
|---|---|---|---|---|---|---|
| Conservative | +462 | +118 | +515 | +678 | +583 | +298 |
| Balanced | +1,815 | +1,402 | +3,142 | +3,880 | +4,665 | +1,831 |
| Aggressive | +11,737 | +18,307 | +14,110 | +12,651 | +14,187 | +13,398 |

Conservative set, real ticks (Dukascopy 2021-2026), 0.01 lot, 10,000 USD start

Balanced set, real ticks (Dukascopy 2021-2026), 0.01 lot, 10,000 USD start

Aggressive set, real ticks (Dukascopy 2021-2026), 0.01 lot, 10,000 USD start
Neighbour checks (6 of 6 ran for each set, all profitable in every year):
| Set | PF 2021-2024 | PF 2025-2026 | Worst floating DD |
|---|---|---|---|
| Conservative neighbours | 3.52 to 8.52 | 3.21 to 4.38 | 840 to 3,275 USD |
| Balanced neighbours | 3.26 to 6.83 | 2.25 to 3.33 | 3,942 to 7,915 USD |
| Aggressive neighbours | 2.31 to 2.62 | 2.35 to 2.78 | 21,197 to 30,501 USD |
Compared with the old sets on the same real ticks: the new Conservative makes less than the old one (+2,654 vs +3,679), but it never had a losing year and its worst dip is about a third of the old one (1,342 vs 4,257 USD). The new Balanced earns about the same as the old Balanced (+16,734 vs +17,066) with about 30% less worst dip (4,810 vs 6,914 USD). The new Aggressive replaces the one that blew up, but it needs a large account.
The main inputs (everything else is at its default):
- All sets: buy only (Enable_Sell_Trades false), InpUseMM false, InpFixedLot 0.01, Maximum_Lot_Size 1.0, Maximum_Total_Exposure 5.0, EntryMode 1 (candle closes back inside the band), no basket stop loss active.
- Conservative: signal TF M2, ATR TF H4, BB period 30, deviation 2.75, Grid ATR multiplier 0.50, grid coefficient 1.00, Max Buy Orders 3, take profit 200 points, time filter 10 to 18 (server time), H1 EMA 100 trend filter, H1 ADX filter above 15.
- Balanced: signal TF M2, ATR TF M6, BB period 40, deviation 3.00, Grid ATR multiplier 0.50, grid coefficient 1.75 with progressive spacing, Max Buy Orders 6, take profit 200 points, H1 EMA 300 trend filter, no time or ADX filter.
- Aggressive: signal TF M5, ATR TF M12, BB period 50, deviation 1.75, Grid ATR multiplier 2.00, grid coefficient 1.50, Max Buy Orders 21, take profit 750 points, no filters.
About the suggested deposits: for each set, its own worst floating drawdown is at most about 22% (Conservative), 32% (Balanced) and 44% (Aggressive) of the suggested deposit. The worst neighbour reached about 50 to 55%. To show why the Aggressive deposit is so high: started with 10,000 USD, its equity fell to about 2,600 USD in June 2021, half a year into the test.
How to load the sets
- Download the .set file you want from the attachments at the end of this post.
- Open an XAUUSD M5 chart on a hedging account and attach Aurelia Forge.
- In the inputs window click "Load" and pick the .set file. In the Strategy Tester it works the same way: Inputs tab, right click, Load.
- If you change InpFixedLot, scale the deposit with it (0.02 lot means double the suggested deposit), and check Maximum_Lot_Size and Maximum_Total_Exposure, because they can cap the grid and then your results will differ from mine.
- The Conservative time filter (10 to 18) uses the server time of my test data (GMT+2, GMT+3 in summer, like many MT5 brokers). Shift it if your broker uses a different offset.
- Run it in the tester with your broker's data first, then on a demo account.
Caveats, please read these
- Buy-only in a rising market. All three sets only buy, and gold rose strongly from 2021 to 2026, including the 2025 to 2026 check period. A long falling market would hurt these sets far more than anything in this test.
- Floating loss is the real risk. None of the sets uses a basket stop loss. The balance curve looks smooth while open baskets can sit deep in loss. In the test, the Balanced set closed no trade at all for almost nine months (June 2021 to February 2022) while a basket was open, and the Conservative set had a similar pause of about six months in 2022. Please look at the green equity line in the charts, not only the blue balance line.
- Overfitting. The sets were picked from thousands of passes. The check period and the neighbour checks reduce the chance of luck, but cannot remove it. The Balanced set's profit factor fell from 5.20 in 2021 to 2024 to 2.76 in 2025 to 2026.
- Data. Dukascopy prices and spreads are not your broker's. Commission, wider spreads and slippage will reduce the results, especially with the 200-point take profits.
- Two-way and sell-only. I have no tested set for these modes. If you use them, please test them yourself first.
- Past results do not guarantee future results. This is a backtest on historical data, not a promise of anything.
Files
The three .set files (Conservative, Balanced, Aggressive) are attached below as separate files. The product page shows the same results and the three labelled equity charts. If you test them with your own broker's data, I would be glad to see your results in the comments.