Anchored VWAP Pullbacks for MT4 and MT5: How to Trade the Value Band Reclaim with Supreme VWAP And Targets

1. Introduction
Traders who work with an anchored VWAP do the same three jobs by hand on every chart. They decide where to anchor the line, they wait for price to come back to it, and they work out where the stop and the targets go. The anchor is a judgement call that changes the line completely, the wait can take hours, and the stop and targets are where most mistakes are made: a stop inside the noise, or a target never measured against the risk.
Supreme VWAP And Targets does all three jobs on closed bars and draws the result. It anchors a volume-weighted average price at the latest confirmed swing, opens a value band around it once price has moved away from that swing, and turns a pullback into the band that is reclaimed on a closed bar into a BUY or a SELL with a plan beside it: an entry, a stop and three targets. Seven filter profiles judge every reclaim side by side, and a dashboard reports which profile the chart shows and how its plans have played out on this chart.
This guide explains the rules behind every drawing, shows how to read the chart in about ten seconds, and walks through a practical way to trade with it. The figures that explain a rule are illustrations and say so in their captions; every chart screenshot is a real MetaTrader capture of the indicator.
2. Anchored VWAP in One Page
The volume-weighted average price (VWAP) is the average price traded since a starting bar, with every bar weighted by how much traded on it. A session VWAP starts again every day; an anchored VWAP starts at a bar you choose and runs on without resetting.
Anchored at a swing low, it answers a plain question: what is the average price of everyone who bought since the market turned up there? When price falls back to the line, those buyers are back at their average price, which is why many traders watch it as support in an up leg, and as resistance under a swing high in a down leg.
Supreme VWAP And Targets computes the line the standard way. Each bar's typical price, (high + low + close) / 3, is weighted by the bar's tick volume (on a symbol whose feed carries no volume, by the bar's range measured in ATR), and the VWAP is the weighted average of those prices from the anchor bar to the current bar.
Around the line it measures sigma, the volume-weighted standard deviation of the same prices: how far price has typically strayed from its average since the anchor. Sigma is never allowed below a quarter of an ATR(14), so a young anchor cannot produce a band too narrow to be touched.
Two levels are built from these numbers. The value band is the VWAP plus and minus the profile's band width times sigma, and it is drawn. The defence line sits further out, at the profile's defence width; it is not drawn, but it decides when a pullback has gone too far.
3. The Swing Anchor and When It Re-Anchors
The anchor is not chosen by hand. A swing low is a pivot: a low that no bar within 10 bars on either side goes below (Structural Anchor Swing Lookback). Because the 10 bars on its right have to exist first, a swing is confirmed 10 bars after it formed. At that moment the indicator rebuilds the VWAP from the swing bar itself: its value counts every bar from the swing on, while the line is drawn from the confirming bar forward.
A confirmed swing low becomes the bullish anchor when the confirming bar closes above it and one of four things is true:
- there is no bullish anchor yet, or the last one has ended;
- the new swing low is lower than the current anchor;
- the current anchor has already given its pullbacks: Max Pullbacks Per Trend Anchor (2) signals, counted on the Balanced profile;
- the current leg is armed (section 4), the new swing low is higher than the anchor, and the confirming bar's high is already 1.4 ATR above it, so a new impulse has started from it.
Swing highs do the same for the bearish anchor, mirrored. Both anchors are tracked at once, each with its own VWAP and sigma.
An anchor also ends by itself. A bullish anchor ends when a bar closes below the anchor price, or more than 2.6 sigma below its VWAP; a bearish one on a close above its anchor price, or more than 2.6 sigma above its VWAP. The next swing that qualifies then starts a new one. The active anchor carries a badge with an anchor symbol and the word AVWAP, on the swing bar at the swing's price.
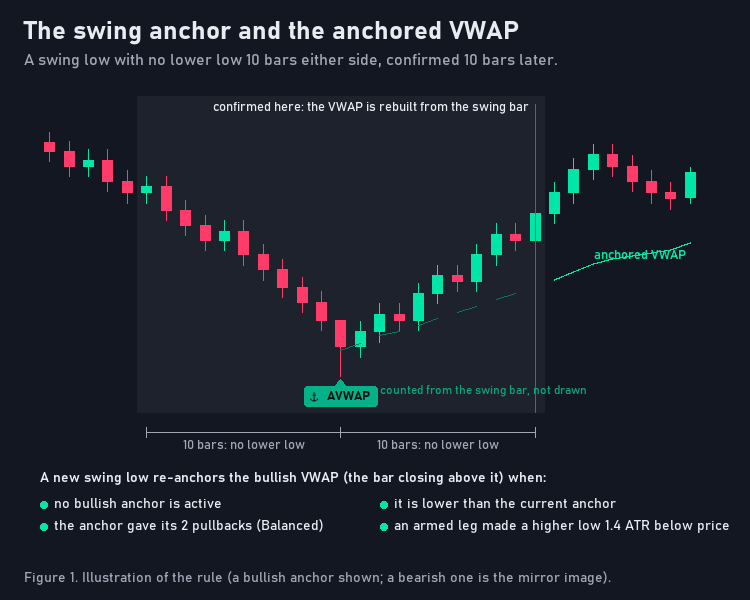
Figure 1. Illustration of the rule: the swing is confirmed 10 bars late, and the VWAP is then rebuilt from the swing bar itself (a bullish anchor shown; a bearish one is the mirror image).
4. Arming and the Bias
An anchor on its own produces no signal. Price first has to show that the swing started a move: the leg is armed once its impulse, the highest high since the bullish anchor (the lowest low since the bearish one), is at least 1.4 times the ATR(14) away from the anchor price (Min Impulse Expansion). An anchor confirmed after price has already travelled that far is armed at once.
The bias decides which side the chart shows:
- bullish when only the bullish leg is armed, bearish when only the bearish leg is;
- when both legs are armed, the newer anchor decides;
- when neither is armed, the active anchor decides, bullish if both are active;
- with no active anchor at all, the bias is neutral and there is no band.
The bias chooses the band, its fill and the anchor badge. It does not block the other side: both legs are watched for pullbacks at the same time, so a SELL can print from an armed bearish leg while the band on the chart belongs to the bullish anchor. Read the badge and its plan, not only the colour of the band.
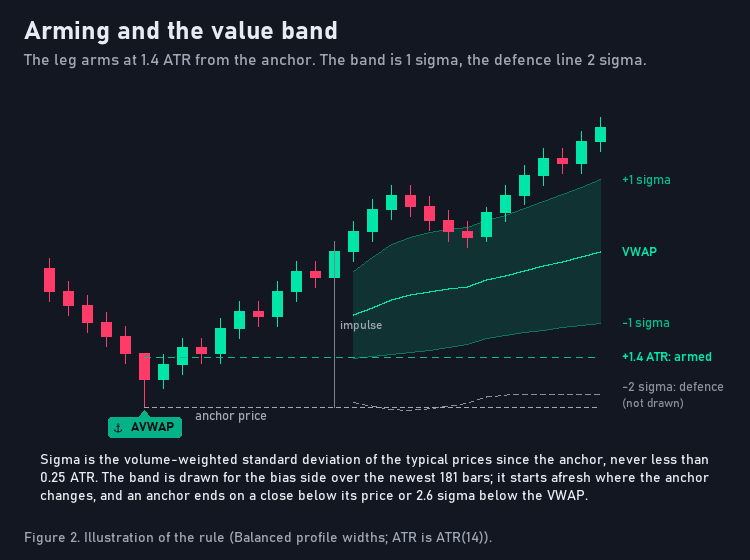
Figure 2. Illustration of the rule: the leg arms when the impulse reaches 1.4 ATR from the anchor; the band and the defence line are measured in sigma around the VWAP (Balanced profile widths).
5. The Value Band
The value band is where a pullback is expected to meet buyers in an up leg, or sellers in a down leg. Its edges sit at the VWAP plus and minus the band width times sigma, and the width belongs to the filter profile: 1 sigma on Balanced, from 0.65 sigma on Shallow Pullback up to 1.45 sigma on Deep Value Reclaim. The defence line sits at 2 sigma on Balanced; a close beyond it means the pullback has turned into something else, and it is dropped.
The chart draws the VWAP of the bias side in the trend colour, the two band edges as thin lines, and a shaded fill between them, behind the candles. The band covers the most recent 181 bars only and starts afresh where the anchor changes, so the line breaks at every new anchor instead of jumping across; the calculation still runs over the whole window. The width drawn is that of the profile the chart shows, so under Auto-Optimize it changes when the chosen profile changes.
MetaTrader 4 draws an indicator over the candles. There the fill is drawn as one column per bar, and on a candlestick chart the candles inside the band are drawn again on top of it in the chart's own candle colours, so the fill sits under the candles as it does on MetaTrader 5.
6. The Pullback and the Reclaim
With an armed bullish leg, the indicator waits for a pullback into the band. A closed bar starts a pullback, or continues one, when all four of these hold:
- its low reaches the band's upper edge or goes below it;
- it closes at or above the defence line;
- it closes above the anchor price;
- its high stays below the impulse high, so it is not a new high of the leg.
While the pullback runs, its lowest low is tracked. A close below the defence line cancels it.
The reclaim is the bar that ends the pullback in the direction of the leg. During the pullback, a closed bar is a reclaim when:
- it closes above the VWAP;
- it is a bullish candle, closing above its open;
- its close is no lower than the previous bar's high minus 0.2 ATR.
The reclaim can be the same bar that touched the band. A reclaim is ignored while the profile already holds an open long plan, and each profile takes at most 2 signals from one anchor.
A SELL mirrors every rule on an armed bearish leg: a high that reaches the band's lower edge, a close at or below the defence line above the VWAP, a close below the anchor price and a low above the impulse low, then a bearish candle that closes below the VWAP and no higher than the previous bar's low plus 0.2 ATR.
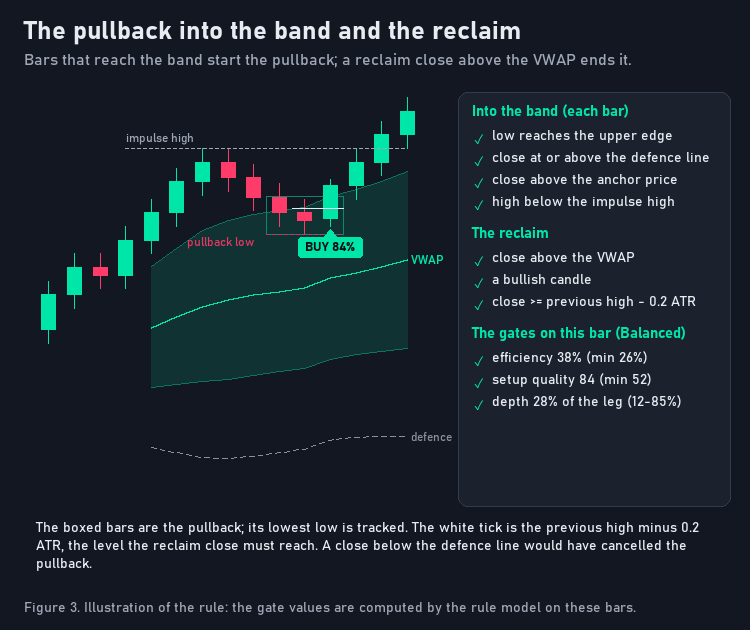
Figure 3. Illustration of the rule: the bars inside the pullback, the low that is tracked, and the reclaim close that becomes the BUY.
7. The Filters and the Setup Quality
A reclaim is a candidate, not yet a signal. It becomes a BUY or a SELL only when every gate of the profile agrees:
- Trend efficiency. The net close-to-close move of the last 10 bars as a percentage of the path price travelled bar by bar over those bars (Kaufman's efficiency ratio): a straight line scores 100 percent, chop close to 0. It must reach the profile's minimum, 26 percent on Balanced.
- Setup quality. A score from 0 to 100: where the close sits in the bar's range, near the high for a BUY and near the low for a SELL (40 percent of the score), the trend efficiency (35 percent, full at an efficiency of 55 percent), and the bar's activity (25 percent, full at twice its 20-bar average tick volume). It must reach the profile's minimum, 52 on Balanced, and it is the number on the badge.
- Activity. The reclaim bar's tick volume against its 20-bar average (on a symbol without volume, its range against the ATR). Only Volume Climax sets a minimum: 1.25 times the average.
- Depth. The pullback must have retraced between 12 and 85 percent of the impulse leg: from the impulse high down to the pullback low, against the leg from the anchor to the impulse high (taken as at least half an ATR). Less is hardly a pullback; more has given back almost the whole leg.
- Crash guard. It refuses a BUY on a falling candle that ends a five-bar fall of more than 3.6 ATR, and a SELL on a rising candle after a five-bar rise of the same size. A reclaim candle must already close in the trade's direction, so the guard never refuses a reclaim on its own; it is listed so the rule set is complete.
The dashboard's header shows the trend efficiency of the current bar next to the bias, in the bias colour when it clears the profile's minimum and muted when it does not.
8. SKIP: the Reclaims That Were Refused
A reclaim that fails any gate is a SKIP. No signal prints, the pullback is dropped, and the next pullback into the band starts fresh.
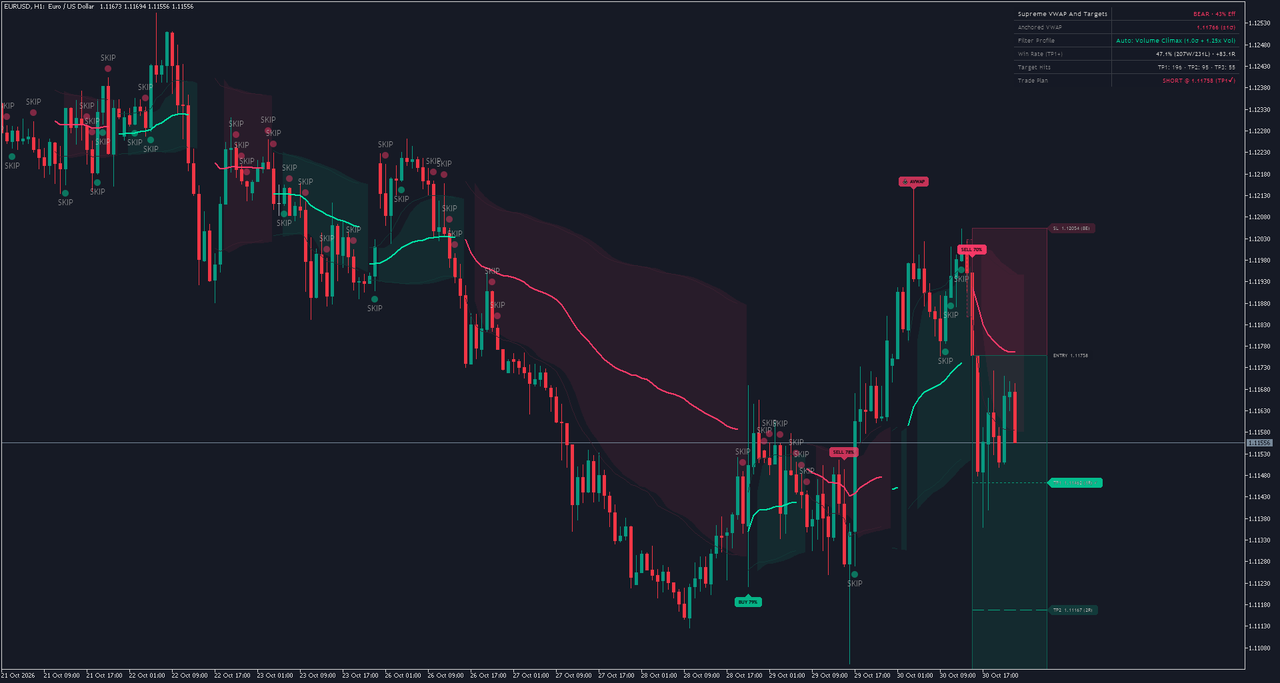
Show Filtered (SKIP) Pullbacks, off by default, marks every refused reclaim of the profile on the chart with a small circle and the word SKIP: below the bar for a refused BUY, above it for a refused SELL. The circle marks the bar; it does not say which gate refused it.
A SKIP marks a place where the structure was there and the gates said no, and a cluster of them around the VWAP says the market is chopping around its average price. Leave the markers off for a clean chart, and switch them on to see how much the filters hold back on your market.
9. The Trade Plan: Entry, Stop, Three Targets and the Magnet
Every signal is drawn with its plan.
- Entry: the close of the signal bar.
- Stop: for a BUY, below the lower of the pullback low and the band's lower edge, by a buffer of Stop Loss Buffer Beyond Pullback (0.2 ATR) times the profile's stop factor. The distance from the entry is then held between the profile's minimum (0.35 ATR on Balanced) and 3 ATR. A SELL mirrors it above the higher of the pullback high and the band's upper edge. That distance is the plan's risk, R.
- Targets: TP1, TP2 and TP3 at 1, 2 and 3 R.
- The magnet (MAG): with the default Target Projection Mode, R Ladder + Impulse High/Low Magnet, the extreme of the impulse (its high for a BUY, its low for a SELL) becomes a target when it lies within reach. TP2 moves onto it when it is 1.3 to 2.4 R from the entry; TP3 when it is more than 2.4 and up to 4.5 R away. The label then shows that target's own R, rounded to 0.1, followed by MAG. TP1 always stays at 1 R; Fixed R Ladder keeps all three at 1, 2 and 3 R.
- Breakeven: with Move Stop to Breakeven After TP1 (on by default), the plan's working stop moves to the entry once TP1 is reached.
The plan is followed on closed bars from the bar after the signal: on each bar the stop is checked first, then TP1, TP2 and TP3, so one bar can reach several targets. A plan ends at its stop (before TP1 a loss of 1 R; after TP1 it counts as a plan that reached TP1), at TP3, 60 bars after the signal unless TP3 was reached on that bar, or at the next signal of the same profile, which closes it and opens the new plan.
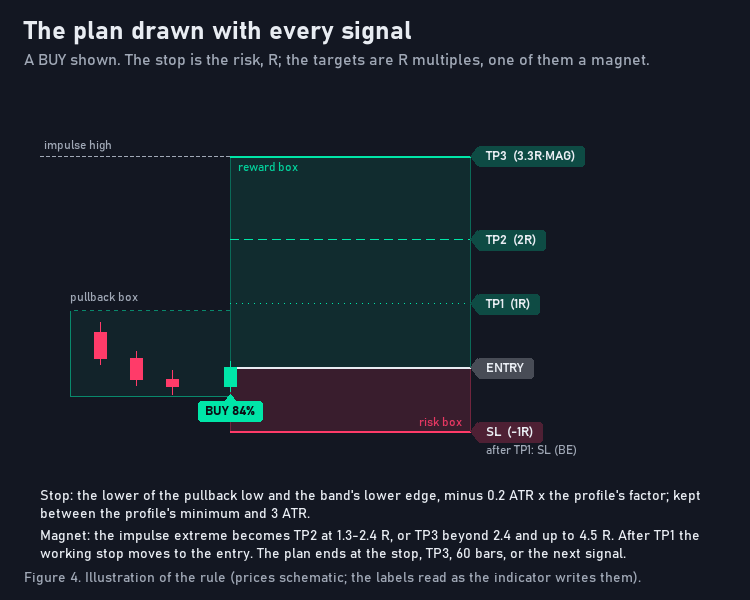
Figure 4. Illustration of the rule: a BUY whose impulse high lies 3.3 R away, so TP3 moves onto it and reads MAG (prices schematic).
The newest plan is drawn as a ladder: a dotted pullback box from the start of the pullback (at most 12 bars back) to the signal bar, a risk box to the stop in the bearish colour, a reward box to TP3 in the bullish colour, and the entry, stop and target lines with labels at the right end. A reached target gets a tick. The stop label keeps the initial stop price and reads (-1R), then (BE) once TP1 has moved the working stop to the entry, and a cross if the stop was reached before TP1. An open plan reaches six bars past the last bar; a finished one stops where it ended.
The signal itself is a badge, BUY or SELL with the setup quality in percent, under the signal bar for a BUY and over it for a SELL; hover it for its tooltip. The last three signals are badged; with Keep Historical Trade Plans (Last 5) the last five are badged and the last three plans are drawn.
10. The Seven Profiles and Auto-Optimize
The gates are not one fixed set. Seven filter profiles run side by side over the whole calculated window, each with its own pullbacks, plans and record. They differ in the band width, the defence line, the minimum efficiency and quality, the stop buffer and the minimum stop, and on Volume Climax the activity gate.
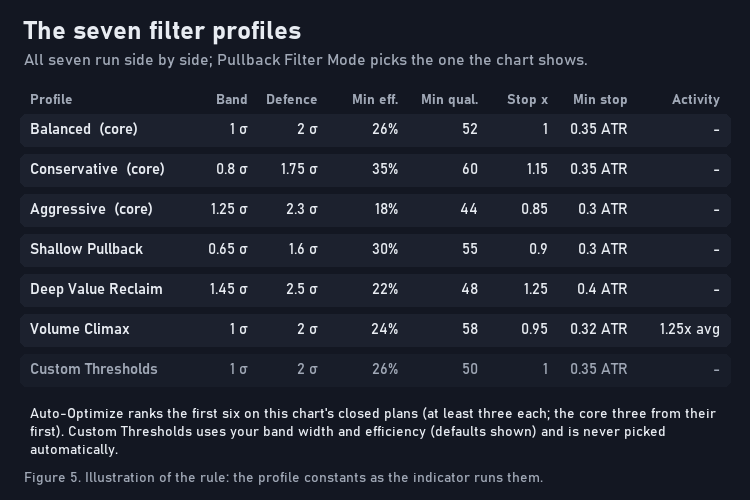
Figure 5. Illustration of the rule: each profile's band, defence line, gates and stop, as the indicator runs them.
Balanced is the middle (1 sigma, 26 percent efficiency, quality 52). Conservative narrows the band to 0.8 sigma and asks for 35 percent and quality 60; Aggressive widens it to 1.25 sigma and accepts 18 percent and quality 44. Shallow Pullback takes the narrowest band, 0.65 sigma; Deep Value Reclaim the widest, 1.45 sigma, with the most room for the stop. Volume Climax adds the activity gate, and Custom Thresholds uses your own band width (1 sigma by default) and minimum efficiency (26 percent).
Pullback Filter Mode picks the profile the chart shows; choose one to keep it fixed. The default, Auto-Optimize (Best Chart Win Rate), chooses on every bar by the records of this chart's history, which are not a probability:
- among the first six profiles, those with at least three closed plans compete on the share of their closed plans that count as wins;
- Balanced, Conservative and Aggressive, the three core profiles, compete from their first closed plan; while no profile qualifies, any of the six with a closed plan does;
- a tie goes to the higher net result in R;
- until any profile has closed a plan, Balanced is shown. Custom Thresholds is never chosen automatically.
When a closed plan changes the ranking, the chart switches to the new leader: its badges, plan, band width and dashboard figures. Each profile's signals stay as they were; what changes is the profile you are looking at. The records cover the bars set by Bars to calculate (20,000 by default): more bars give each profile more closed plans to be judged on, and a reload with a different value can change the pick.
The figure Auto-Optimize ranks by is the dashboard's Win Rate (TP1+) row: the share of this chart's closed plans that reached TP1 or closed without a loss, over the bars loaded. A plan counts as a win when it reached TP3, when it had reached TP1 before it ended, or when it expired or was closed by the next signal with its close at or beyond the entry in its favour; every other closed plan is a loss. There is no spread, slippage or commission in the count. The row describes this chart's history, not a probability, and the profile on the chart was chosen because its record on that history is the highest, one more reason not to read it as a forecast.
11. Reading a Chart in Ten Seconds
When a badge prints, read the chart in the same order every time.
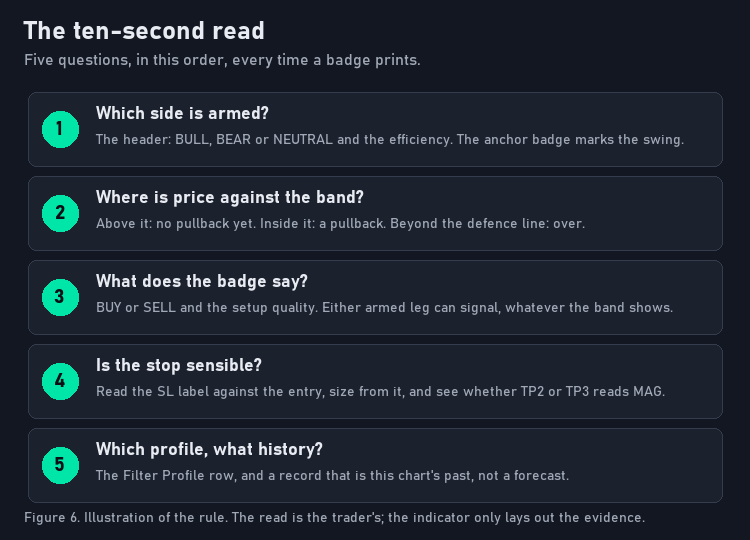
Figure 6. Illustration of the rule: five questions in order. The read is the trader's; the indicator only lays out the evidence.
- Which side is armed? The header reads BULL, BEAR or NEUTRAL with the trend efficiency; the anchor badge marks the swing.
- Where is price against the band? Above it in an up leg, no pullback yet; inside it, a pullback is running; beyond the defence line, it is over.
- What does the badge say? BUY or SELL and the setup quality. A SELL under a bullish band comes from the other armed leg.
- Is the stop sensible? Read the SL label against the entry, and see whether TP2 or TP3 reads MAG.
- Which profile, and what history? The Filter Profile row names it; its record is this chart's past, not a forecast.
12. A Practical Workflow
- Install and attach. Install it from its Market page (MetaTrader 5: {{MT5_URL}}, MetaTrader 4: {{MT4_URL}}) and attach it with the defaults.
- Choose the chart. H1 is a good start: room between signals to manage each one, and plans that run at most 60 bars.
- Read the dashboard. A BUY with the header in the bullish colour is a different trade from a BUY while the header is muted.
- Wait for the pullback. When price trades into the band, the reclaim is the next thing to watch; set the alerts if you will be away (section 15).
- Read the signal in ten seconds when the badge prints.
- Size from the stop. Size the position so that the stop distance costs the amount you accept to lose on one trade.
- Manage by the plan. Decide before entering what you do at TP1: take part off, move your own stop to the entry, or hold for TP2 and TP3. The order and the decision are yours.
- Keep a journal of the profile, the setup quality and the outcome of every plan you take.
13. Three Common Mistakes
- Treating a touch of the band as the signal. A touch starts a pullback; the signal is the reclaim close, and only when every gate agrees.
- Reading the dashboard's record as a forecast. The Win Rate (TP1+) row counts how this chart's past plans ended under these rules; it describes this chart's history, not a probability, and Auto-Optimize picked the profile because that history was the highest of the six.
- Letting the plan size the position. Two signals of one profile can have very different stops, because the stop follows the pullback and the band. The position size must follow the stop.
14. Worked Examples on Real Charts
Every screenshot below is a real MetaTrader capture of the indicator, at its default settings unless the text says otherwise, on a broker's demo feed. The charts were chosen for their spread of markets, timeframes and settings before their plans were looked at. The text under each one is read from the capture itself: the newest badge's tooltip and, where the test build recorded the same chart, the newest plan's levels. It describes what is drawn, not how a plan ended.
EURUSD H1, MetaTrader 5
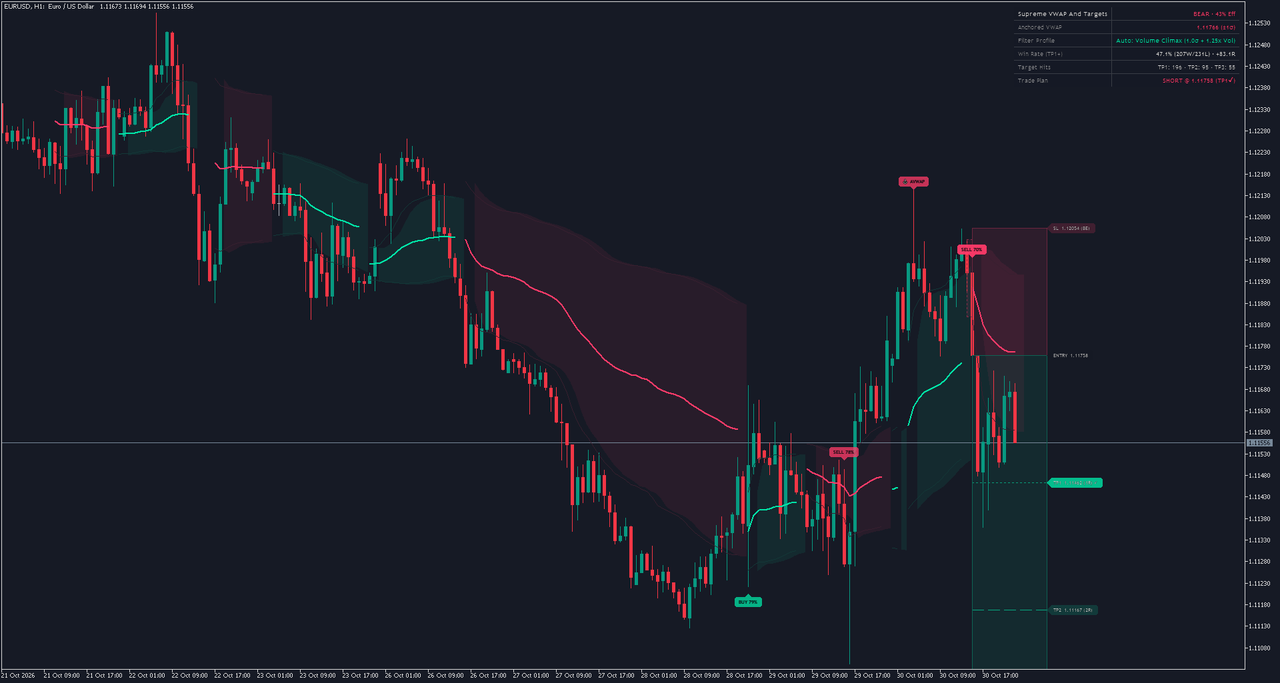
The newest badge is a SELL on the 15:00 bar of 30 October and reads SELL 70%. Auto-Optimize shows the Volume Climax profile. Its plan: entry 1.11758, stop 1.12054, TP1 1.11462, TP2 1.11167 and TP3 1.10871. The whole picture at the default settings: the anchor badge on the swing, the band of the active anchor, the badges of the last three signals, the plan of the newest one and the dashboard in the corner.
EURUSD H1 close-up, MetaTrader 5
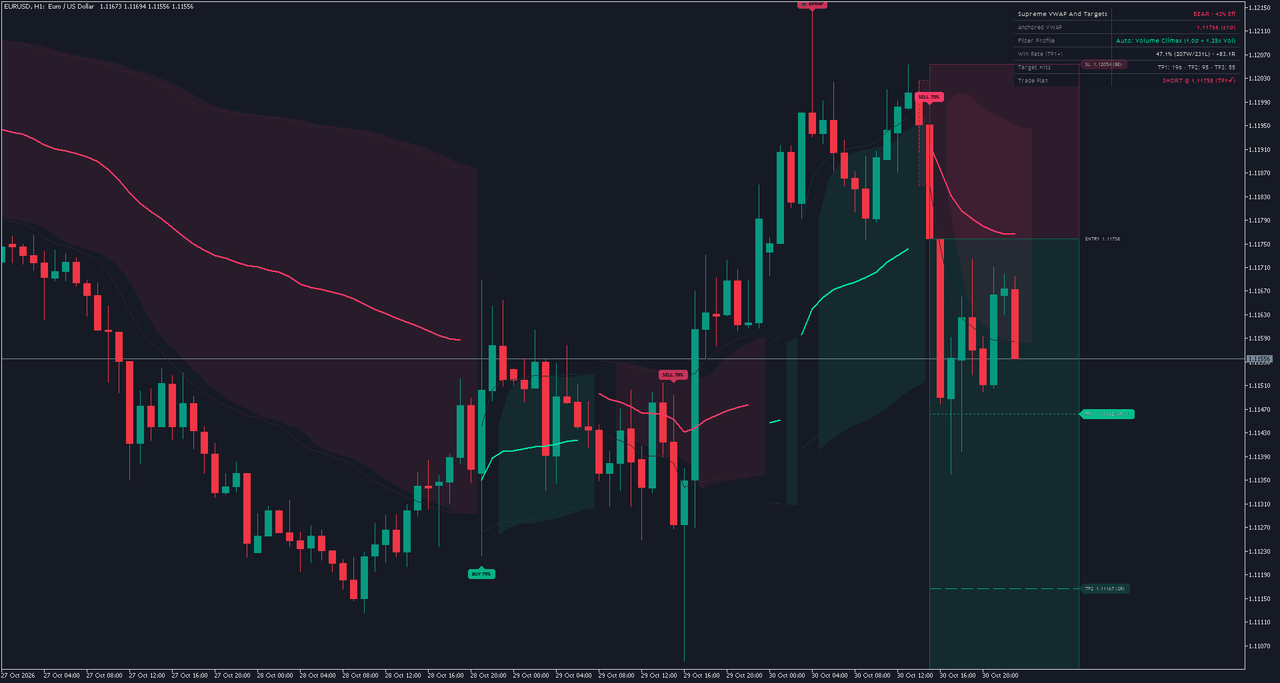
The newest badge is the SELL on the 15:00 bar of 30 October again, reading SELL 70%. The same chart at a larger zoom, where the pullback box, the risk and reward boxes and the plan's labels can be read. In the terminal, hover a badge for its tooltip.
EURUSD H1 with SKIP markers, MetaTrader 5
The newest badge is the SELL on the 15:00 bar of 30 October again, reading SELL 70%. The same chart with Show Filtered (SKIP) Pullbacks switched on. Every circle is a reclaim the profile refused; compare their number with the badges.
Gold H1 with past plans, MetaTrader 5
The newest badge is a SELL on the 16:00 bar of 30 October and reads SELL 88%. Auto-Optimize shows the Shallow Pullback profile. Its plan: entry 3920.79, stop 3974.68, TP1 3866.90, TP2 3813.01 and TP3 3759.12. Gold with Keep Historical Trade Plans (Last 5) switched on: five badges and the boxes and lines of the last three plans. Only the newest plan carries price labels.

Ether H1, MetaTrader 5
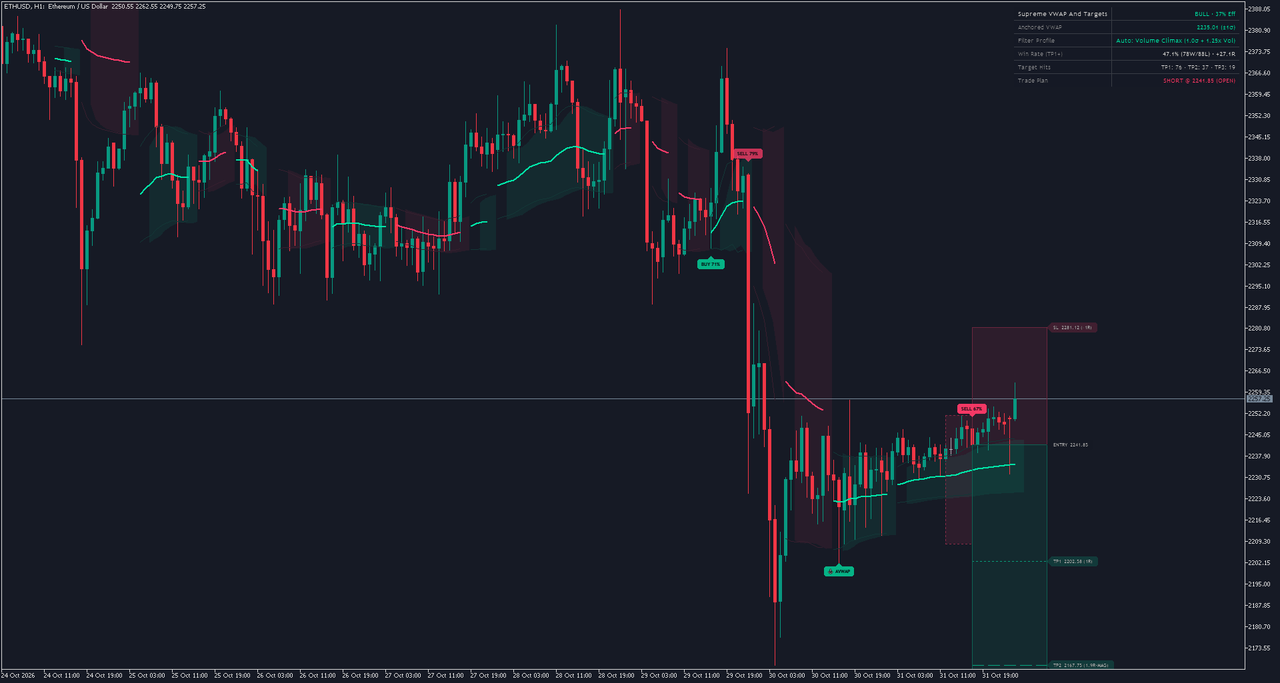
The newest badge is a SELL on the 17:00 bar of 31 October and reads SELL 67%. Auto-Optimize shows the Volume Climax profile. Its plan: entry 2241.85, stop 2281.12, TP1 2202.58, TP2 2167.75 (MAG, 1.9 R) and TP3 2124.04. The impulse extreme lay within reach, so the magnet moved a target onto it. Crypto trades through the weekend, so its anchors and plans run without weekend gaps.
DAX 40 H1, MetaTrader 5
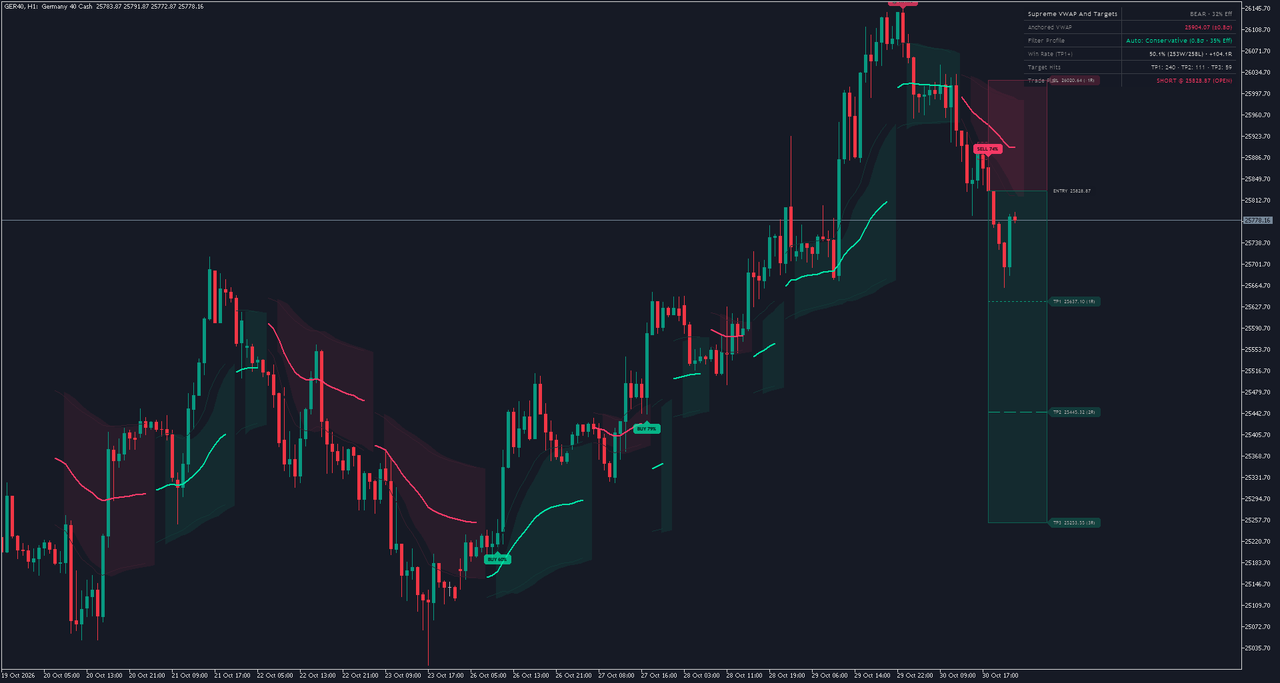
The newest badge is a SELL on the 18:00 bar of 30 October and reads SELL 74%. Auto-Optimize shows the Conservative profile. Its plan: entry 25828.87, stop 26020.64, TP1 25637.10, TP2 25445.32 and TP3 25253.55. An index chart: the stop is held between the profile's minimum and 3 ATR whatever the price level, so R is measured in index points.
EURUSD M5, MetaTrader 5
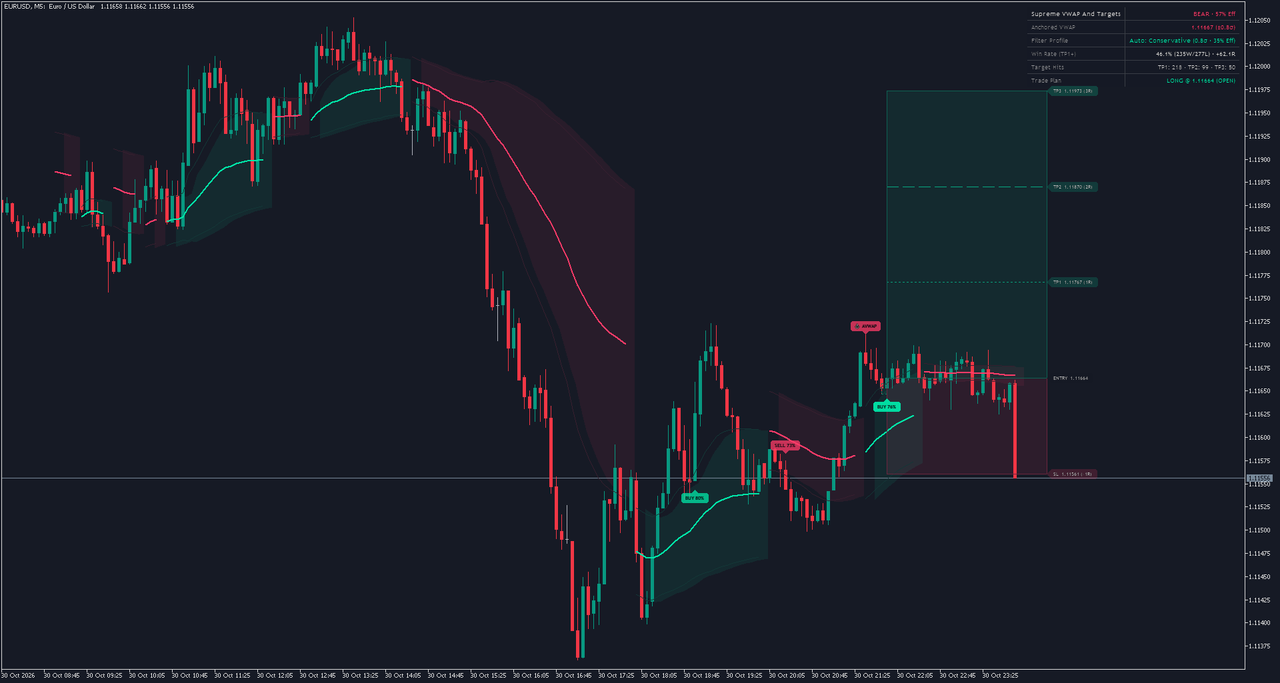
The newest badge is a BUY on the 21:55 bar of 30 October and reads BUY 76%. On M5 the same rules run on smaller swings, and a plan runs at most 60 bars, 5 hours here.
EURUSD H1, MetaTrader 4
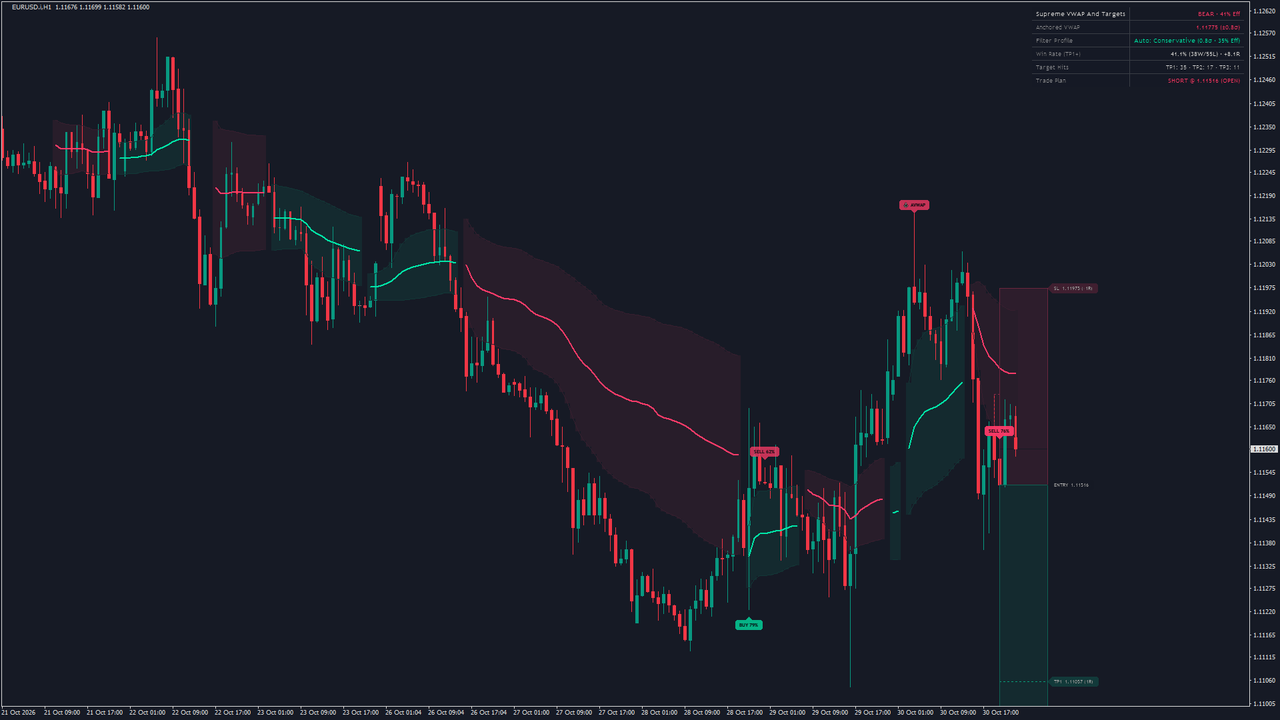
The newest badge is a SELL on the 20:00 bar of 30 October and reads SELL 76%. The MetaTrader 4 version on another broker's feed. Other candles and other tick volume give other anchors and signals, and Auto-Optimize can settle on another profile; the band's fill sits under the candles, which MetaTrader 4 draws again on top of it.
15. Alerts
Seven events can raise an alert, each with its own switch:
- a bullish entry (BUY) and a bearish entry (SELL), on by default;
- any entry, BUY or SELL, as one event (off by default; with it and alert 1 or 2 both on, a signal alerts twice);
- TP1, TP2 and TP3 reached by the plan of the profile on the chart;
- the stop hit before TP1. A stop at breakeven after TP1 sends no alert.
Four channels deliver them: the terminal's alert window (on by default), a sound with a file of your choice, a push notification to the MetaTrader app on your phone, and e-mail; push and e-mail use the terminal's own settings (Tools, Options, Notifications and Email). Every alert is evaluated on a closed bar and fires once for that bar. Nothing fires while the indicator calculates the chart's history, and nothing fires in the Strategy Tester. A BUY alert reads:
Supreme VWAP And Targets: Confirmed Bullish Anchored VWAP Pullback Reclaim on EURUSD (H1). Entry, SL, and TP1-TP3 trade plan active.
16. What It Does Not Do
- It does not place trades. It draws and alerts; you place and manage every order.
- It does not promise a result. Its record of closed plans describes this chart's history, not a probability.
- It does not see the future. A swing is confirmed 10 bars after it forms. Nothing is decided on the forming bar: there only the dashboard's efficiency figure follows price, while the band and the open plan extend to it.
- It does not hold one profile by itself. A signal never changes after its bar closes, but Auto-Optimize can switch the profile on the chart, and another Bars to calculate, or another broker's history, gives other records.
Use the plan as the starting point of your own decision, test it on a demo account first, and keep a journal of the plans you take.
Risk Disclaimer
Trading leveraged products such as forex and CFDs carries a high level of risk and may not be suitable for all investors. You could lose more than your initial deposit. Supreme VWAP And Targets is an analysis tool, not financial advice; past signals do not guarantee future results. Test it on a demo account before trading real money.