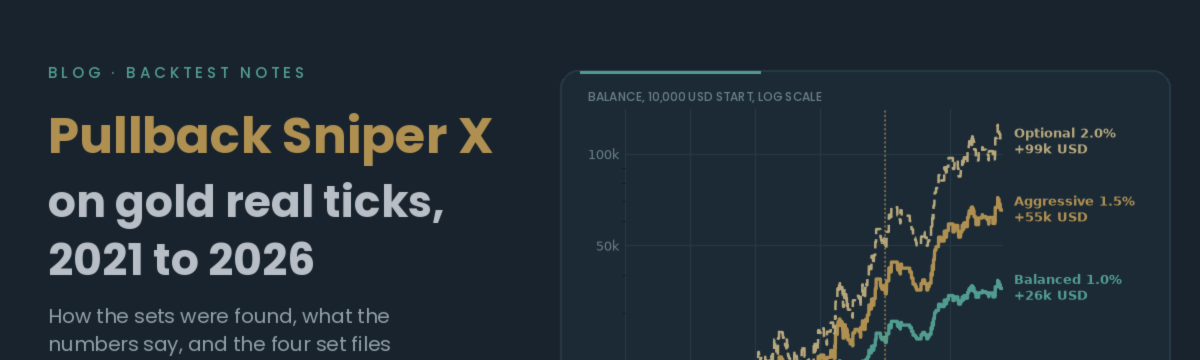
Pullback Sniper X on Gold Real Ticks (2021-2026): How I Tested It and the Four Sets I Use

I wanted to write down which settings I use for Pullback Sniper X on XAUUSD H1 and how I got to them. So here is the whole story: the data, the search, what did not work, the numbers for the four sets, and the set files themselves (attached at the end of this post). Everything below is a backtest in the MetaTrader 5 Strategy Tester. It is simulated, not live trading, so please read the caveats too.
The test setup
- Data: Dukascopy XAUUSD tick history, imported into MT5 as a custom symbol. The tester reported 99% real ticks.
- Period: 1 January 2021 to 23 October 2026, H1 chart.
- Account: 10,000 USD start, leverage 1:100.
- Position size: risk % per trade, calculated from the current balance. So the lot grows as the account grows and shrinks after losses (compounding).
- Models: the searches ran on "1 minute OHLC" because it is fast. Every finalist was then re-run on "Every tick based on real ticks". The real-tick results came out roughly 5 to 10% below the 1-minute ones, and all numbers in this post are the real-tick ones.
- In-sample / forward split: the optimiser only saw 2021 to 2024. The period from 1 January 2025 to 23 October 2026 was kept apart as a forward test on data it had never seen.
For reference, the default inputs did not do well on this data: about -1,232 USD, profit factor 0.97, 27.9% drawdown over 3,909 trades (1-minute OHLC). That is the honest starting point, and the reason the search was needed at all.
Round 1: finding a stable family
The first genetic optimisation covered 14 inputs and ran 5,418 passes. A second, narrower run around the best area added 3,683 passes. A clear pattern came out of it: VWAP filter on, trading only in a morning-to-midday window (roughly 7 to 9h until 14h server time), trailing stop off, stop loss around 2.75 to 3 ATR.
I took four candidates and did a neighbour sweep on each: every input moved two steps up and two steps down, one at a time. I only want settings that sit on a plateau, not on a spike. All neighbours stayed profitable in both periods, without sudden jumps. The survivors were then checked on real ticks.
Round 2: trying harder for more profit
Then I wanted to see if there was something clearly more profitable. Round 2 opened the ranges much wider: trailing on/off with a 1 to 3 ATR trail, reward:risk 1 to 3, stop 1.5 to 4 ATR, up to 6 trades, any session window or none, VWAP on/off, EMA filter 50 to 400 and trigger 10 to 100, slope lookback 5 to 40. Two genetic runs with two different goals (maximum balance, and maximum recovery factor) gave 5,002 and 9,235 passes. Together with round 1 that is roughly 23,000 combinations.
Two new families looked good at first. Both passed their neighbour sweeps and were profitable in the forward period. But when I compared them with round 1 at the same drawdown, neither one was better:
| At about the same drawdown | Net profit | Max equity DD | Trades | 2021 |
|---|---|---|---|---|
| Round 1 set C at 1.0% risk | +26,016 | 11.25% | 586 | +374 |
| Round 2 family F at 0.35% risk | +16,654 | 11.14% | 1,361 | -1,169 |
| Round 2 family E at 0.25% risk | +14,703 | 10.62% | 1,804 | -403 |
Their extra profit came only from more exposure (up to 6 trades, reward:risk near 2.9), and both lost money in 2021. Trailing was never selected in any of the good results. So I kept the round 1 strategies, and got more profit the simple way: by raising the risk on set C, which had the best profit per unit of drawdown and was positive in every year.
Fixed lots or compounding?
The Expert Advisor already compounds when you use risk %: the lot is sized from the current balance (on set C at 1%, the risk per trade stayed near 1% while the account grew from 10k to about 33k). For a fixed lot you set InpRiskPercent to 0 and the EA uses InpFixedLot.
I tested both on the same strategies:
| Set C | Net profit | PF | Max equity DD | Net / DD |
|---|---|---|---|---|
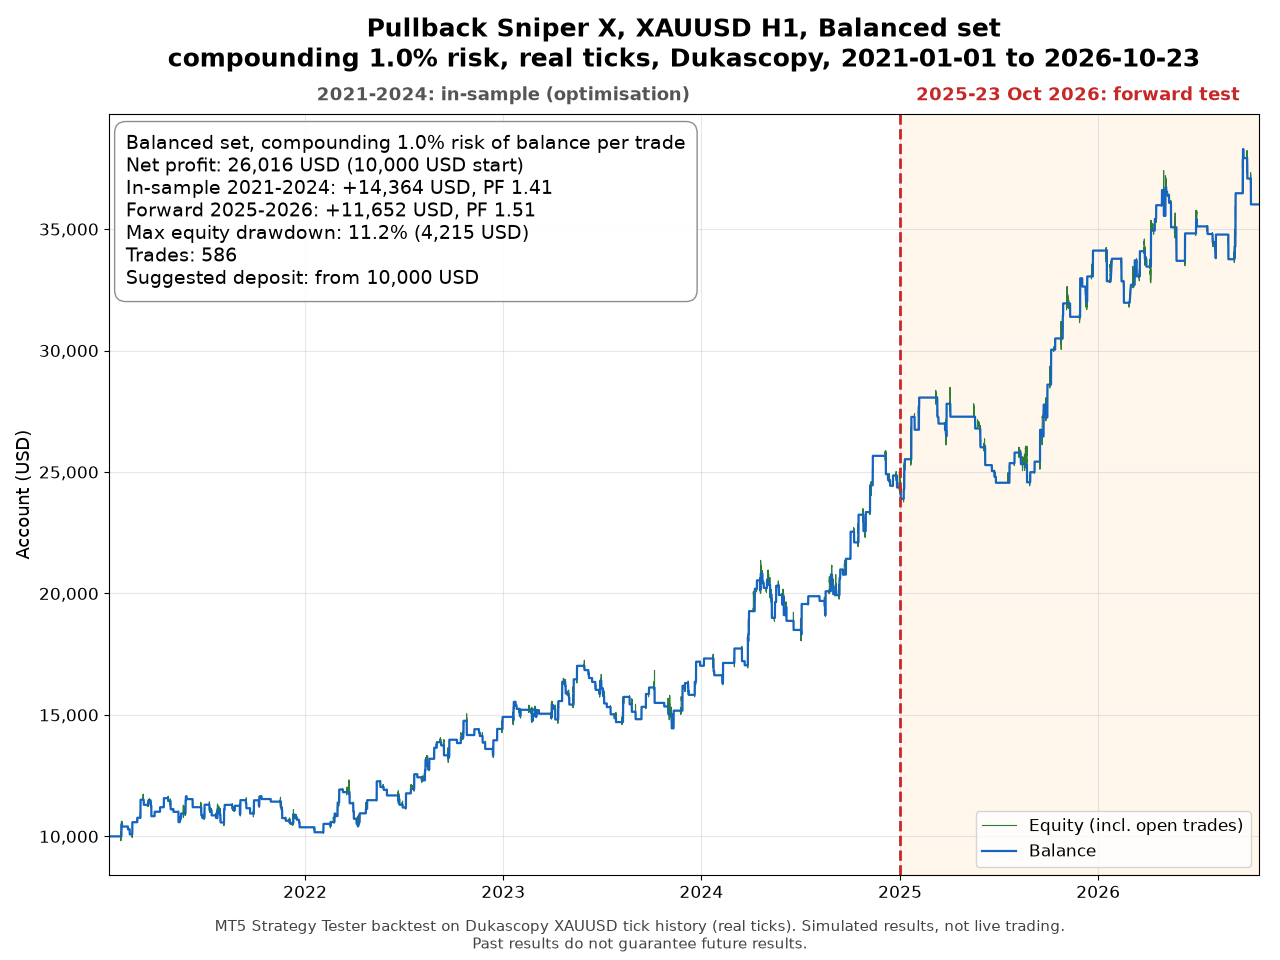
| Compounding 1.0% | +26,016 | 1.45 | 11.25% (4,215 USD) | 6.17 |
| Fixed 0.07 lot | +20,541 | 1.48 | 16.98% (4,700 USD) | 4.37 |
| Fixed 0.10 lot | +29,344 | 1.48 | 19.04% (6,714 USD) | 4.37 |
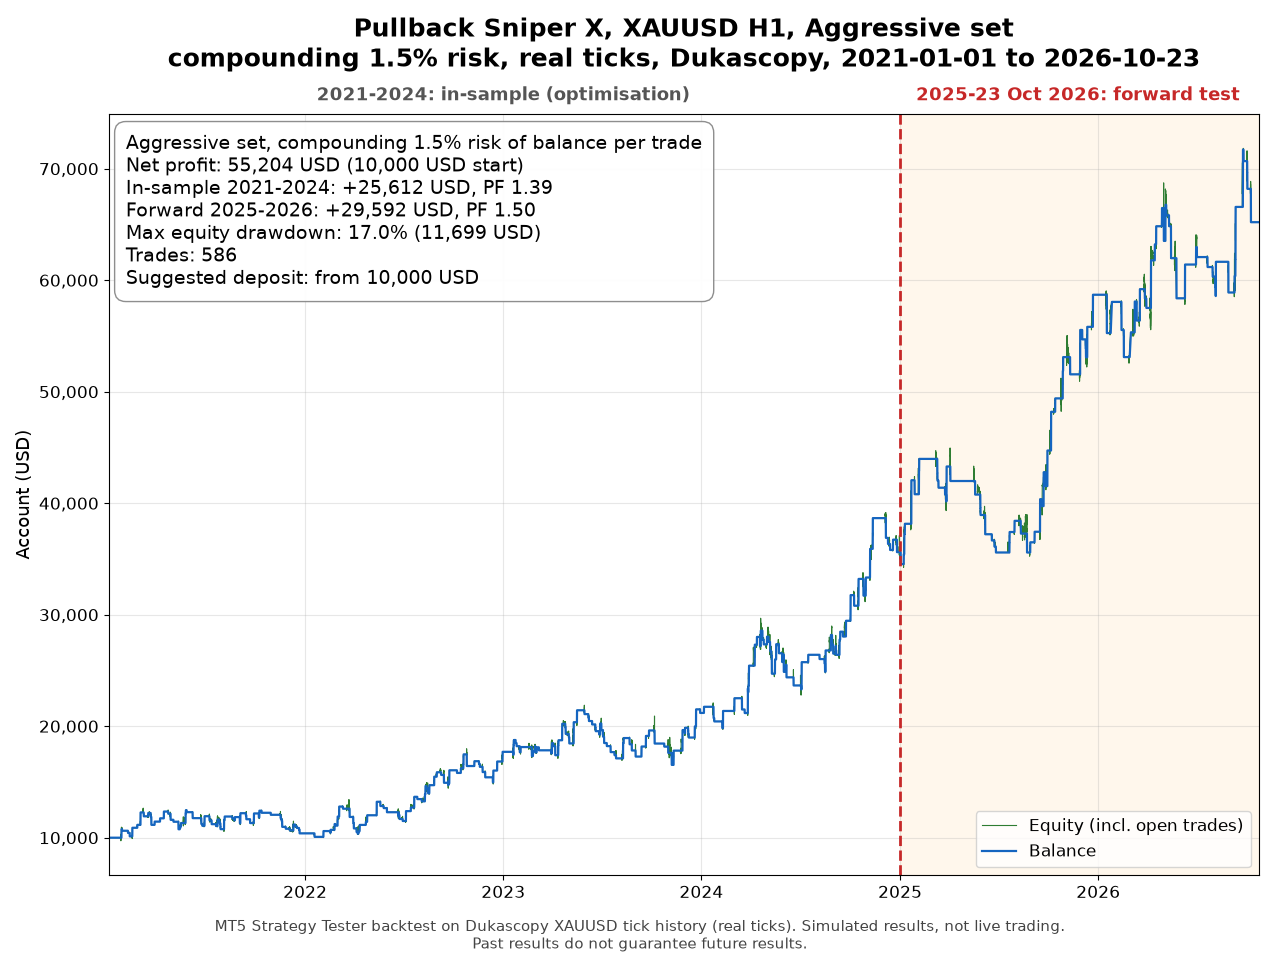
| Compounding 1.5% | +55,204 | 1.44 | 16.99% (11,699 USD) | 4.72 |
| Fixed 0.14 lot | +41,083 | 1.48 | 20.72% (9,400 USD) | 4.37 |
Compounding gave more profit per unit of drawdown for every strategy I tried (sets A and B, and the round 2 families too). The reason is simple: gold was around 1,800 in 2021 and around 4,000 now, so the same stop in ATR is worth far more dollars today. A fixed lot that looks reasonable now over-risks a small account in 2021 and 2022, and that is where most of its drawdown came from. With compounding the drawdown in dollars is larger near the end of the test, but only because the account is larger by then (on 1.5%, 11.7k USD of drawdown on an account of about 65k).
The four sets
All four use compounding risk %. Conservative is round 1 set A. The other three are the same set C with a different risk.
| Set | Risk | Net profit | PF | Max equity DD | Trades | 2021-2024 | 2025-2026 |
|---|---|---|---|---|---|---|---|
| Conservative (A) | 0.5% | +4,554 | 1.53 | 4.87% (608) | 396 | +3,494, PF 1.53 | +1,060, PF 1.52 |
| Balanced (C) | 1.0% | +26,016 | 1.45 | 11.25% (4,215) | 586 | +14,364, PF 1.41 | +11,652, PF 1.51 |
| Aggressive (C) | 1.5% | +55,204 | 1.44 | 16.99% (11,699) | 586 | +25,612, PF 1.39 | +29,592, PF 1.50 |
| Optional (C) | 2.0% | +99,172 | 1.42 | 22.51% (26,818) | 586 | +40,538, PF 1.39 | +58,634, PF 1.45 |
Net profit per year in USD (10,000 USD start, 2026 until 23 October):
| Set | 2021 | 2022 | 2023 | 2024 | 2025 | 2026 |
|---|---|---|---|---|---|---|
| Conservative 0.5% | +798 | +1,279 | +908 | +509 | +1,010 | +50 |
| Balanced 1.0% | +374 | +4,544 | +2,109 | +7,337 | +9,753 | +1,900 |
| Aggressive 1.5% | +388 | +7,314 | +3,489 | +14,421 | +23,087 | +6,505 |
| Optional 2.0% | +332 | +10,265 | +5,121 | +24,820 | +46,206 | +12,428 |

Conservative set (0.5% risk), real ticks 2021-2026
Balanced set (1.0% risk), real ticks 2021-2026
Aggressive set (1.5% risk), real ticks 2021-2026

Aggressive 2% set (2.0% risk), real ticks 2021-2026
The main inputs (everything else is at its default):
- Conservative (A): InpMaxTrades 2, InpEMAFilterPeriod 150, InpEMATriggerPeriod 50, InpSlopeLookbackBars 10, InpATR_SL_Mult 2.75, InpRR 1.00, InpUseVWAPFilter true, session filter on from 9 to 14 (server time), InpUseTrailing false, InpRiskPercent 0.5.
- Balanced, Aggressive and Optional (C): InpMaxTrades 4, InpEMAFilterPeriod 200, InpEMATriggerPeriod 40, InpSlopeLookbackBars 15, InpATR_SL_Mult 3.00, InpRR 1.75, InpUseVWAPFilter true, session filter on from 8 to 14 (server time), InpUseTrailing false, InpRiskPercent 1.0, 1.5 or 2.0.
Deposits I would start with: 15,000 USD for Conservative, 10,000 USD for the others. At today's gold price a 0.01 lot already risks about 35 to 70 USD per trade with these stops. On a smaller account InpAllowMinLotOverRisk (true in the sets) means the EA will still open 0.01 lot, so the real risk per trade will be higher than the % you set.
How to load the sets
- Download the .set file you want from the attachments at the end of this post.
- Open an XAUUSD H1 chart and attach Pullback Sniper X.
- In the inputs window click "Load" and pick the .set file you want. In the Strategy Tester it works the same way: Inputs tab, right click, Load.
- Check the session hours against your broker's server time (see below) and adjust InpSessionStartHour and InpSessionEndHour if needed.
- Run it in the tester with your broker's data first, then on a demo account.
Caveats, please read these
- Drawdown on the bigger sets. Aggressive 1.5% had 17% max equity drawdown and Optional 2% had 22.5%. These do not fit typical prop-firm limits. Balanced at 11.25% is also above a 10% maximum-loss rule. Only Conservative stays well inside.
- Most of the profit came in 2024 and 2025. 2021 was close to flat for set C, and 2026 so far is modest for Conservative (+50 USD). Gold rose strongly over the whole period, and the trend helped.
- Session hours are server time of the Dukascopy feed. If your broker uses a different GMT offset, shift the hours. This matters, because the edge depends on that morning-to-midday window.
- No commission or extra slippage was modelled. Only the spread in the Dukascopy bid/ask data. Your broker's spread, commission and fills will change the results.
- Optimisation always contains some luck. The forward period, the neighbour sweeps and the real-tick checks reduce that, but they cannot remove it.
- Past results do not guarantee future results. This is a backtest on historical data, not a promise of anything.
Files
The four .set files (Conservative, Balanced, Aggressive and the optional 2% version) are attached below as separate files. If you already use Pullback Sniper X, the product page has the same results and charts. Questions, or your own test results with a different broker, are very welcome in the comments.