The number you'll never see: why every published return is a ceiling

Every return printed on a product page or a signal page was measured under the best conditions its publisher had: their price feed, their fills, their window of history. That is not a trick. It is simply where the number comes from. But it means the published figure is a ceiling for your account, not a forecast of it.
This post walks through the three gaps between the number on a page and the number in an account, using our own pages as the example, read this morning.
Gap one: your broker's prices are not the publisher's
A backtest runs on one broker's price history. Spreads, gaps in the quotes and even the hours a symbol trades differ from server to server, and a robot's entries depend on all three.
Our Bitcoin Interval page shows what that does. Its headline, 28.3% a year over 2020 to 2026 in the Strategy Tester, comes from one raw-spread server. The same file was then measured on four more brokers' data, each compared on the window both feeds actually cover. On those four the return lands 12 to 34 percent below the reference feed, while the profit factor stays between 1.44 and 1.51.
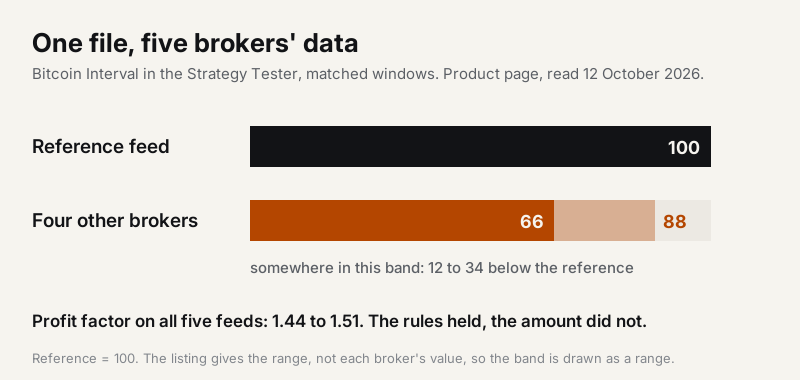
Read that carefully. The rules held on every feed: the profit factor barely moved. The amount did not hold. A buyer on any of those four brokers would have seen a smaller number than the one at the top of the page, from the same file, over the same years.
Gap two: your fills are not the provider's
On a live signal the record is made of the provider's own executions. A copy is filled a moment later, at another broker, at that broker's price. Every MQL5 signal page has a Slippage tab for exactly this. On our flagship account this morning it lists 16 broker servers that subscribers copied on. Nine of them average 0.00 pips. The rest run from 0.43 to 28.64. The page's record is the provider's fills. Your result will be made of yours.
Gap three: the future is not the window
A backtest describes fixed rules on prices that already happened. The Bitcoin Interval page splits its window in half before measuring: 29.4% a year in the first half against 26.0% in the second, with the worst drawdown 11.52% against 16.42%. Same rules, two paths through history, two sets of numbers. Your account will walk a third path, and nobody can print its number in advance.
What to read instead
The headline tells you how well it has gone under good conditions. Three other questions tell you whether you can live with it.
1. How often does it fail? Bitcoin Interval closes 47.1% of its trades in profit, by design. Fewer than half. If you expect most weeks to be green, the first month will feel like a defect.
2. How deep is the worst drawdown, and on how many paths? The 16.77% on the page is the deepest on one path, and the page itself says another path gives another number. Plan for more than the printed figure, not exactly it.
3. Can you sit through it? Only you can answer this one, and it decides more of your result than the headline does. The moment you will most want to switch a system off is in a drawdown, which is the one moment switching off locks in the loss and skips whatever comes after.
The check that closes the gap
Run the free demo of any EA in the Strategy Tester on your own broker's data, over the same years as the page. The result is still a backtest, but it is your feed, and it is a much closer ceiling than the publisher's. If it lands well below the page, you have learned that before you paid for anything.
The headline number tells you how well it can go. The failure rate and the drawdown tell you whether you can live with it. The first is hope. The second is a plan.
The figures in this post come from the product page of Bitcoin Interval on MQL5, where each of them is published next to its caveat: Bitcoin Interval. Past results, ours included, do not predict future ones.


![[EURUSD]: Weekly Liquidity Activation Points (LAP), October 12-16, 2026](https://c.mql5.com/6/1035/splash-preview-777305.png "[EURUSD]: Weekly Liquidity Activation Points (LAP), October 12-16, 2026")
![[Nasdaq]: Weekly Liquidity Activation Points (LAP), October 12-16, 2026](https://c.mql5.com/6/1035/splash-preview-777311.png "[Nasdaq]: Weekly Liquidity Activation Points (LAP), October 12-16, 2026")
![[XAGUSD]: Weekly Liquidity Activation Points (LAP), October 12-16, 2026](https://c.mql5.com/6/1035/splash-preview-777308.png "[XAGUSD]: Weekly Liquidity Activation Points (LAP), October 12-16, 2026")