

Whenever I add another EA to a portfolio, I want to answer two questions:
How well can this strategy perform?
And just as importantly, when can it lose at the same time as the strategies I already use?
Evaluating one EA is relatively straightforward. We can look at return, maximum drawdown, backtests, and trading records.
But once several EAs are running together, the question changes.
A portfolio can contain many individually strong strategies and still experience concentrated losses if those strategies react similarly to the same market conditions.
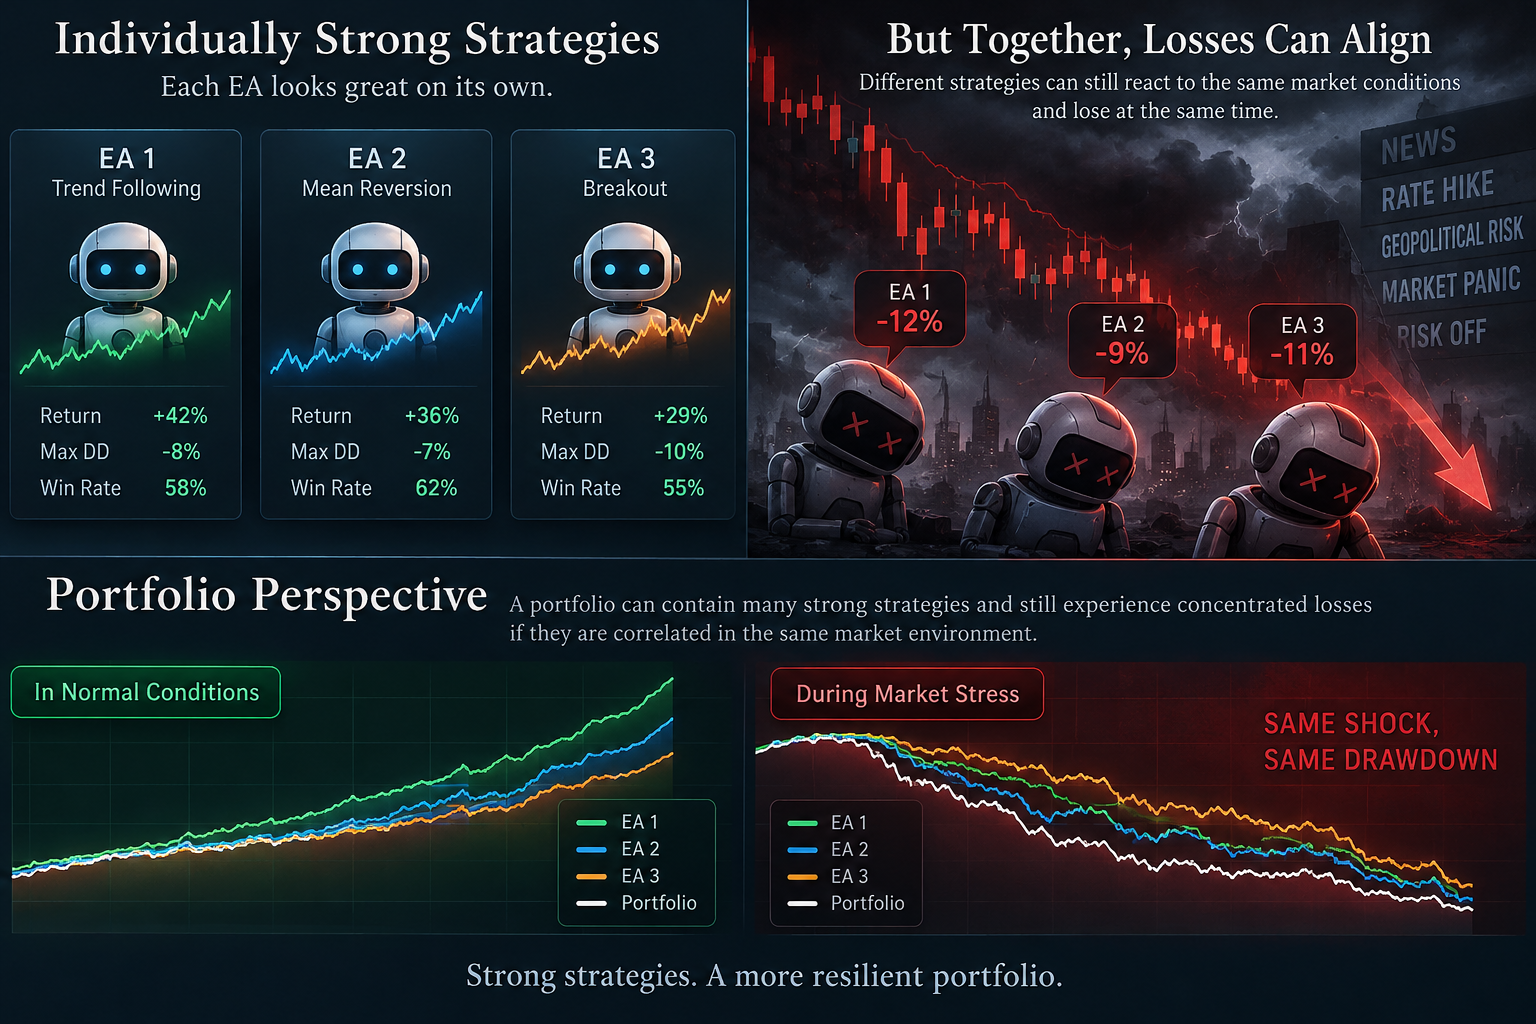
Project No Gold began with that problem.
The goal was not simply to trade more markets. It was to operate different trading patterns inside one framework while making portfolio-level risk easier to evaluate.
Why “Project No Gold”?
Gold is one of the most common markets in automated trading.
There are many ways to trade XAUUSD, and different entry, exit, stop-loss, and holding rules can produce very different strategies.
But good trading opportunities do not exist only in Gold.
Project No Gold expands that search beyond Gold.
PNG currently operates strategies across six markets:
| Market | Reference Symbol |
|---|---|
| US Dollar / Japanese Yen | USDJPY |
| Silver | XAGUSD |
| US Technology Index | USTEC |
| US 500 Index | US500 |
| Japan 225 Index | JP225 |
| Germany 40 Index | DE40 |
Actual symbol names may differ between brokers.
If you already run Gold EAs, PNG can be tested alongside them as another source of strategy exposure. If you are new to automated trading, it also provides a way to manage several markets from one EA.
However, different symbols do not automatically mean diversification.
What matters is whether the strategies actually behave differently.
The Frontier Engine
The trading logic inside PNG is organized under the Frontier Engine.
Its strategies broadly look for two types of market behavior.
SURGE
SURGE looks for price movement that has become sufficiently strong relative to normal market volatility.
In simple terms:
“Has price moved strongly enough to satisfy this strategy’s entry conditions?”
RIFT
RIFT focuses on predefined price boundaries derived from previous market structure.
Its question is:
“Has price reached the level this strategy has been waiting for?”
Each strategy uses its own timing, stop-loss, take-profit, and exit logic.
The strategies are then operated through a common execution and position-sizing framework.
33 Strategies Across 6 Markets
PNG currently contains 33 strategies.
| Symbol | Strategies |
|---|---|
| USDJPY | 9 |
| USTEC | 7 |
| US500 | 5 |
| JP225 | 5 |
| XAGUSD | 5 |
| DE40 | 2 |
| Total | 33 |
The user does not need to manage 33 separate EA instances.
Instead, the main decisions are simpler:
- which markets to enable,
- how broker symbols should be mapped,
- and how much trading size should be assigned to each market.
But strategy count alone says very little about diversification.
What matters is how those strategies behave together.
Correlation Matters More Than Strategy Count
For the current historical analysis, I compared all 528 unique strategy pairs using daily realized net P/L.
Three numbers summarize the result:
- 92.6% of all pairs have an absolute correlation of |ρ| < 0.20
- The average absolute correlation is 0.058
- The highest pairwise correlation is 0.683
Most strategy pairs therefore show relatively low linear co-movement, while a small number of stronger relationships remain.
[ PNG 33-Strategy Correlation Matrix ]
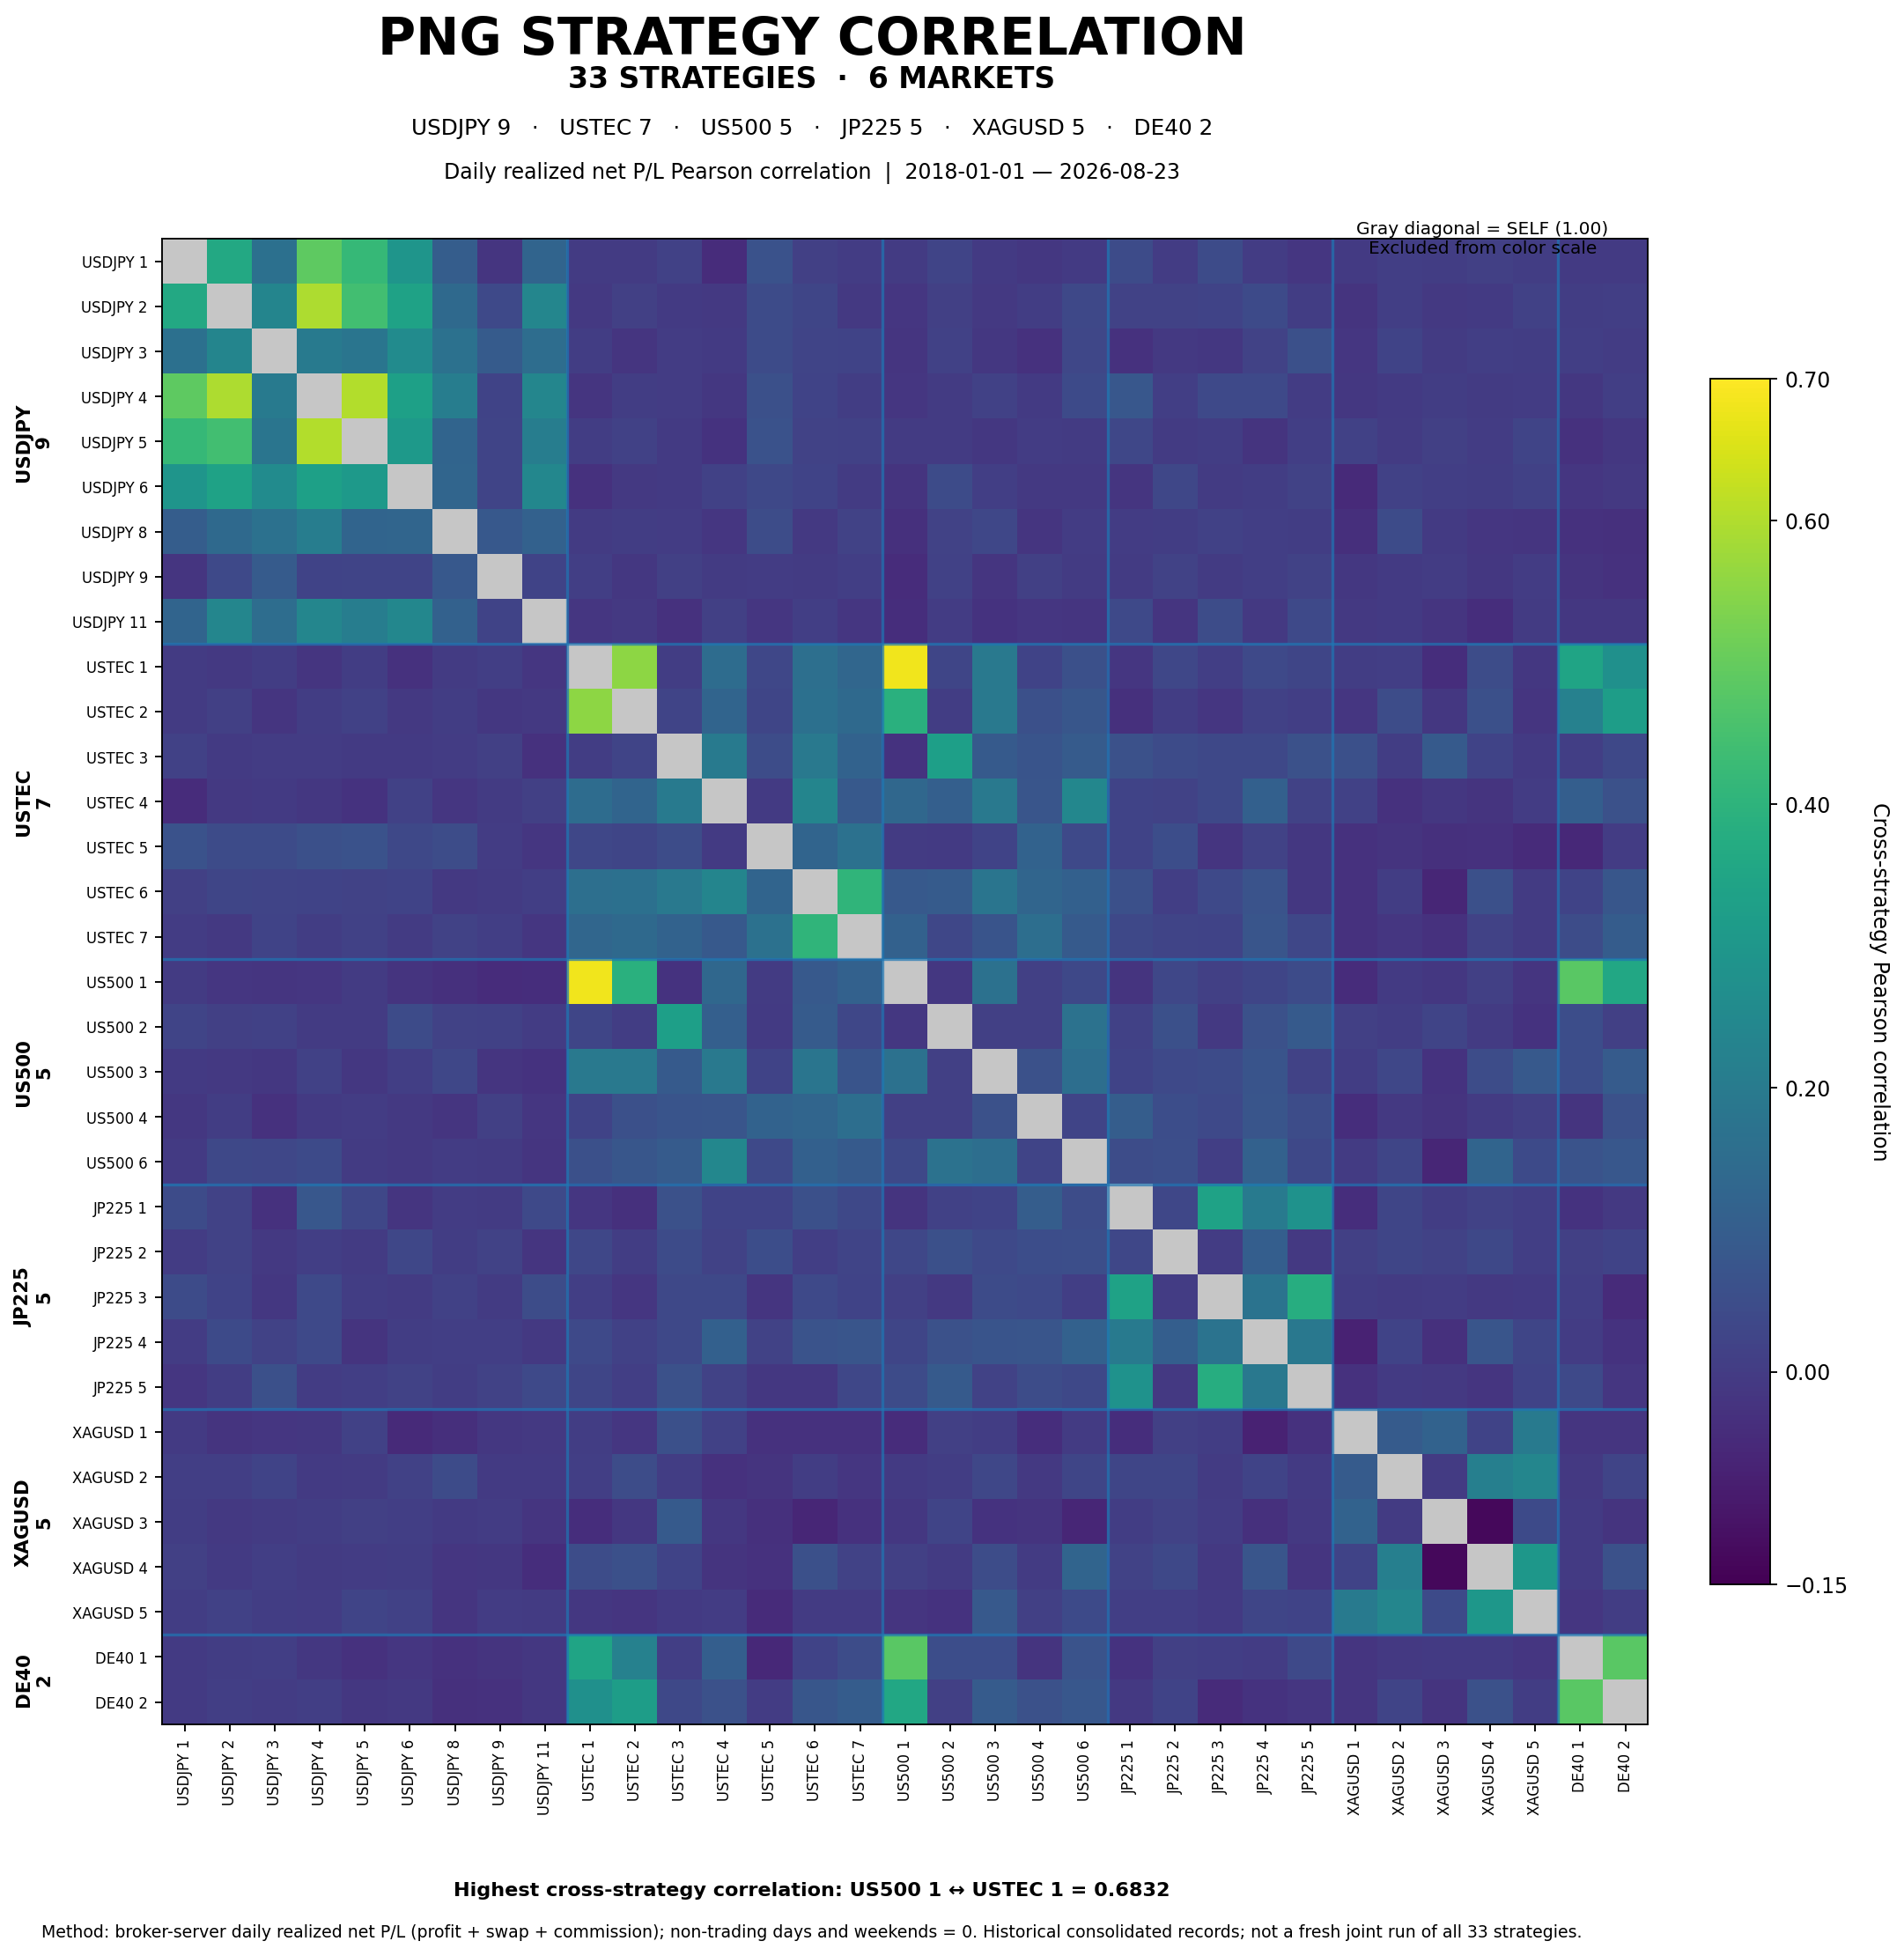
33 strategies · 6 markets · 528 unique strategy pairs
Daily realized net P/L Pearson correlation, 2018–2026.
This is why I prefer to measure diversification rather than assume it.
Two strategies can trade different symbols and still react similarly to the same market environment. On the other hand, strategies trading the same market can sometimes behave quite differently.
Comparing PNG With Other EAs
The same idea also applies outside PNG itself.
I compare PNG with other strategies already used in a portfolio, including both non-Gold systems and Gold EAs.
[ PNG vs. Other EA Correlation Matrix ]
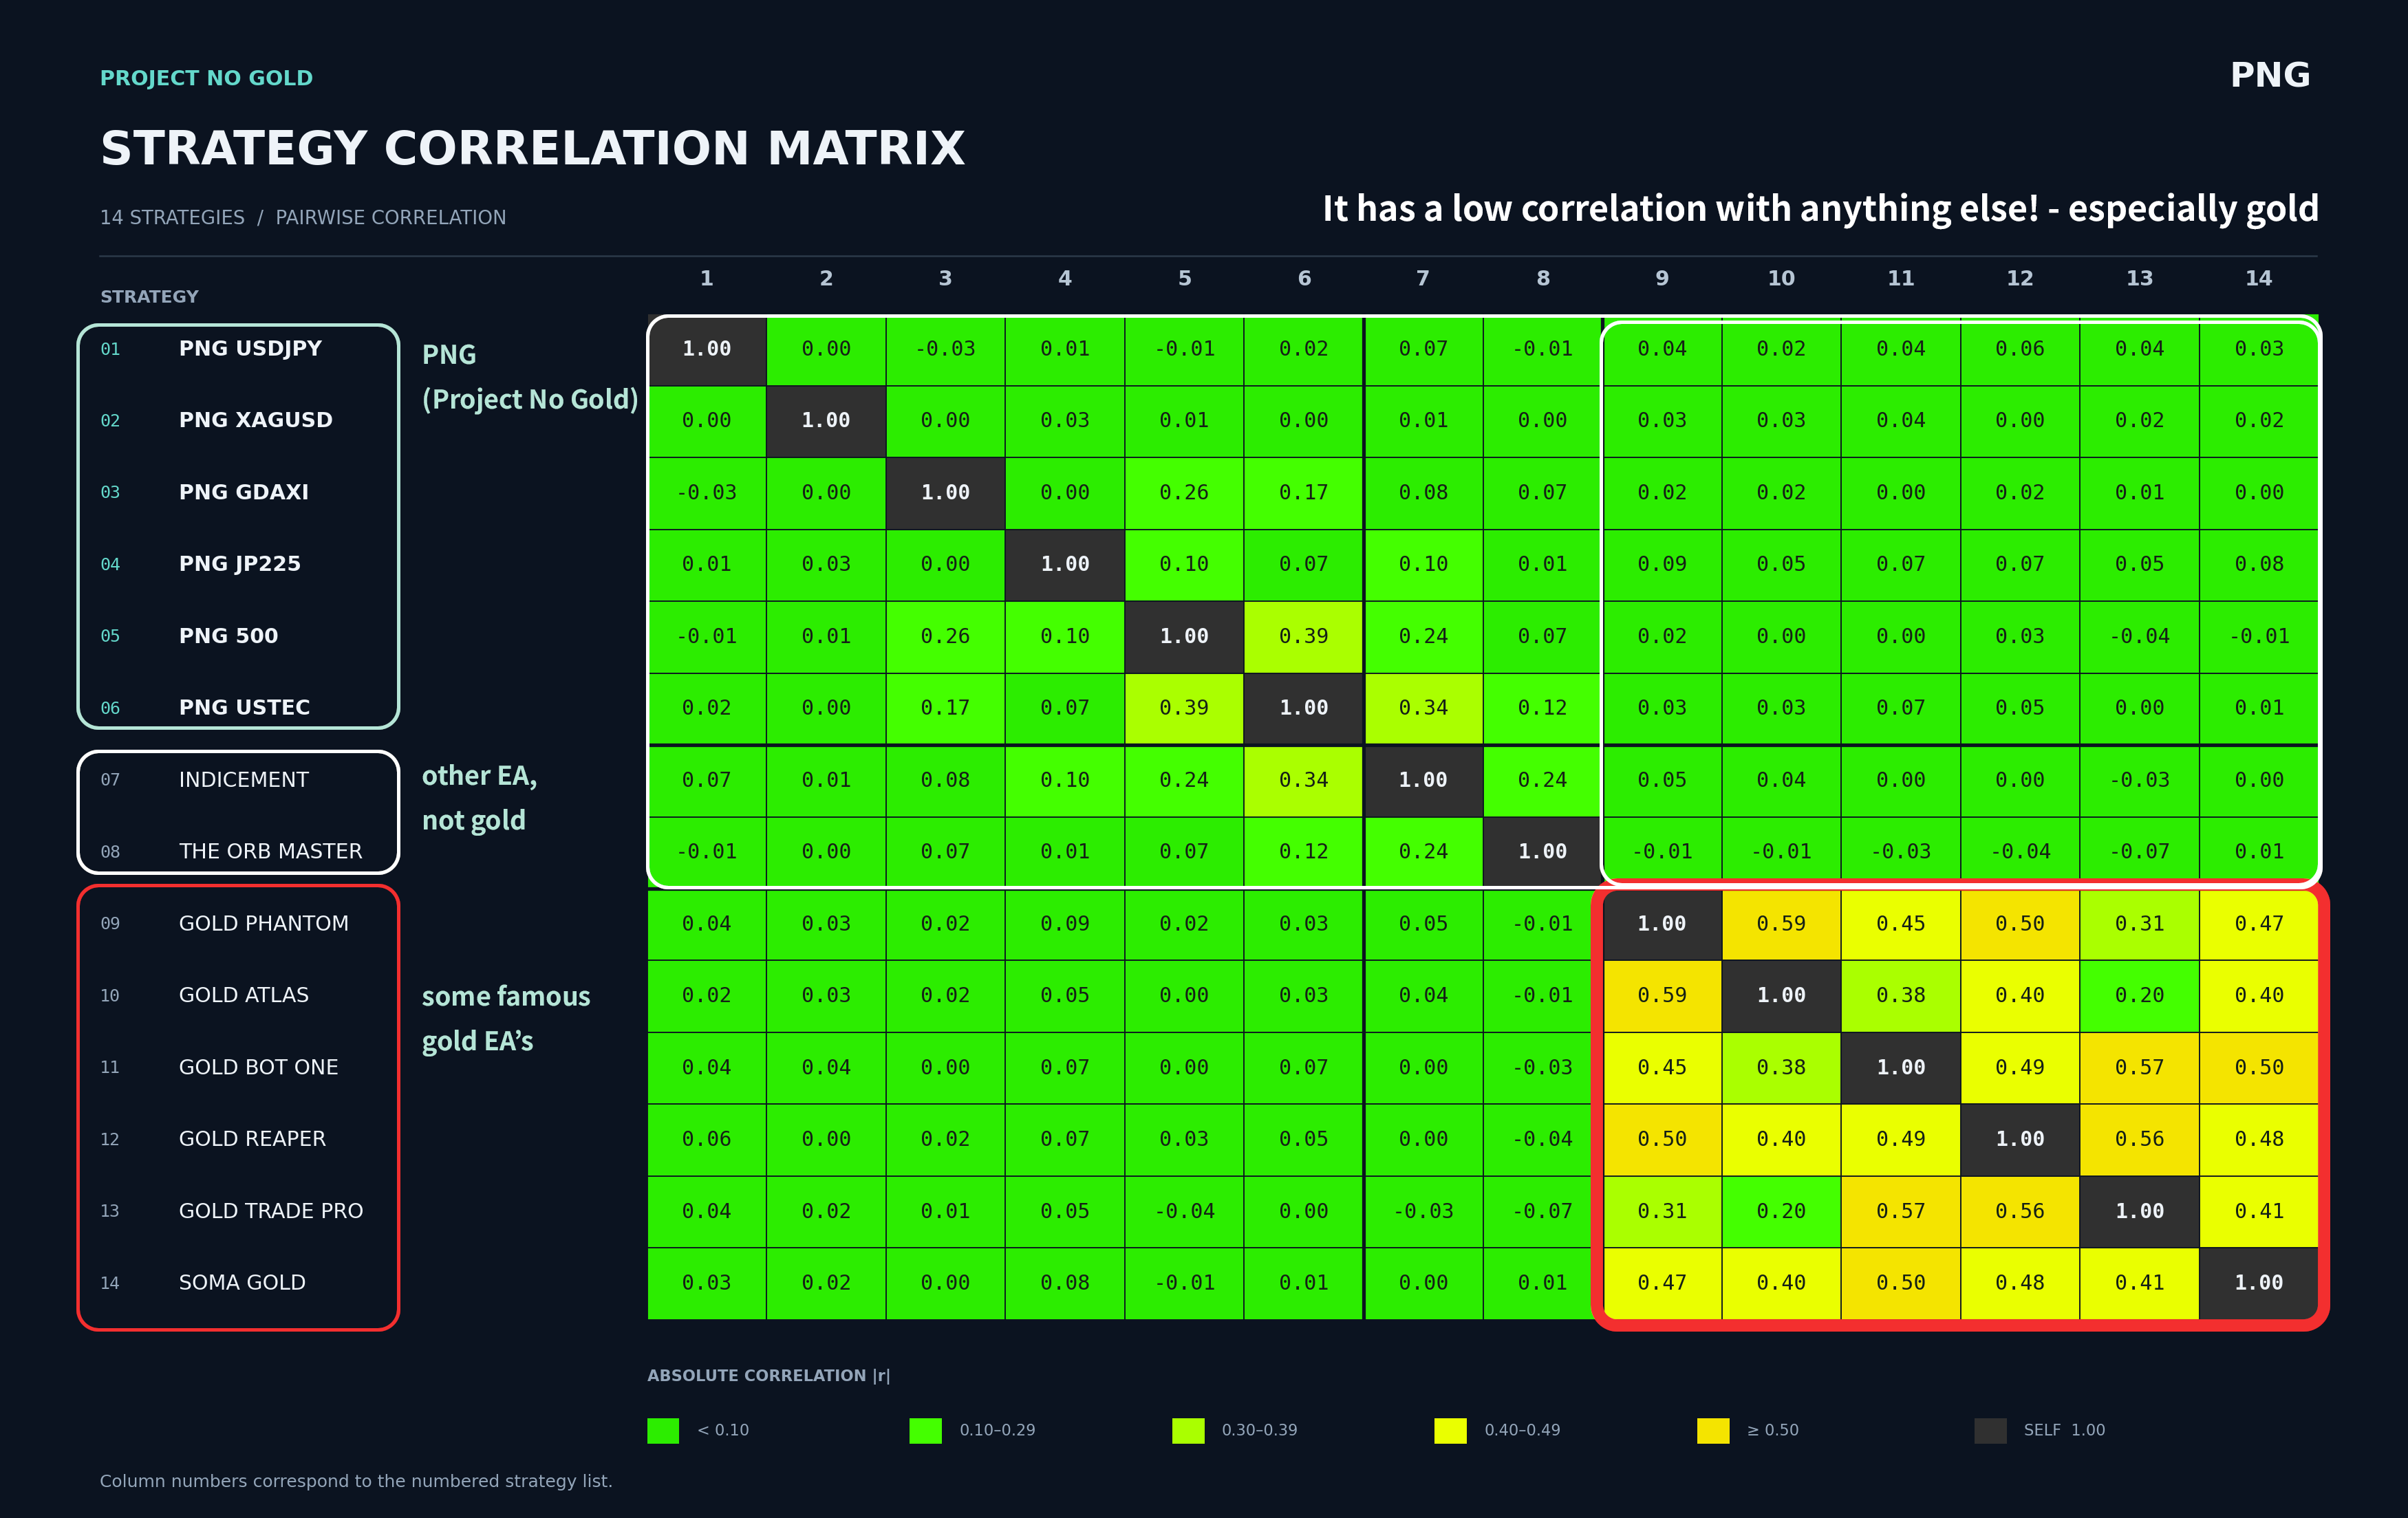
The purpose is not to claim that low historical correlation guarantees lower future drawdown.
It does not.
Correlation can change over time, and portfolio risk also depends on overlapping losses, position sizing, margin usage, and market exposure.
Correlation is simply one part of the evaluation.
Diversification should be measured, not assumed.
What Does the User Configure?
For normal operation, PNG mainly requires three decisions.
1. Select the markets
You do not need to enable all six markets.
The selection can depend on account size, existing EAs, and the type of market exposure you want.
2. Map broker symbols
The same market can have different symbol names across brokers.
For example, a technology index may appear as USTEC, NAS100, or another broker-specific name.
PNG therefore allows each reference market to be connected to the actual symbol available in the MT5 terminal.
3. Choose position sizing
PNG provides two main approaches:
DD Target scales trading size using the relationship between historical drawdown and position size.
Fixed Lot applies the requested lot size to each active strategy within that market.
DD Target should not be interpreted as a guarantee that future drawdown will remain below the selected value.
Actual results can differ because of market conditions and broker specifications.
One Chart Mode
PNG can operate multiple enabled markets from a single EA instance through One Chart Mode.
When USDJPY is enabled, I recommend using a USDJPY H1 chart as the host chart.
The H1 timeframe is only the host display timeframe. Individual strategies continue to use their own internal timing conditions.
This reduces the need to maintain separate charts and EA instances for every strategy.
Start With Backtesting
Before live trading, the first step is to confirm that PNG behaves as expected under your own broker and account conditions.
Contract size, minimum lot, spread, commission, margin requirements, and price data can all affect the result.
The first backtest is therefore not only about finding a good equity curve.
It is also about confirming that the intended trading size and risk are being applied correctly.
In the next article, I will go through the recommended PNG backtesting workflow step by step, from the first configuration check to final validation.
The Idea Behind Project No Gold
Project No Gold was not built simply to increase the number of trades or markets.
The idea is to combine different markets, different trading patterns, and multiple strategies inside one operating framework, while making it easier to evaluate how those strategies affect the portfolio as a whole.
Individual strategy performance still matters.
But once several strategies are running together, the more important question becomes:
What changes when they are combined?
That is the question Project No Gold was designed to explore.
The next step is to verify how that framework behaves under your own broker and account conditions. In the next article, we will begin with the PNG backtesting workflow.


![[EURUSD]: Weekly Liquidity Activation Points (LAP), October 12-16, 2026](https://c.mql5.com/6/1035/splash-preview-777305.png "[EURUSD]: Weekly Liquidity Activation Points (LAP), October 12-16, 2026")
![[Nasdaq]: Weekly Liquidity Activation Points (LAP), October 12-16, 2026](https://c.mql5.com/6/1035/splash-preview-777311.png "[Nasdaq]: Weekly Liquidity Activation Points (LAP), October 12-16, 2026")
![[XAGUSD]: Weekly Liquidity Activation Points (LAP), October 12-16, 2026](https://c.mql5.com/6/1035/splash-preview-777308.png "[XAGUSD]: Weekly Liquidity Activation Points (LAP), October 12-16, 2026")