
How to Read Buy and Sell Signals, Divergence, and Overbought and Oversold Levels

What Is the Stochastic Oscillator?
How to Read Buy and Sell Signals, Divergence, and Overbought and Oversold Levels
In Forex, gold, and other financial markets, identifying the right time to enter or exit a trade is one of the biggest challenges traders face. Sometimes, price begins to pull back after a strong bullish move. In other situations, selling pressure gradually weakens after several bearish candles. But how can traders recognize when market momentum may be changing?
The Stochastic Oscillator is a popular technical analysis indicator that compares the current closing price with its recent price range. It helps traders identify overbought and oversold conditions, analyze momentum, and recognize potential market reversal opportunities.
In this guide, we will explain how the Stochastic Oscillator works, explore the standard settings, examine buy and sell signals, discuss Stochastic divergence, and show how to combine it with other indicators such as RSI, MACD, and Bollinger Bands.
What Is the Stochastic Oscillator and How Does It Work?
The Stochastic Oscillator is a momentum indicator developed by George Lane. It compares the current closing price with the highest and lowest prices over a specified period, displaying its readings on a scale from 0 to 100.
The underlying concept is simple: during an uptrend, prices often close near the upper end of their recent range. During a downtrend, prices frequently close near the lower end. Changes in this behavior may provide clues about shifts in market momentum.
The Stochastic Oscillator helps traders evaluate these changes, but it does not predict future price movements with certainty.
Available on MetaTrader 4 and MetaTrader 5, the indicator can be used to analyze currency pairs, gold, and other financial instruments.
Understanding the %K and %D Lines
The Stochastic Oscillator typically consists of two lines. Understanding how they interact is essential for interpreting its trading signals.
The %K Line: The Fast Stochastic Line
The %K line measures the current closing price relative to the highest high and lowest low over a selected period.
Its standard formula is:
%K = 100 × (Close − Lowest Low) ÷ (Highest High − Lowest Low)
Here, Close represents the current closing price, Lowest Low is the lowest price during the selected period, and Highest High is the highest price during that period.
The %K line responds relatively quickly to price changes, making it useful for monitoring short-term momentum.
The %D Line: The Signal Line
The %D line is generally a moving average of %K. It smooths short-term fluctuations and helps traders identify potential crossover signals.
When %K crosses above %D, bullish momentum may be strengthening. When %K crosses below %D, bullish momentum may be weakening.
However, crossovers should not be interpreted in isolation. The prevailing trend, price structure, and location of the signal all influence its potential significance.
Best Stochastic Oscillator Settings for Forex Trading
The most widely used default setting is 14, 3, 3. These values typically represent the %K calculation period, the slowing or smoothing period, and the %D moving-average period.
The most appropriate settings depend on your trading strategy and timeframe.
-
14, 3, 3: A practical starting point for general market analysis and many trading strategies.
-
Faster settings: May suit scalpers and lower timeframes, but they can generate more false signals.
-
Slower settings: Smooth out short-term fluctuations but may respond later to changes in market conditions.
There is no universally best setting for every instrument or market environment. Test your preferred configuration using historical data and a demo account before applying it to live trading.
How to Identify Overbought and Oversold Conditions
One of the main uses of the Stochastic Oscillator is identifying conditions in which the closing price consistently appears near an extreme of its recent trading range.
Overbought Zone: Above 80
When the Stochastic Oscillator rises above 80, the market is traditionally considered overbought. This indicates that recent closing prices have generally been near the upper end of their respective ranges.
Traders may interpret this as a warning that bullish momentum could weaken or that a bearish correction may develop.
However, overbought does not automatically mean sell. During a strong uptrend, the oscillator can remain above 80 for an extended period while the price continues to rise.
Oversold Zone: Below 20
When the oscillator falls below 20, the market is traditionally considered oversold. This may indicate sustained selling pressure and a potential reduction in bearish momentum.
Nevertheless, oversold conditions do not automatically create a buy opportunity. In a strong downtrend, prices can continue falling while the oscillator remains below 20.
A more disciplined approach is to treat these zones as early warnings and wait for additional confirmation before entering a trade.
How to Trade Stochastic Buy and Sell Signals
One popular strategy involves observing crossovers between the %K and %D lines when the oscillator enters an overbought or oversold zone.
Stochastic Buy Signal
A potential bullish signal occurs when both lines are below 20 and the %K line crosses above the %D line.
Before considering an entry, evaluate the following conditions:
-
Has the price reached a significant support level?
-
Is selling pressure weakening, or has a bullish reversal candle appeared?
-
Does the price structure support the possibility of an upward move?
When several independent factors align, the setup may deserve further consideration. However, no combination guarantees a profitable trade.
Stochastic Sell Signal
A potential bearish signal occurs when both lines are above 80 and the %K line crosses below the %D line.
Check whether the price is approaching a resistance level, forming lower short-term highs, or showing other signs of weakening bullish momentum.
If the crossover occurs near a significant resistance zone and price action confirms rejection, the setup may provide a more convincing trading opportunity.
Always define your stop-loss level and assess the risk-to-reward ratio before entering a position.
What Is Stochastic Divergence and How Can It Identify Potential Reversals?
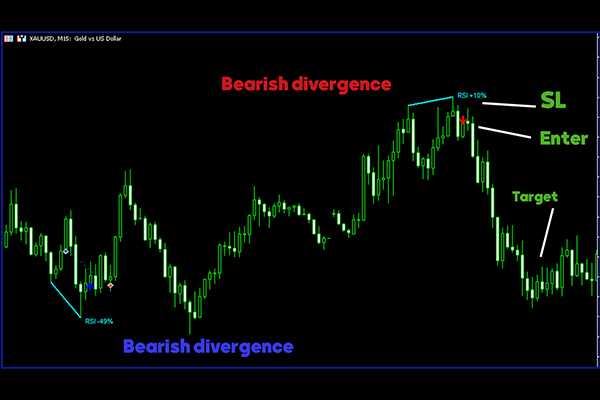
Stochastic divergence occurs when price movement and oscillator movement begin to disagree. This can indicate that the momentum supporting the current trend is weakening.
Bullish Stochastic Divergence
Bullish divergence occurs when the price forms a lower low while the Stochastic Oscillator forms a higher low.
This may suggest that selling momentum is fading, even though the market continues to make lower prices.
Traders often wait for additional confirmation, such as a break above a short-term swing high or a bullish reversal pattern, before considering a long position.
Bearish Stochastic Divergence
Bearish divergence occurs when the price forms a higher high while the Stochastic Oscillator forms a lower high.
This may indicate that bullish momentum is weakening despite the price continuing to rise.
If the divergence appears near a major resistance level and price action shows signs of rejection, a potential correction or trend reversal may warrant closer attention.
Remember that divergence is a warning, not a guarantee. It can persist for a considerable time before the market reacts.
Combining the Stochastic Oscillator with RSI, MACD, and Bollinger Bands
Combining indicators can provide a broader view of market conditions. The goal is not to collect as many signals as possible, but to use complementary tools that answer different trading questions.
Stochastic Oscillator and RSI
Both indicators help traders assess momentum and overbought or oversold conditions. When their readings align with an important support or resistance level, the overall setup may deserve further analysis.
However, because both indicators measure related market characteristics, agreement between them does not necessarily represent independent confirmation.
Stochastic Oscillator and MACD
MACD can help assess trend direction and momentum, while the Stochastic Oscillator can assist with entry timing.
For example, during a broader bullish trend supported by MACD, a trader might wait for a price pullback and then look for the Stochastic Oscillator to recover from oversold territory.
This approach focuses on potential entries in the direction of the prevailing trend rather than automatically trading against it.
Stochastic Oscillator and Bollinger Bands
If the price reaches the lower Bollinger Band while the Stochastic Oscillator enters oversold territory, traders may investigate whether a bullish reversal is developing.
However, during a strong downtrend, prices can continue moving along the lower band. Confirmation from price action remains important.
Common Mistakes When Using the Stochastic Oscillator
Even a useful indicator can produce poor trading decisions when applied without considering the broader market context.
-
Selling immediately in overbought territory: Strong uptrends can remain overbought for extended periods.
-
Buying immediately in oversold territory: Selling pressure may continue despite an extreme oscillator reading.
-
Ignoring the prevailing trend: Countertrend signals can be particularly risky during strong directional moves.
-
Constantly changing indicator settings: Optimizing settings around a handful of successful trades can lead to overfitting historical data.
-
Neglecting risk management: Stop-loss placement, position sizing, and risk-to-reward assessment should be considered before every trade.
-
Conclusion: How to Use the Stochastic Oscillator More Effectively
The Stochastic Oscillator is a useful technical analysis tool for evaluating momentum, identifying overbought and oversold conditions, interpreting %K and %D crossovers, and spotting potential divergence.
Its effectiveness depends on how it is incorporated into a broader trading strategy. Rather than relying on isolated indicator signals, traders should consider the prevailing trend, support and resistance levels, and price action.
A disciplined approach is to identify the market direction first, look for suitable Stochastic setups, wait for confirmation, and establish risk parameters before entering a position. Test your strategy using historical data or a demo account before applying it to live markets.

Explore More Trading Indicators
Traders looking to refine their market analysis can also explore specialized indicators designed to identify potential trading opportunities and complement traditional technical analysis tools. Choose indicators that match your trading style, evaluate their performance carefully, and remember that no indicator can guarantee trading profits.
This article is for educational purposes only and does not constitute financial or investment advice. Trading financial markets involves risk, and no technical indicator guarantees profitable results.


![[EURUSD]: Weekly Liquidity Activation Points (LAP), October 12-16, 2026](https://c.mql5.com/6/1035/splash-preview-777305.png "[EURUSD]: Weekly Liquidity Activation Points (LAP), October 12-16, 2026")
![[XAUUSD]: Weekly Liquidity Activation Points (LAP), October 12-16, 2026](https://c.mql5.com/6/1035/splash-preview-777299.png "[XAUUSD]: Weekly Liquidity Activation Points (LAP), October 12-16, 2026")
![[Nasdaq]: Weekly Liquidity Activation Points (LAP), October 12-16, 2026](https://c.mql5.com/6/1035/splash-preview-777311.png "[Nasdaq]: Weekly Liquidity Activation Points (LAP), October 12-16, 2026")