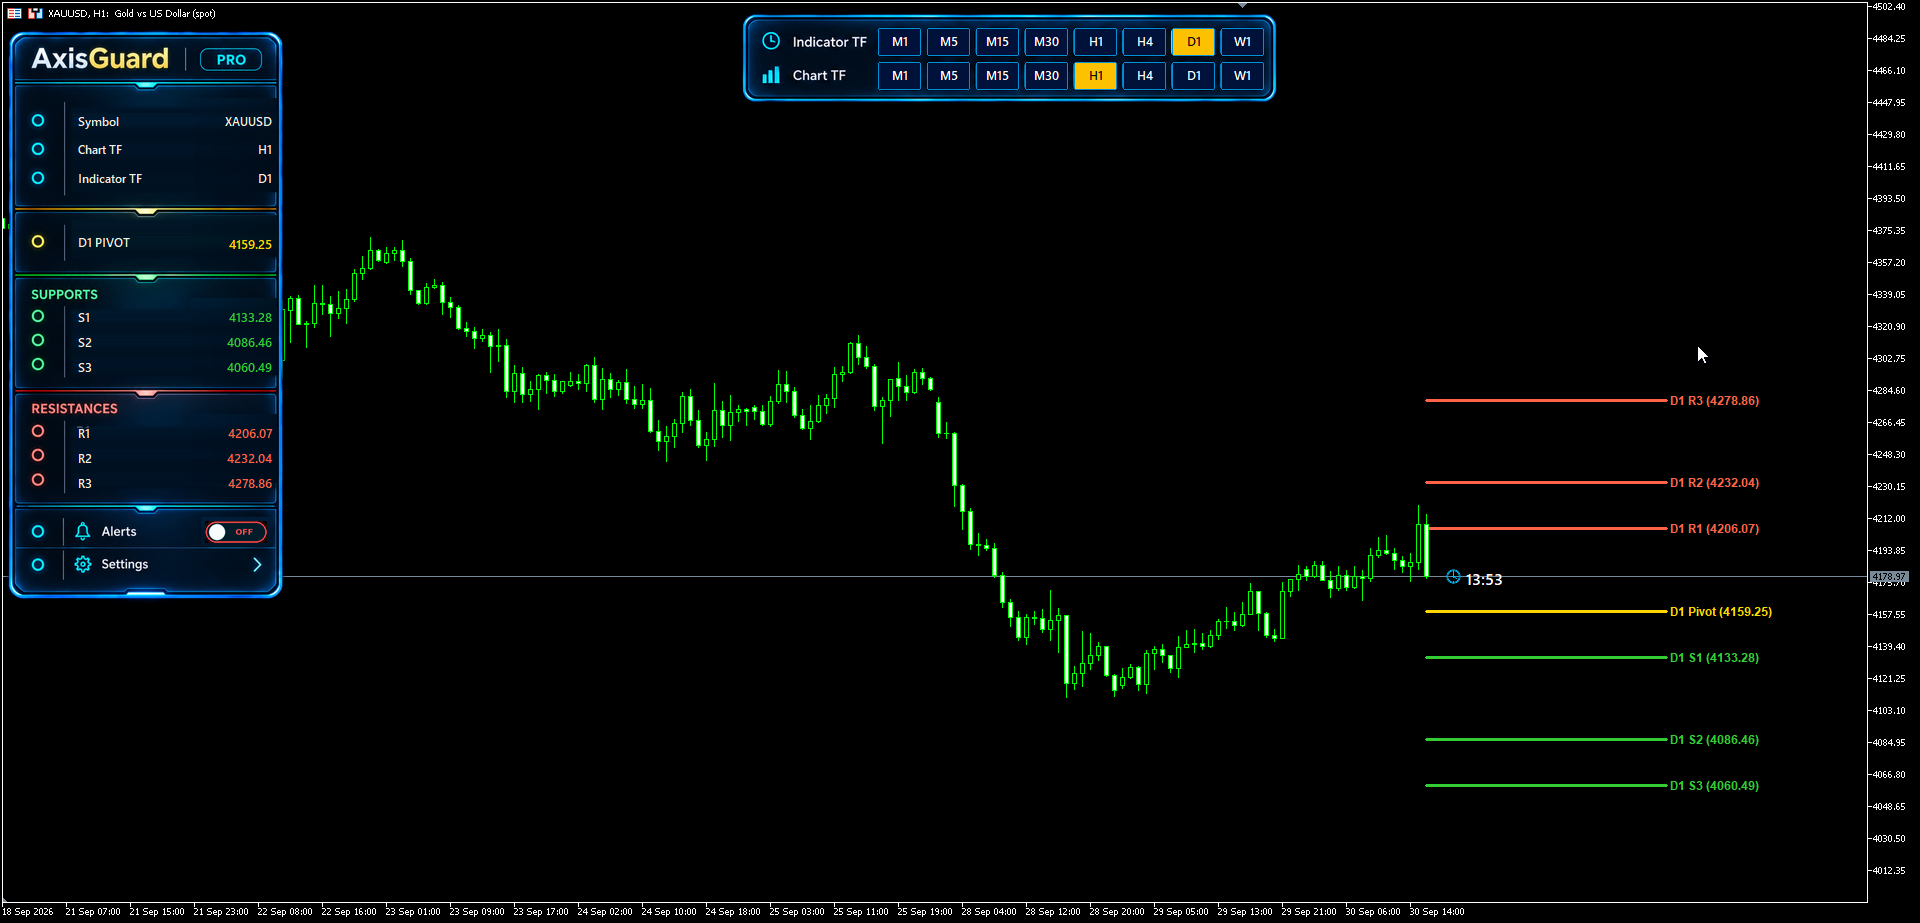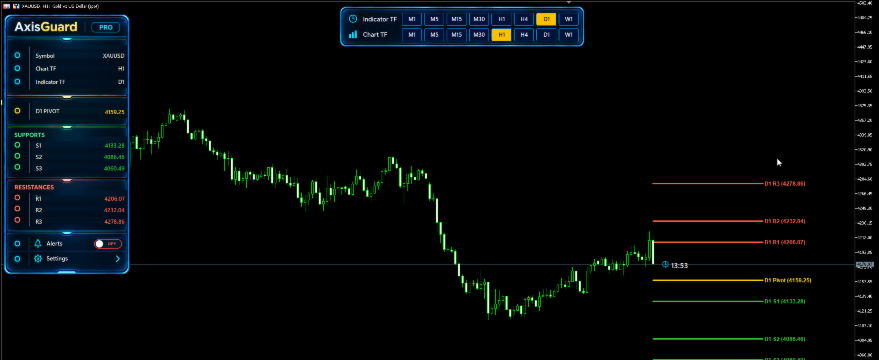

AxisGuard Pro lets you view daily market levels on a one-hour chart.
In this XAUUSD screenshot:
Chart TF: H1 — each candle represents one hour.
Indicator TF: D1 — the indicator displays daily levels.
Daily Pivot: 4159.25
Daily Resistance 1 (R1): 4206.07
On the right side of the chart, price moved above Daily R1 and then returned below it. This illustrates why crossing a resistance level does not guarantee further upside.
To display daily levels on your H1 chart, select H1 in the Chart TF row and D1 in the Indicator TF row.
You can customize your chart display with line or zone display modes.
Explore AxisGuard Pro for MetaTrader 5:
This is a historical educational example, not a live signal or trade recommendation.
Files:
AxisGuard Pro.png
290 kb