
Introduction
Candlestick patterns are one of the fundamental elements used by BIG DREAM EA to organize market analysis.
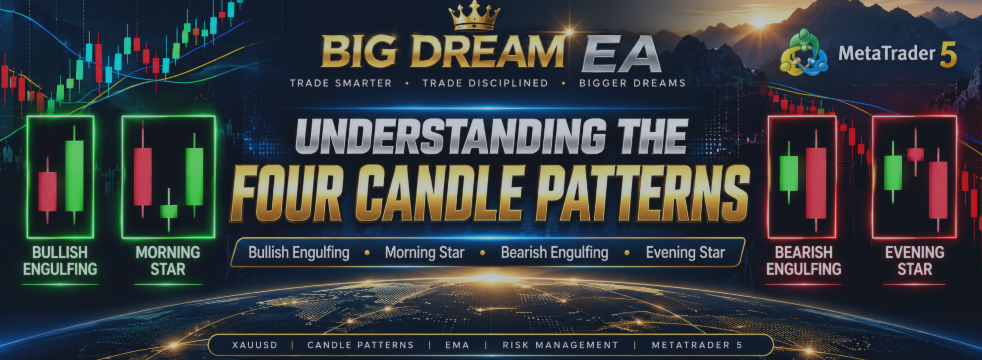
BIG DREAM EA focuses on four specific candle patterns:
-
Bullish Engulfing
-
Morning Star
-
Bearish Engulfing
-
Evening Star
These patterns are commonly associated with potential changes in buying and selling pressure.
However, a candle pattern should never be treated as a guaranteed prediction of future price movement.
The location of the pattern, surrounding price action, market structure, timeframe, and broader trend can significantly affect how the pattern should be interpreted.
This article explains the four patterns and how traders can study them when using BIG DREAM EA.
1. Bullish EngulfingThe Bullish Engulfing pattern consists of two candles.
The first candle is bearish.
The second candle is bullish and its real body completely engulfs the real body of the previous bearish candle.
The pattern represents a strong shift in short-term buying pressure.
What to observe
When identifying a Bullish Engulfing pattern, pay attention to:
-
The direction of the previous candle
-
The size of the bullish candle
-
Whether the bullish body actually engulfs the previous candle's body
-
Where the pattern appears
-
The surrounding market structure
A Bullish Engulfing pattern appearing after an extended decline may provide different information from the same pattern appearing in the middle of a strong sideways market.
BIG DREAM EA
When BIG DREAM detects a Bullish Engulfing pattern, the corresponding timeframe can display:
Bullish Engulfing
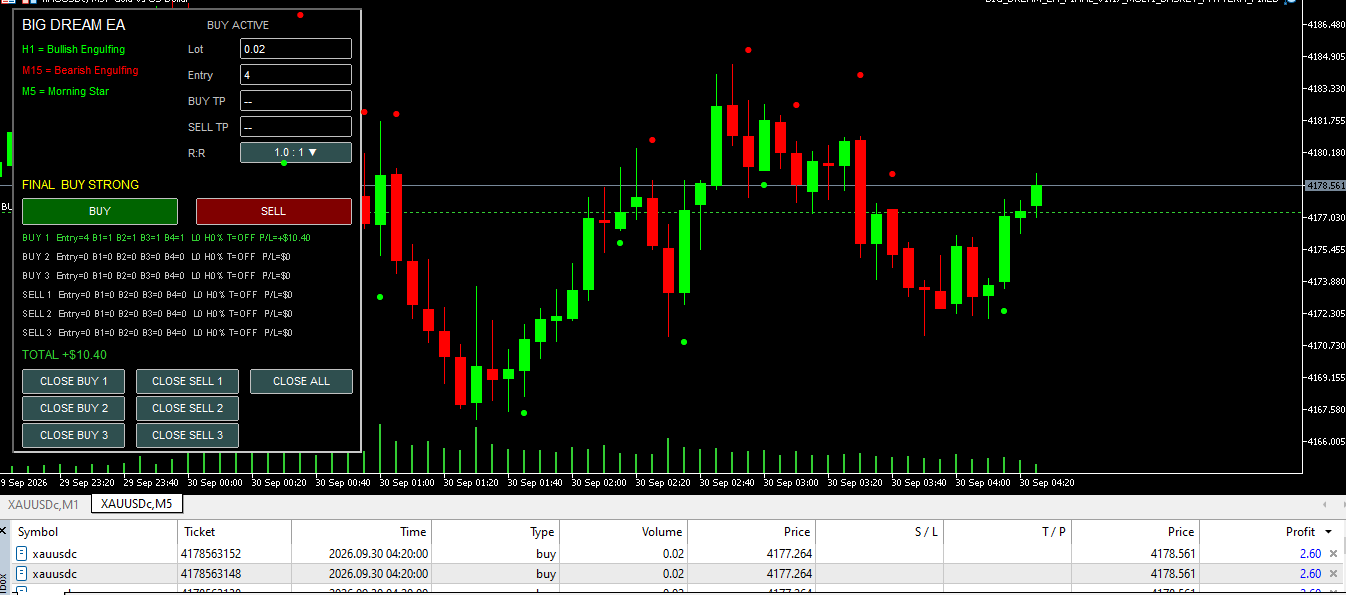
The trader can then compare the pattern across H1, M15, and M5.
The Morning Star is generally considered a three-candle bullish reversal formation.
A typical structure consists of:
-
A bearish candle
-
A relatively small-bodied candle
-
A strong bullish candle
The pattern represents a possible transition from selling pressure toward buying pressure.
What to observe
Important elements include:
-
The strength of the initial bearish candle
-
The size and position of the middle candle
-
The strength of the final bullish candle
-
The location of the pattern
-
The previous market trend
The third candle is particularly important because it provides evidence that buying pressure has increased.
BIG DREAM EA
When the pattern is detected, the relevant timeframe can display:
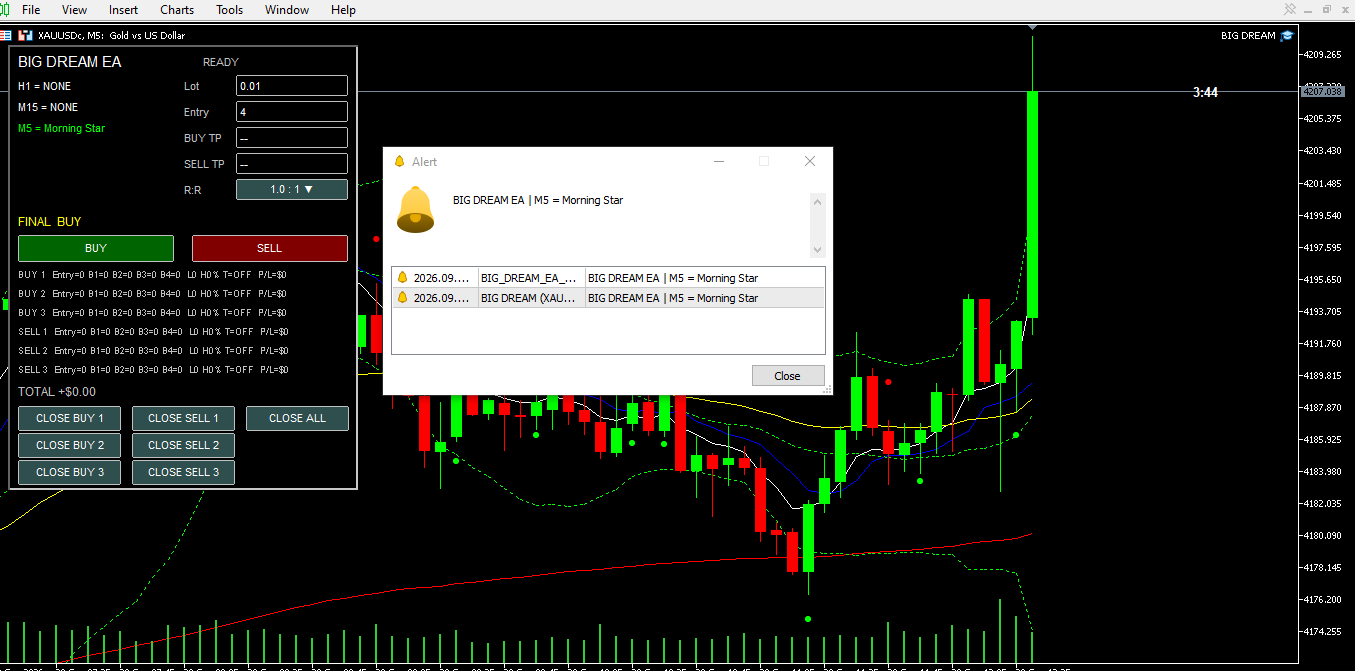
Morning Star
The trader can then compare the signal with the pattern information from the other timeframes.
The Bearish Engulfing pattern is the opposite directional structure of Bullish Engulfing.
It consists of:
-
A bullish candle
-
A bearish candle whose real body completely engulfs the previous bullish candle's real body
The pattern represents a potential increase in selling pressure.
What to observe
When analyzing Bearish Engulfing, consider:
-
The previous market direction
-
The strength of the bearish candle
-
The size of the engulfing body
-
The location of the pattern
-
The surrounding price structure
A Bearish Engulfing pattern near an area where price has already experienced a strong upward movement may have a different context from one appearing during random sideways movement.
BIG DREAM EA
When detected, the corresponding timeframe can display:
Bearish Engulfing
The trader can then compare H1, M15, and M5 information.
The Evening Star is generally considered a three-candle bearish reversal formation.
A typical structure consists of:
-
A bullish candle
-
A relatively small-bodied candle
-
A strong bearish candle
The formation can indicate a potential transition from buying pressure toward selling pressure.
What to observe
Important considerations include:
-
The strength of the initial bullish candle
-
The size of the middle candle
-
The strength of the final bearish candle
-
The location of the formation
-
The previous market structure
The final bearish candle is important because it provides evidence that selling pressure has increased.
BIG DREAM EA
When detected, the relevant timeframe can display:
Evening Star
The trader can compare the result with the higher and lower timeframe patterns.
A candle pattern should not be analyzed in isolation.
The same pattern can produce different market behavior depending on where it occurs.
Consider two Bullish Engulfing patterns.
Example A
Bullish Engulfing appears after a prolonged decline and near an area where price has previously reacted.
The surrounding market structure may provide additional context for the pattern.
Example B
Bullish Engulfing appears in the middle of a highly volatile sideways market.
The same visual pattern may have less directional context.
Therefore:
Pattern + Location + Market Structure
is generally more informative than looking at the candle pattern alone.
BIG DREAM EA provides the pattern information, but the trader remains responsible for interpreting the complete market context.
BIG DREAM EA analyzes candle patterns across:
H1 → M15 → M5
This allows traders to compare the pattern structure across different levels of market observation.
For example:
Scenario 1 — Bullish Alignment
H1: Bullish Engulfing
M15: Morning Star
M5: Bullish Engulfing
All three timeframes are showing bullish-type reversal patterns.
This may provide a more coherent bullish context than having conflicting patterns.
Scenario 2 — Conflicting Structure
H1: Bullish Engulfing
M15: NONE
M5: Evening Star
The information is mixed.
The trader may need to wait for additional price action rather than treating the M5 pattern as an isolated signal.
Scenario 3 — Bearish Alignment
H1: Evening Star
M15: Bearish Engulfing
M5: Bearish Engulfing
The three timeframes are showing bearish-type structures.
Again, this is information for analysis—not a guarantee of future price movement.
This is an important concept for anyone studying candlestick patterns.
A candle that is still forming can change significantly before it closes.
For example, a candle may initially look strongly bullish, but later close as a small-bodied candle or even a bearish candle.
Therefore, traders should distinguish between:
Developing Candle
and
Completed Candle
BIG DREAM EA's candle countdown timer can help traders recognize how much time remains before the current candle closes.
The timer is particularly useful when studying candle formations because the final candle structure cannot be fully evaluated until the candle has completed.
Candle patterns can provide information about short-term price behavior.
EMA structure can provide additional information about the broader directional environment.
BIG DREAM EA uses:
-
EMA 7
-
EMA 10
-
EMA 50
-
EMA 200
For example, a bullish candle pattern occurring while the EMA structure is also generally bullish may provide a different analytical context from a bullish pattern occurring while the EMA structure is strongly bearish.
Likewise, a bearish pattern appearing below a bearish EMA structure may provide a different context from a bearish pattern appearing directly against a strong bullish structure.
This does not mean that the EMA structure confirms every candle pattern.
It means that the trader can study both pieces of information together.
A visually strong candle pattern does not guarantee that the next candle will continue in the expected direction.
Markets can reverse unexpectedly because of:
-
Volatility
-
Economic news
-
Liquidity changes
-
Market sentiment
-
Higher-timeframe structure
-
Unexpected order flow
Therefore, traders should avoid treating candle patterns as certainty.
A better approach is to treat them as one component of a broader decision-making process.
BIG DREAM EA is specifically designed around these four candle patterns.
The pattern engine identifies:
Bullish Patterns
Bullish Engulfing
Morning Star
Bearish Patterns
Bearish Engulfing
Evening Star
The detected pattern can then be displayed on the BIG DREAM panel for the relevant timeframe.
The purpose is to give the trader a structured view of candle-pattern information without requiring the trader to manually scan every candle on multiple timeframes.
A trader studying BIG DREAM can use the following sequence.
Step 1
Start with H1.
Ask:
What candle pattern is currently visible?
Step 2
Move to M15.
Ask:
Does M15 support or conflict with the H1 structure?
Step 3
Move to M5.
Ask:
What is happening in the more immediate price structure?
Step 4
Check EMA 7 and EMA 10.
Ask:
Is short-term price structure bullish, bearish, or mixed?
Step 5
Check EMA 50 and EMA 200.
Ask:
What is the broader directional environment?
Step 6
Check price location.
Ask:
Where is the candle pattern occurring?
Step 7
Check the candle timer.
Ask:
Is the candle completed or still developing?
Step 8
Only after the complete analysis should the trader decide whether the setup meets their own trading plan.
Mistake 1 — Trading Every Pattern
Not every candle pattern creates a good trading opportunity.
A pattern is information, not an instruction.
Mistake 2 — Ignoring the Higher Timeframe
A trader may see a bullish pattern on M5 while the H1 structure is strongly bearish.
The lower timeframe should not automatically override the broader market context.
Mistake 3 — Entering Before Candle Completion
A developing candle can change before it closes.
Waiting for confirmation may produce different information from analyzing an unfinished candle.
Mistake 4 — Ignoring EMA Structure
A trader may focus entirely on the candle pattern and ignore the broader trend reference.
The EMA combination can provide additional context.
Mistake 5 — Ignoring Risk Management
Even a well-formed pattern can fail.
Position sizing and risk management remain essential.
The best way to understand candle patterns is through repeated observation.
Study these four formations in different market conditions:
Bullish Engulfing
Morning Star
Bearish Engulfing
Evening Star
Observe them during:
-
Trending markets
-
Sideways markets
-
High volatility
-
Low volatility
-
Different sessions
-
Different timeframes
The objective is not simply to memorize the shape of the candle.
The objective is to understand how the pattern behaves in different contexts.
The four candle patterns used by BIG DREAM EA are:
Bullish Engulfing
Morning Star
Bearish Engulfing
Evening Star
These patterns provide a structured way to observe potential changes in buying and selling pressure.
However, successful pattern analysis requires more than recognizing a candle formation.
The trader should consider:
Pattern + Location + Market Structure + EMA Alignment + Timeframe + Risk Management
BIG DREAM EA provides the tools to organize this information.
The trader provides the analysis, discipline, and decision.
Learn the patterns.
Study their context.
Practice them across multiple market conditions.
And always remember that a candle pattern is a probability-based market observation—not a guarantee of what price will do next.