
Introduction
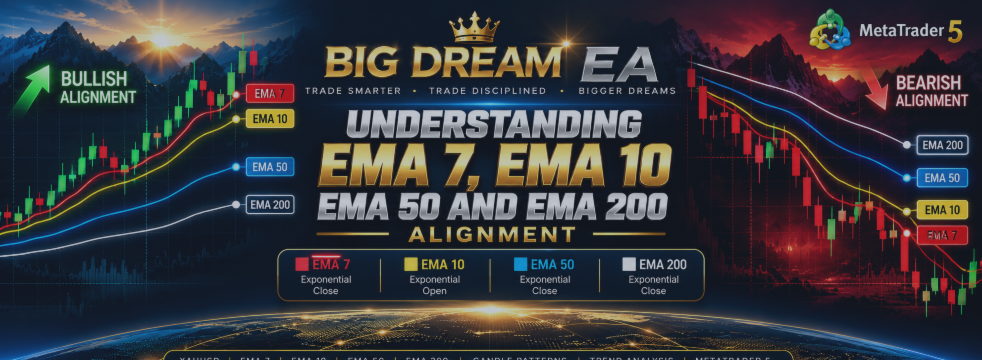
BIG DREAM EA uses a combination of four Exponential Moving Averages (EMA) as part of its market analysis framework:
-
EMA 7
-
EMA 10
-
EMA 50
-
EMA 200
Each EMA provides a different perspective of price behavior.
The shorter EMAs respond more quickly to recent price movement, while the longer EMAs provide a broader view of the market's directional structure.
The objective is not to treat one EMA crossing another as an automatic trading signal.
Instead, traders can study the relationship, order, slope, separation, and interaction between the four EMAs together with candlestick patterns and market structure.
1. EMA 7 — Fast Price ResponseEMA 7 — Exponential, Close
EMA 7 is the fastest EMA used by BIG DREAM EA.
Because it uses a relatively short period, it responds quickly to changes in recent closing prices.
This makes EMA 7 useful for observing short-term momentum.
When price moves strongly upward, EMA 7 can react relatively quickly and move above slower averages.
When price moves strongly downward, EMA 7 can move downward and can fall below slower averages.
What to observe
Pay attention to:
-
The direction of EMA 7
-
Its position relative to EMA 10
-
Its position relative to EMA 50
-
The distance between EMA 7 and the other averages
-
Whether price is consistently trading above or below it
EMA 7 is therefore useful for observing the short-term side of the market.
EMA 10 — Exponential, Open
EMA 10 is another short-term reference.
BIG DREAM EA uses the opening price as the applied price for EMA 10.
Because EMA 10 is slightly slower than EMA 7, the relationship between these two averages can provide additional information about short-term price behavior.
Bullish short-term structure
A commonly observed bullish configuration is:
EMA 7 above EMA 10
especially when both averages are pointing upward and price is maintaining a position above them.
Bearish short-term structure
A commonly observed bearish configuration is:
EMA 7 below EMA 10
especially when both averages are pointing downward and price is maintaining a position below them.
However, a single crossover should not automatically be interpreted as a trading signal.
The surrounding market structure remains important.
EMA 50 — Exponential, Close
EMA 50 provides a slower reference than EMA 7 and EMA 10.
It can help traders observe the intermediate directional environment.
For example, when:
EMA 7 > EMA 10 > EMA 50
and the three averages are generally rising, the market may be displaying a more organized bullish structure.
Conversely, when:
EMA 7 < EMA 10 < EMA 50
and the averages are generally declining, the market may be displaying a more organized bearish structure.
These configurations should be studied together with actual price behavior rather than used as an isolated mechanical rule.
EMA 200 — Exponential, Close
EMA 200 is the slowest EMA in the BIG DREAM combination.
It provides a broad reference for the longer-term market environment.
Because EMA 200 reacts more slowly to price changes, it generally does not change direction as quickly as EMA 7 or EMA 10.
Bullish environment
When price is trading above a rising EMA 200, the broader market environment can be studied as potentially bullish.
Bearish environment
When price is trading below a declining EMA 200, the broader market environment can be studied as potentially bearish.
Again, this is market context—not a guarantee of future price movement.
One of the configurations traders can study is:
EMA 7 > EMA 10 > EMA 50 > EMA 200
This means the faster EMA is positioned above the slower EMA in sequence.
If the averages are also generally sloping upward and price is maintaining a position above the structure, the market may be exhibiting an organized bullish trend.
A simplified visual structure is:
Price
↓
EMA 7
↓
EMA 10
↓
EMA 50
↓
EMA 200
The more important point is not simply the order.
Traders should also examine:
-
EMA direction
-
Price position
-
Distance between EMAs
-
Market structure
-
Candle patterns
-
Higher-timeframe context
The opposite configuration can be observed when:
EMA 7 < EMA 10 < EMA 50 < EMA 200
If the averages are generally sloping downward and price remains below the structure, the market may be exhibiting an organized bearish trend.
A simplified structure is:
EMA 200
↓
EMA 50
↓
EMA 10
↓
EMA 7
↓
Price
As with bullish alignment, the order alone is not enough.
The trader should examine the complete market context.
Not every market produces a clean EMA alignment.
Sometimes the structure may look like:
EMA 7 > EMA 50 > EMA 10
or the averages may repeatedly cross each other.
This can happen during:
-
Sideways markets
-
Consolidation
-
Rapid reversals
-
Low directional momentum
-
High volatility
When the EMAs are tangled together, the directional information may be less clear.
This is an important condition to recognize.
A trader should not force a bullish or bearish interpretation simply because the four EMA lines are present on the chart.
The position of an EMA is only one part of the analysis.
The slope of the EMA is also important.
Consider two situations.
Situation A
EMA 50 is above EMA 200, but both are almost flat.
This may indicate that the broader trend is not strongly directional.
Situation B
EMA 50 is above EMA 200 and both are clearly rising.
This provides a different market structure.
The same principle applies to EMA 7 and EMA 10.
Therefore, study:
Position + Slope + Separation
rather than position alone.
The distance between EMAs can also provide useful visual information.
When the faster averages move away from the slower averages, the market may be showing stronger directional movement.
For example:
EMA 7 → EMA 10 → EMA 50 → EMA 200
with increasingly clear separation can indicate a more organized directional structure.
On the other hand, when the four averages become compressed and repeatedly cross each other, the market may be less directional.
EMA separation should therefore be treated as context, not as a standalone entry trigger.
Price does not always move continuously in one direction.
Even during a strong trend, price can retrace toward the EMA structure.
For example, during a bullish environment:
-
Price moves upward.
-
EMA 7 and EMA 10 move upward.
-
Price retraces toward the shorter EMAs.
-
The bullish structure remains intact.
-
Price resumes moving upward.
A similar process can occur in a bearish environment.
This is why traders should study the relationship between price and the EMA structure, rather than simply waiting for a crossover.
This is where the BIG DREAM methodology becomes more complete.
The four candle patterns provide information about potential changes in buying and selling pressure:
Bullish
-
Bullish Engulfing
-
Morning Star
Bearish
-
Bearish Engulfing
-
Evening Star
The EMA structure provides another layer of market context.
For example:
Bullish Candle Pattern + Bullish EMA Structure
may provide a different analytical context from:
Bullish Candle Pattern + Bearish EMA Structure
The same applies to bearish patterns.
This does not mean that one combination guarantees a successful trade.
It means that combining the information can help the trader develop a more structured market analysis.
Imagine the following conditions:
H1: Bullish EMA structure
M15: Bullish EMA structure
M5: Bullish Engulfing
EMA 7: Above EMA 10
EMA 50: Rising
EMA 200: Rising
The information is relatively aligned toward the bullish side.
A trader can then examine:
-
Where the M5 pattern occurred
-
Whether the candle has completed
-
The current market structure
-
Volatility
-
Risk management
-
Planned entry and exit
The important point is that the EMA structure supports the analysis rather than replacing it.
Consider another situation:
H1: Bearish EMA structure
M15: Bearish EMA structure
M5: Bearish Engulfing
EMA 7: Below EMA 10
EMA 50: Declining
EMA 200: Declining
Again, the information is relatively aligned toward the bearish side.
The trader can then study the pattern location, market structure, candle completion, and risk management before making a decision according to their own trading plan.
This is one of the most important situations to understand.
For example:
EMA structure: Strongly bearish
but
M5: Bullish Engulfing
This does not automatically mean that the bullish pattern is wrong.
The pattern may represent:
-
A temporary retracement
-
A short-term reversal
-
A deeper market reversal
-
A reaction to a particular price level
The trader therefore needs additional context.
The conflict itself is useful information.
It tells the trader that the market is not presenting a simple directional structure.
BIG DREAM EA is designed to help traders analyze multiple timeframes.
A practical approach is:
H1
Study the broader market environment.
M15
Study the intermediate structure.
M5
Study the more immediate trading environment and candle pattern.
This creates a top-down analytical process:
H1 → M15 → M5
The trader can then compare the candle patterns and EMA structure across these timeframes.
No technical indicator can guarantee the direction of the next market movement.
EMA structures can change.
Trends can reverse.
Breakouts can fail.
Candle patterns can fail.
Market conditions can change rapidly.
Therefore, EMA alignment should be treated as analytical information, not certainty.
The purpose of BIG DREAM EA is to help organize market information so that the trader can make decisions according to their own trading plan and risk management.
Before considering a setup, traders can ask:
1. Where is EMA 200?
Is the broader environment rising, falling, or relatively flat?
2. Where is EMA 50?
Is the intermediate structure supporting the broader environment?
3. What is the relationship between EMA 7 and EMA 10?
Is short-term momentum bullish, bearish, or mixed?
4. Are the EMAs properly aligned?
Are they ordered and separated, or are they tangled?
5. Where is price?
Is price above, below, or moving through the EMA structure?
6. What candle pattern is present?
Is there a Bullish Engulfing, Morning Star, Bearish Engulfing, or Evening Star?
7. What is happening on the higher timeframe?
Does H1 and M15 support or conflict with the M5 information?
8. Is the candle completed?
Avoid interpreting a developing candle as if it were already confirmed.
9. What is the risk?
A technically attractive setup still requires proper risk management.
Understanding EMA alignment requires observation and practice.
Spend time studying historical charts and observe how:
-
EMA 7 reacts to price
-
EMA 10 follows short-term movement
-
EMA 50 develops intermediate structure
-
EMA 200 represents the broader environment
-
The four EMAs behave during trends
-
The four EMAs behave during consolidation
-
Candle patterns behave when aligned with the EMA structure
-
Candle patterns behave when they conflict with the EMA structure
The objective is not to memorize a single configuration.
The objective is to understand how the EMA structure behaves under different market conditions.
BIG DREAM EA is designed to help organize market information and execution.
It can display and process the information defined by its system.
However, the trader remains responsible for understanding the market, selecting the appropriate setup, managing risk, and deciding how the tool should be used.
Think of BIG DREAM EA as a trading weapon.
A weapon can be sophisticated, but its effectiveness also depends on the person using it.
Therefore:
Learn the system.
Practice the system.
Understand the market.
Then use the tool according to your own trading plan and risk management.
Before using BIG DREAM EA in live trading, make sure you understand:
-
The four candle patterns — Bullish Engulfing, Morning Star, Bearish Engulfing, and Evening Star.
-
The combination of EMA 7, EMA 10, EMA 50, and EMA 200 and how their alignment can describe different market conditions.
-
Practice is essential. Use the EA and study different market situations until you understand how the system behaves. BIG DREAM EA is a trading weapon; how effectively it is used depends on the person operating it.
-
Trading involves risk. Higher potential returns are associated with higher risk, and there is no guarantee of profit.
Trade with knowledge, discipline, and proper risk management.