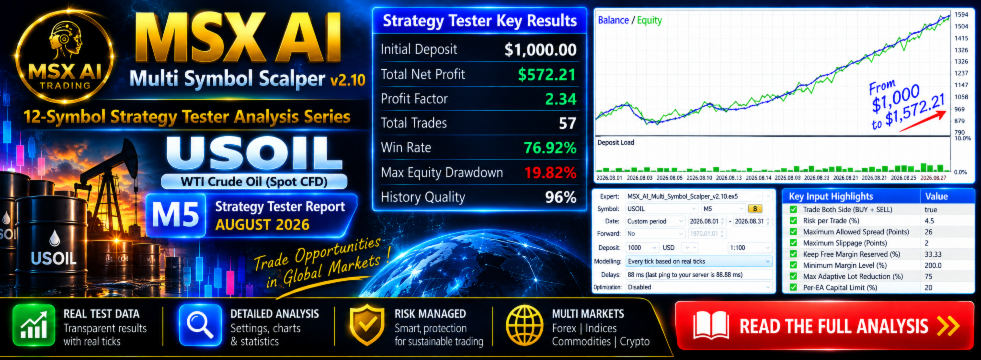
MSX AI Multi Symbol Scalper v2.10 — USOIL M5 Strategy Tester Report | August 2026

USOIL M5 Historical Strategy Tester Study
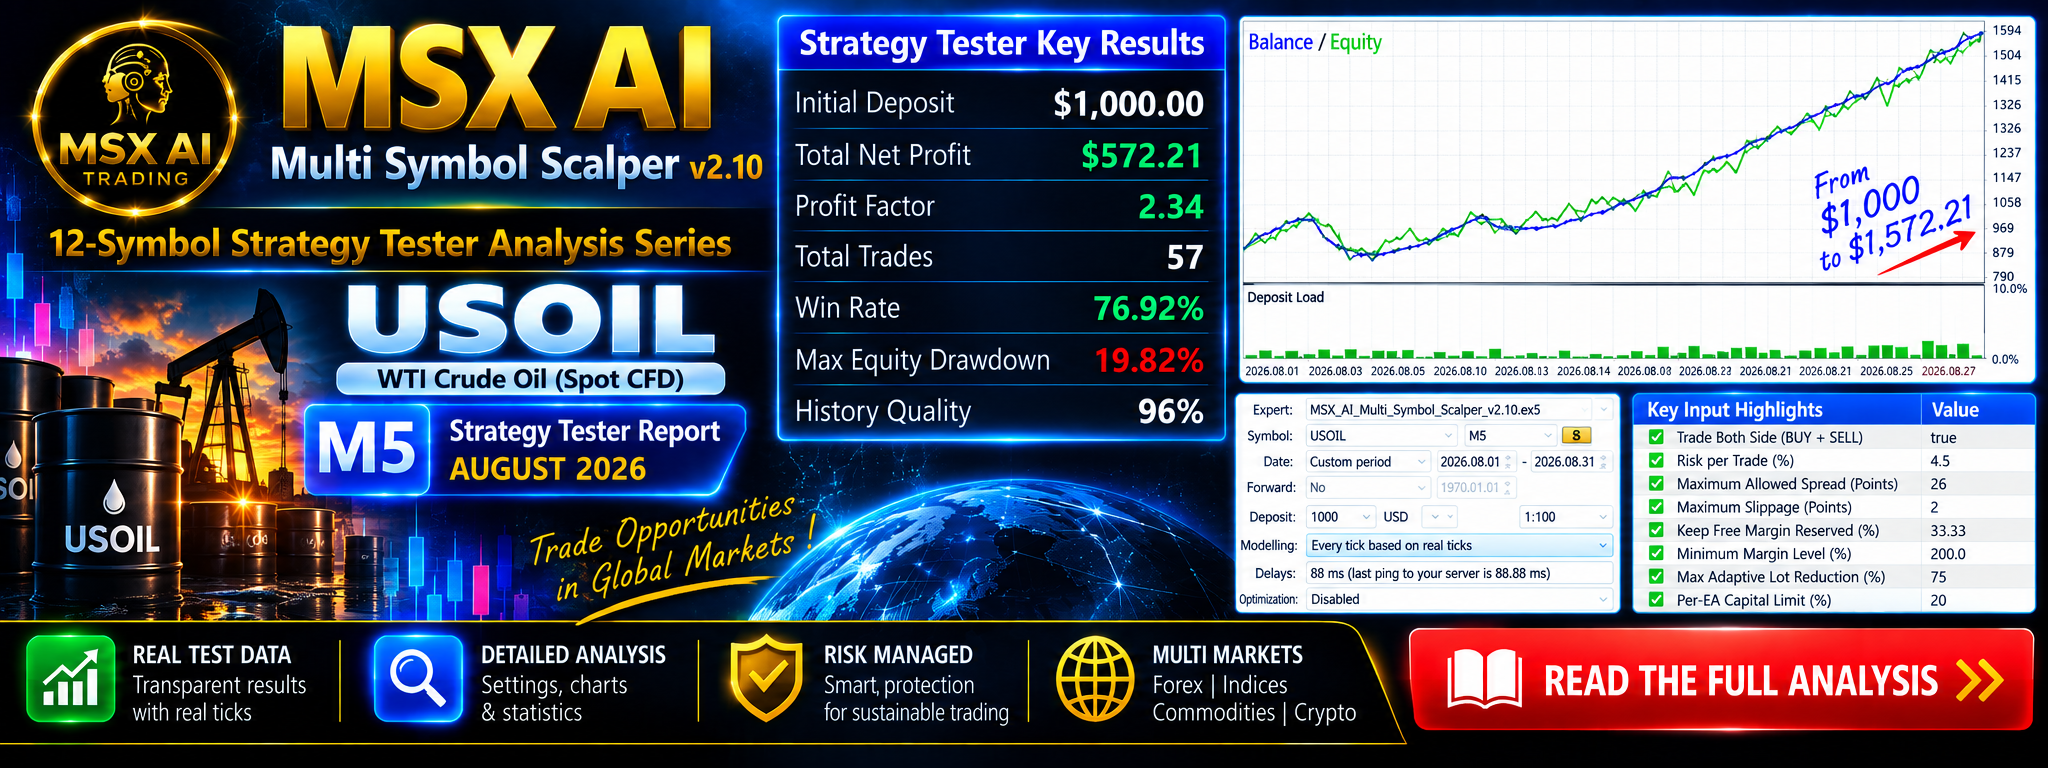
This report presents a historical MetaTrader 5 Strategy Tester study of MSX AI Multi Symbol Scalper v2.10 on USOIL M5 for August 2026.
The test uses Every tick based on real ticks, a $1,000 initial deposit and the configured risk-management, capital-allocation, margin-control, partial-profit and session-management settings shown below.
This is a historical single-symbol Strategy Tester study. It is not a live-trading result and does not represent the performance of a complete multi-symbol portfolio.
1. Test Configuration
| Parameter | Setting |
|---|---|
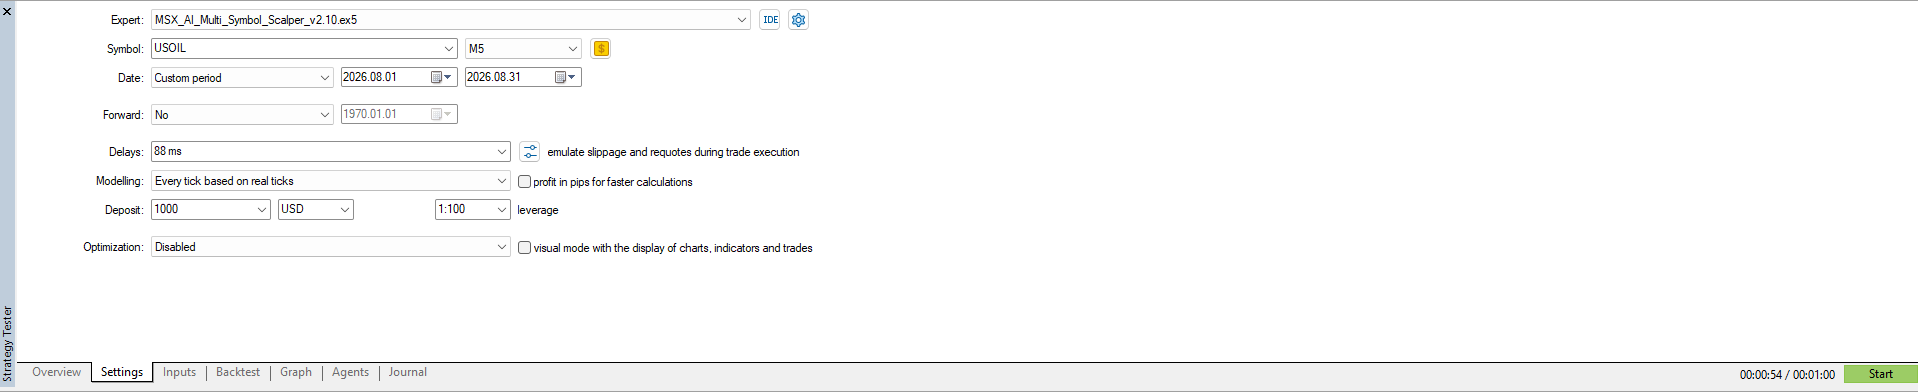
| Expert Advisor | MSX_AI_Multi_Symbol_Scalper_v2.10.ex5 |
| Symbol | USOIL |
| Timeframe | M5 |
| Test Period | 01–31 August 2026 |
| Forward Test | No |
| Initial Deposit | $1,000 USD |
| Leverage | 1:100 |
| Modelling | Every tick based on real ticks |
| Delay | 88 ms |
| Optimization | Disabled |
| History Quality | 96% |
| Bars | 5,544 |
| Ticks | 3,399,339 |
| Symbols | 1 |
2. Key Trading & Risk Configuration
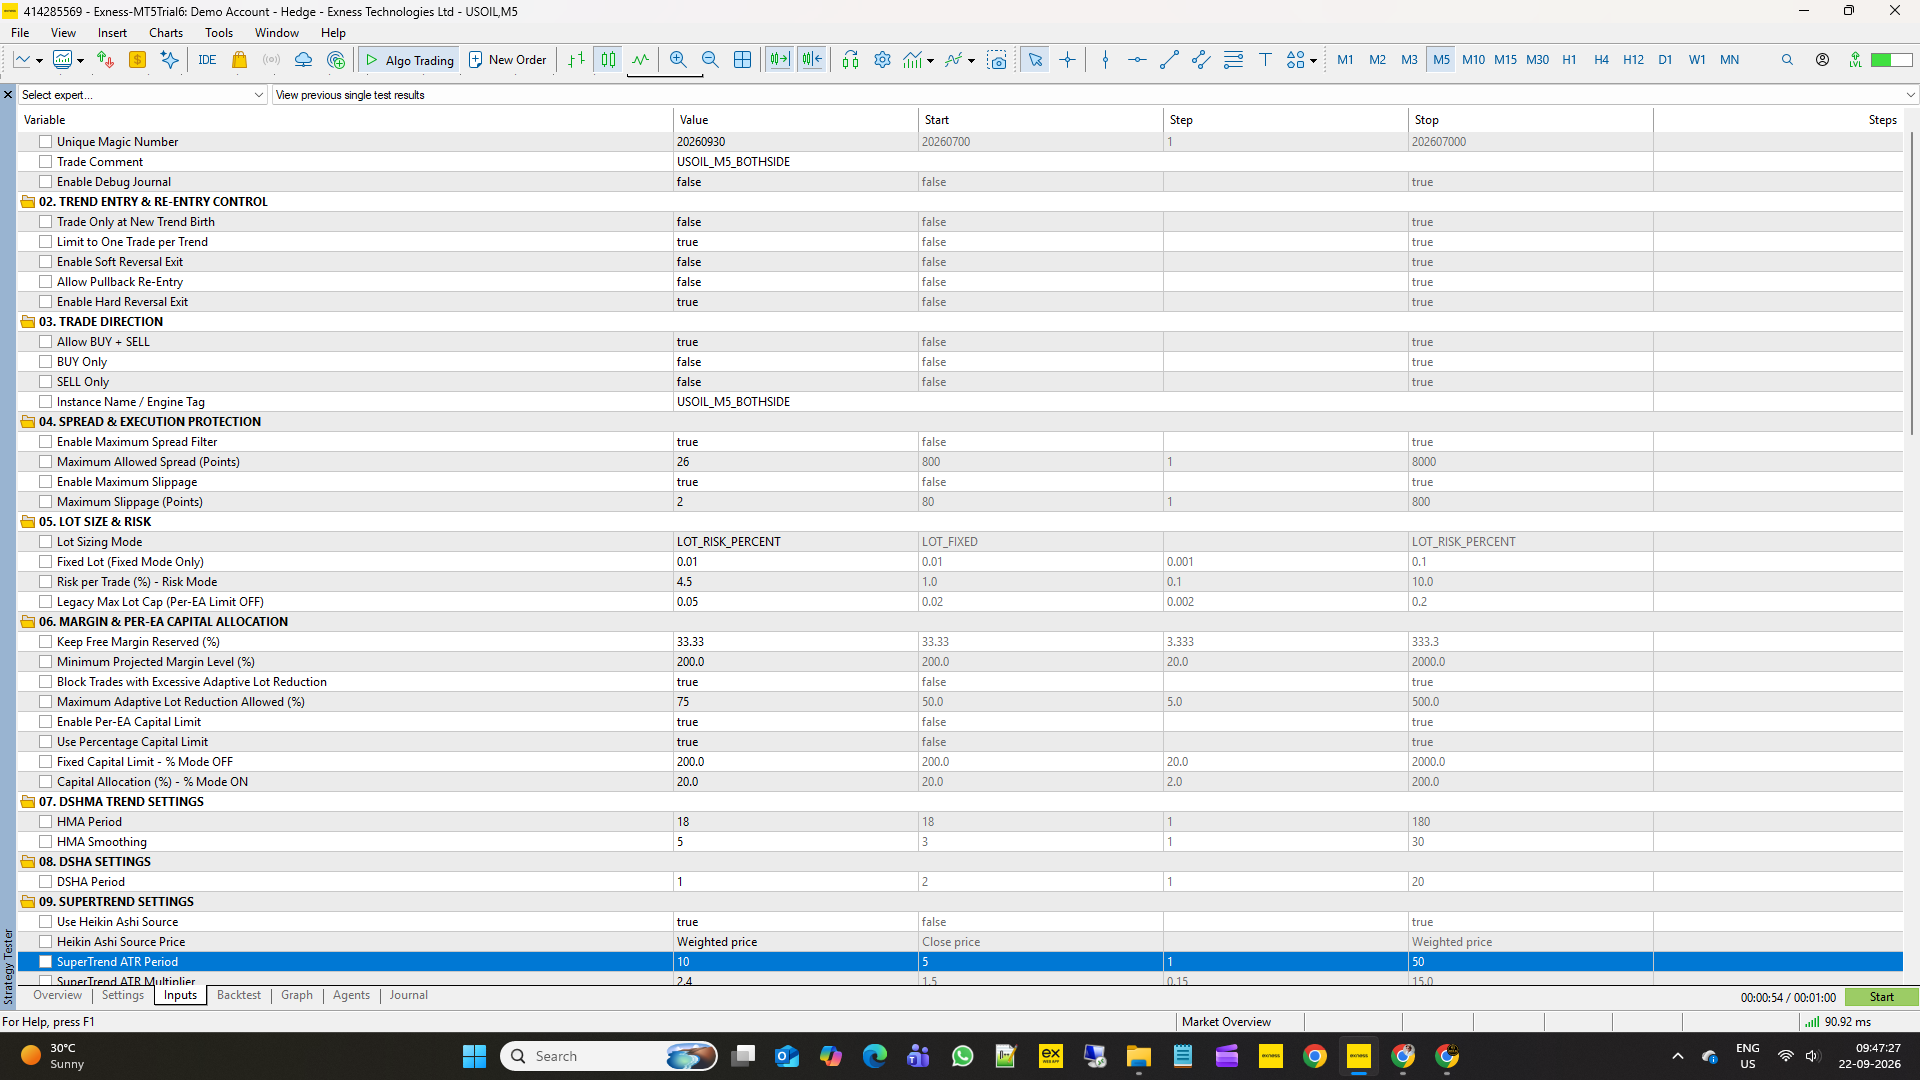
- Trade Direction: BUY + SELL
- Trade Only at New Trend Birth: OFF
- Limit One Trade per Trend: ON
- Hard Reversal Exit: ON
- Soft Reversal Exit: OFF
- Pullback Re-Entry: OFF
- Maximum Spread Filter: 26 points
- Maximum Slippage: 2 points
- Lot Sizing: Risk Percent
- Risk per Trade: 4.5%
- Legacy Max Lot Cap: 0.05
- Keep Free Margin Reserved: 33.33%
- Minimum Projected Margin Level: 200%
- Maximum Adaptive Lot Reduction: 75%
- Per-EA Capital Allocation: 20%
3. Trend & Hard Reversal Exit Configuration
Main Trend Engine
- HMA Period: 18
- HMA Smoothing: 5
- DSHA Period: 1
- Heikin Ashi Source: ON
- Source Price: Weighted Price
- SuperTrend ATR Period: 10
- SuperTrend ATR Multiplier: 2.4
- ATR Spike Filter: ON
- ATR Spike Threshold: 2.4
- Trend Strength Calculation: ON
- Minimum Reversal Strength: 0.6
Hard Reversal Exit
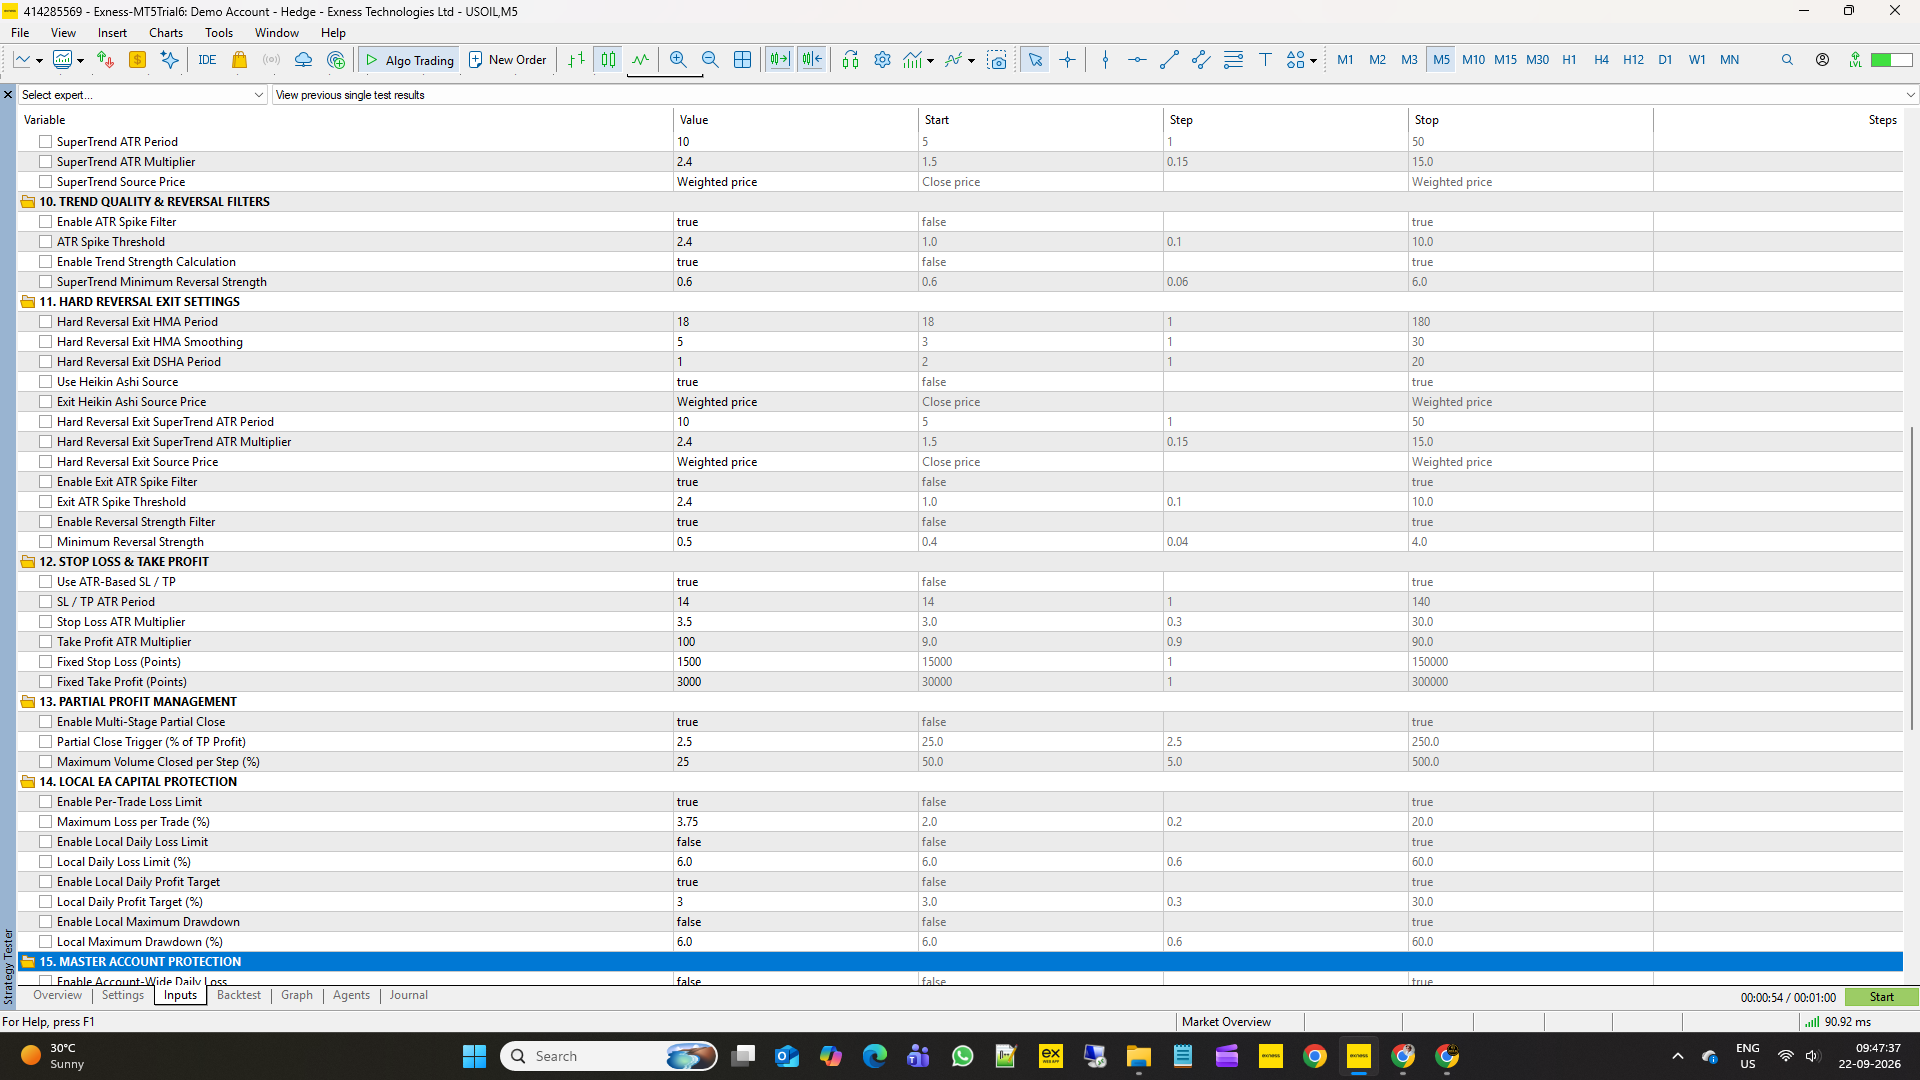
- Hard Reversal Exit HMA: 18 / 5
- Exit DSHA Period: 1
- Heikin Ashi Exit Source: ON
- Exit Source Price: Weighted Price
- Exit SuperTrend ATR Period: 10
- Exit SuperTrend ATR Multiplier: 2.4
- Exit ATR Spike Filter: ON
- Exit ATR Spike Threshold: 2.4
- Reversal Strength Filter: ON
- Minimum Exit Reversal Strength: 0.5
4. Stop Loss, Take Profit & Partial Profit
- ATR-Based SL/TP: ON
- ATR Period: 14
- Stop Loss ATR Multiplier: 3.5
- Take Profit ATR Multiplier: 100
- Multi-Stage Partial Close: ON
- Partial Close Trigger: 2.5% of TP Profit
- Maximum Volume Closed per Step: 25%
- Per-Trade Loss Limit: ON
- Maximum Loss per Trade: 3.75%
- Local Daily Loss Limit: OFF
- Local Daily Profit Target: 3%
- Local Maximum Drawdown: OFF
The Multi-Stage Partial Close mechanism reduces open position volume progressively when its configured profit trigger is reached rather than requiring the entire position to remain open until the final TP level.
5. Session & Weekend Configuration
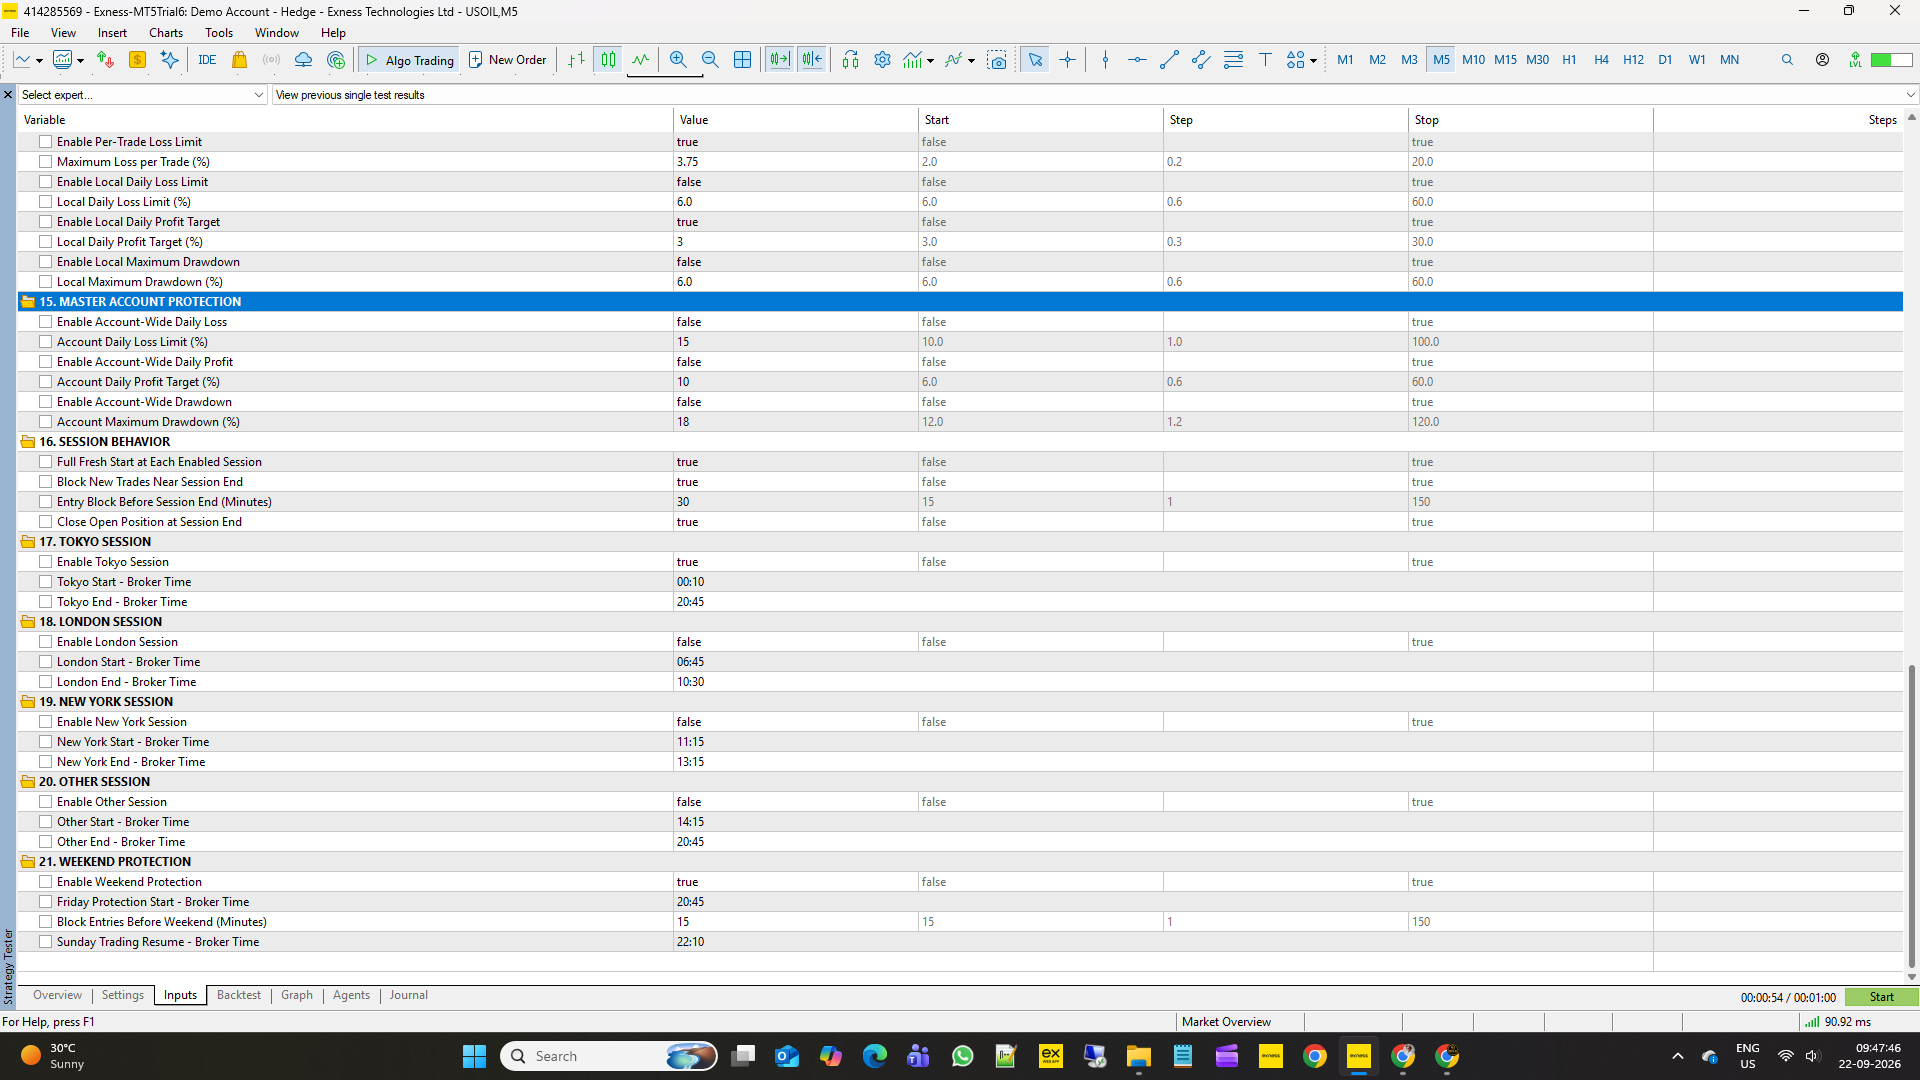
- Full Fresh Start at Each Enabled Session: ON
- Block New Trades Near Session End: ON
- Entry Block Before Session End: 30 minutes
- Close Open Position at Session End: ON
Tokyo Session
- Enabled: YES
- Start: 00:10 broker time
- End: 20:45 broker time
London, New York and Other sessions were disabled for this test.
Weekend Protection
- Enabled: YES
- Friday Protection Start: 20:45
- Block Entries Before Weekend: 15 minutes
- Sunday Trading Resume: 22:10
6. Understanding the Multi-Symbol Portfolio Architecture
The USOIL result shown here represents one USOIL EA instance in the Strategy Tester.
MSX AI Multi Symbol Scalper can also be deployed using multiple EA instances across different symbols, timeframes and trading directions.
The Per-EA Capital Allocation setting works together with Free Margin Reserve, projected Margin Level and adaptive lot reduction. It should not be interpreted as a permanently separated cash account for each symbol.
The operating concept is:
Valid Setup → Margin Check → Position Opened → Partial Profit Event → Position Volume Reduced → Margin Released → Another Valid Setup May Use Available Margin
Therefore, a percentage such as 20% should not simply be interpreted as:
100 ÷ 20 = maximum 5 EA instances
Actual participation can change dynamically according to open positions, floating P/L, available margin, position volume, broker requirements and valid trading setups.
This individual USOIL test should therefore not be multiplied by 12 or added to other symbol reports to create a portfolio result.
7. Strategy Tester Results
| Metric | USOIL M5 |
|---|---|
| Initial Deposit | $1,000.00 |
| Final Balance | $1,572.21 |
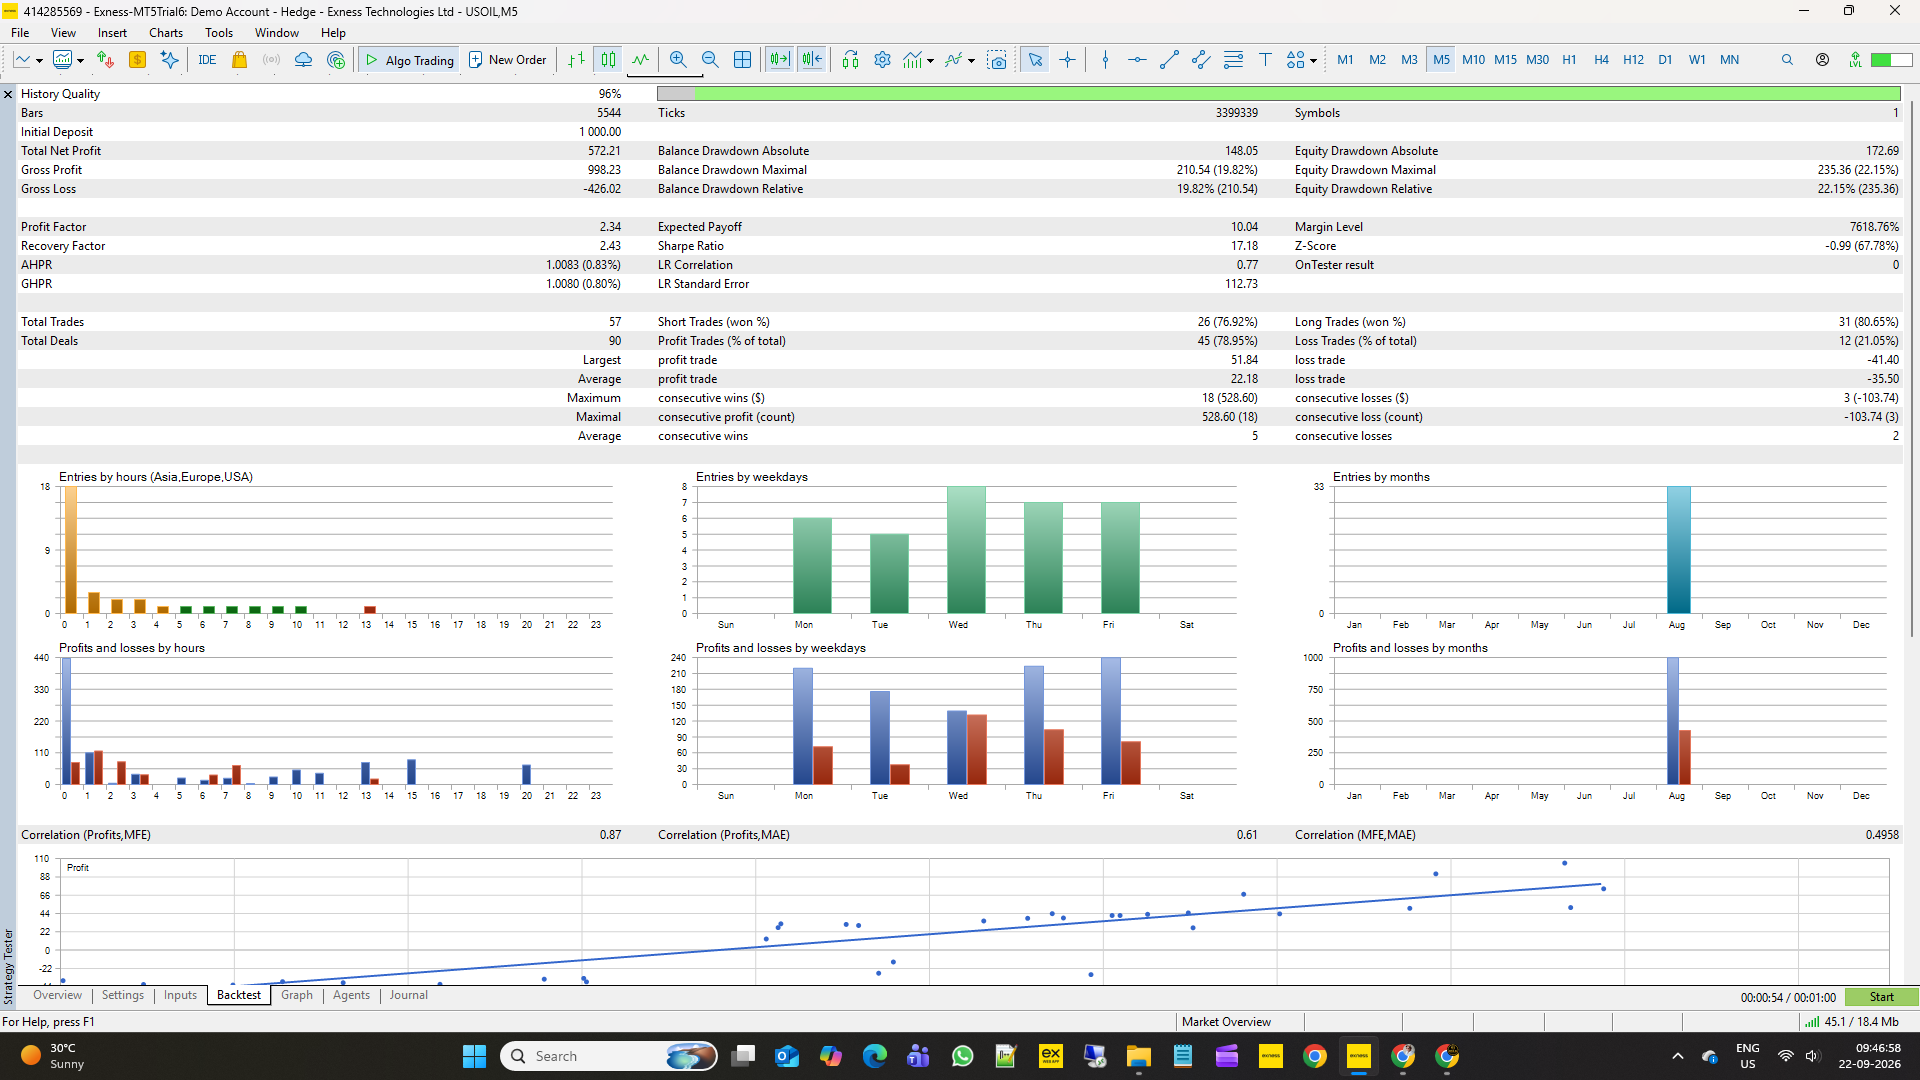
| Total Net Profit | $572.21 |
| Gross Profit | $998.23 |
| Gross Loss | -$426.02 |
| Profit Factor | 2.34 |
| Expected Payoff | $10.04 |
| Recovery Factor | 2.43 |
| Sharpe Ratio | 17.18 |
| Total Trades | 57 |
| Total Deals | 90 |
| Profit Trades | 45 (78.95%) |
| Loss Trades | 12 (21.05%) |
| Balance Drawdown Max | $210.54 (19.82%) |
| Equity Drawdown Max | $235.36 (22.15%) |
| Margin Level | 7618.78% |
| History Quality | 96% |
Additional Tester Statistics
- Largest Profit Trade: $51.84
- Largest Loss Trade: -$41.40
- Average Profit Trade: $22.18
- Average Loss Trade: -$35.50
- Maximum Consecutive Wins: 18 ($528.60)
- Maximum Consecutive Losses: 3 (-$103.74)
- Average Consecutive Wins: 5
- Average Consecutive Losses: 2
- Z-Score: -0.99 (67.78%)
- LR Correlation: 0.77
- LR Standard Error: 112.73
- AHPR: 1.0083 (0.83%)
- GHPR: 1.0080 (0.80%)
8. BUY / SELL Activity
| Direction | Trades | Winning Trades |
|---|---|---|
| SELL | 26 | 76.92% |
| BUY | 31 | 80.65% |
The tester recorded 57 total trades, consisting of 26 SELL trades and 31 BUY trades.
9. Historical Balance / Equity Curve
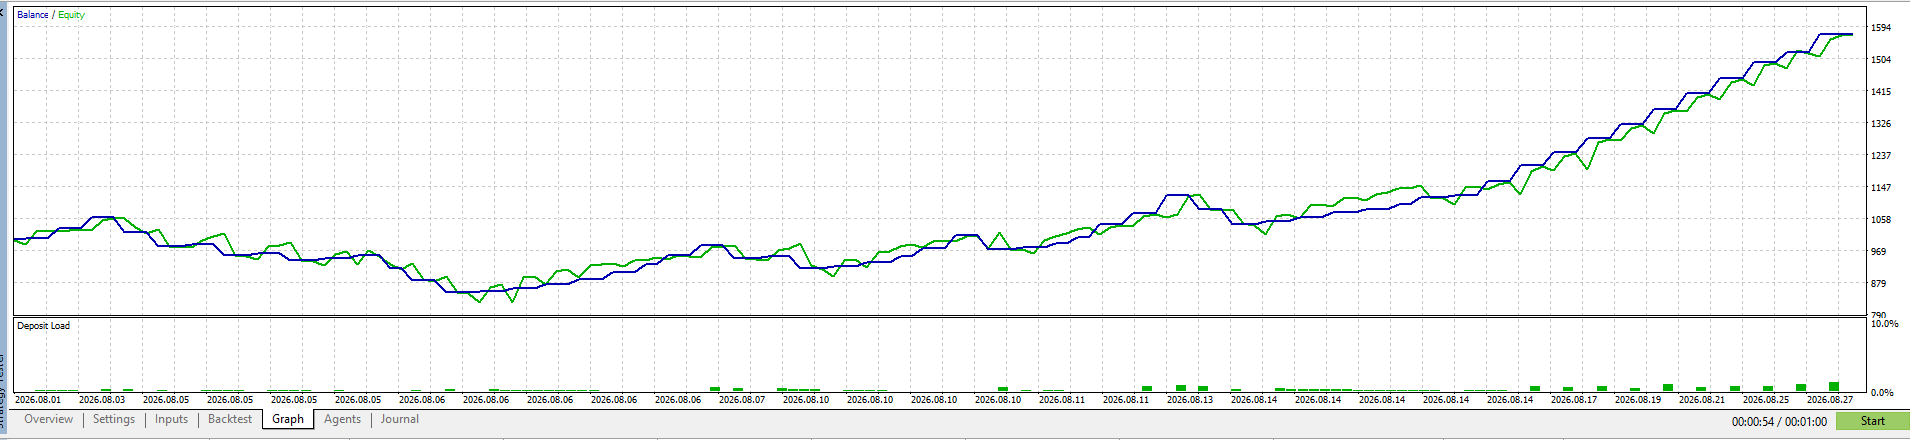
The Strategy Tester graph shows the balance and equity progression during the August 2026 test period.
The account began at $1,000 and finished at $1,572.21.
The graph also shows periods of drawdown and recovery during the test rather than a continuously rising balance.
Historical result only — not a forecast of future trading performance.
10. Strategy Tester Evidence
Test Settings
Insert the supplied USOIL Strategy Tester Settings screenshot here.
Strategy Tester Backtest Results
Insert the supplied USOIL Backtest Results screenshot here.
Input Configuration
Insert the supplied:
- USOIL Inputs 1
- USOIL Inputs 2
- USOIL Inputs 3
screenshots here.
Historical Equity Curve
Insert the supplied USOIL Graph screenshot here.
Journal Evidence
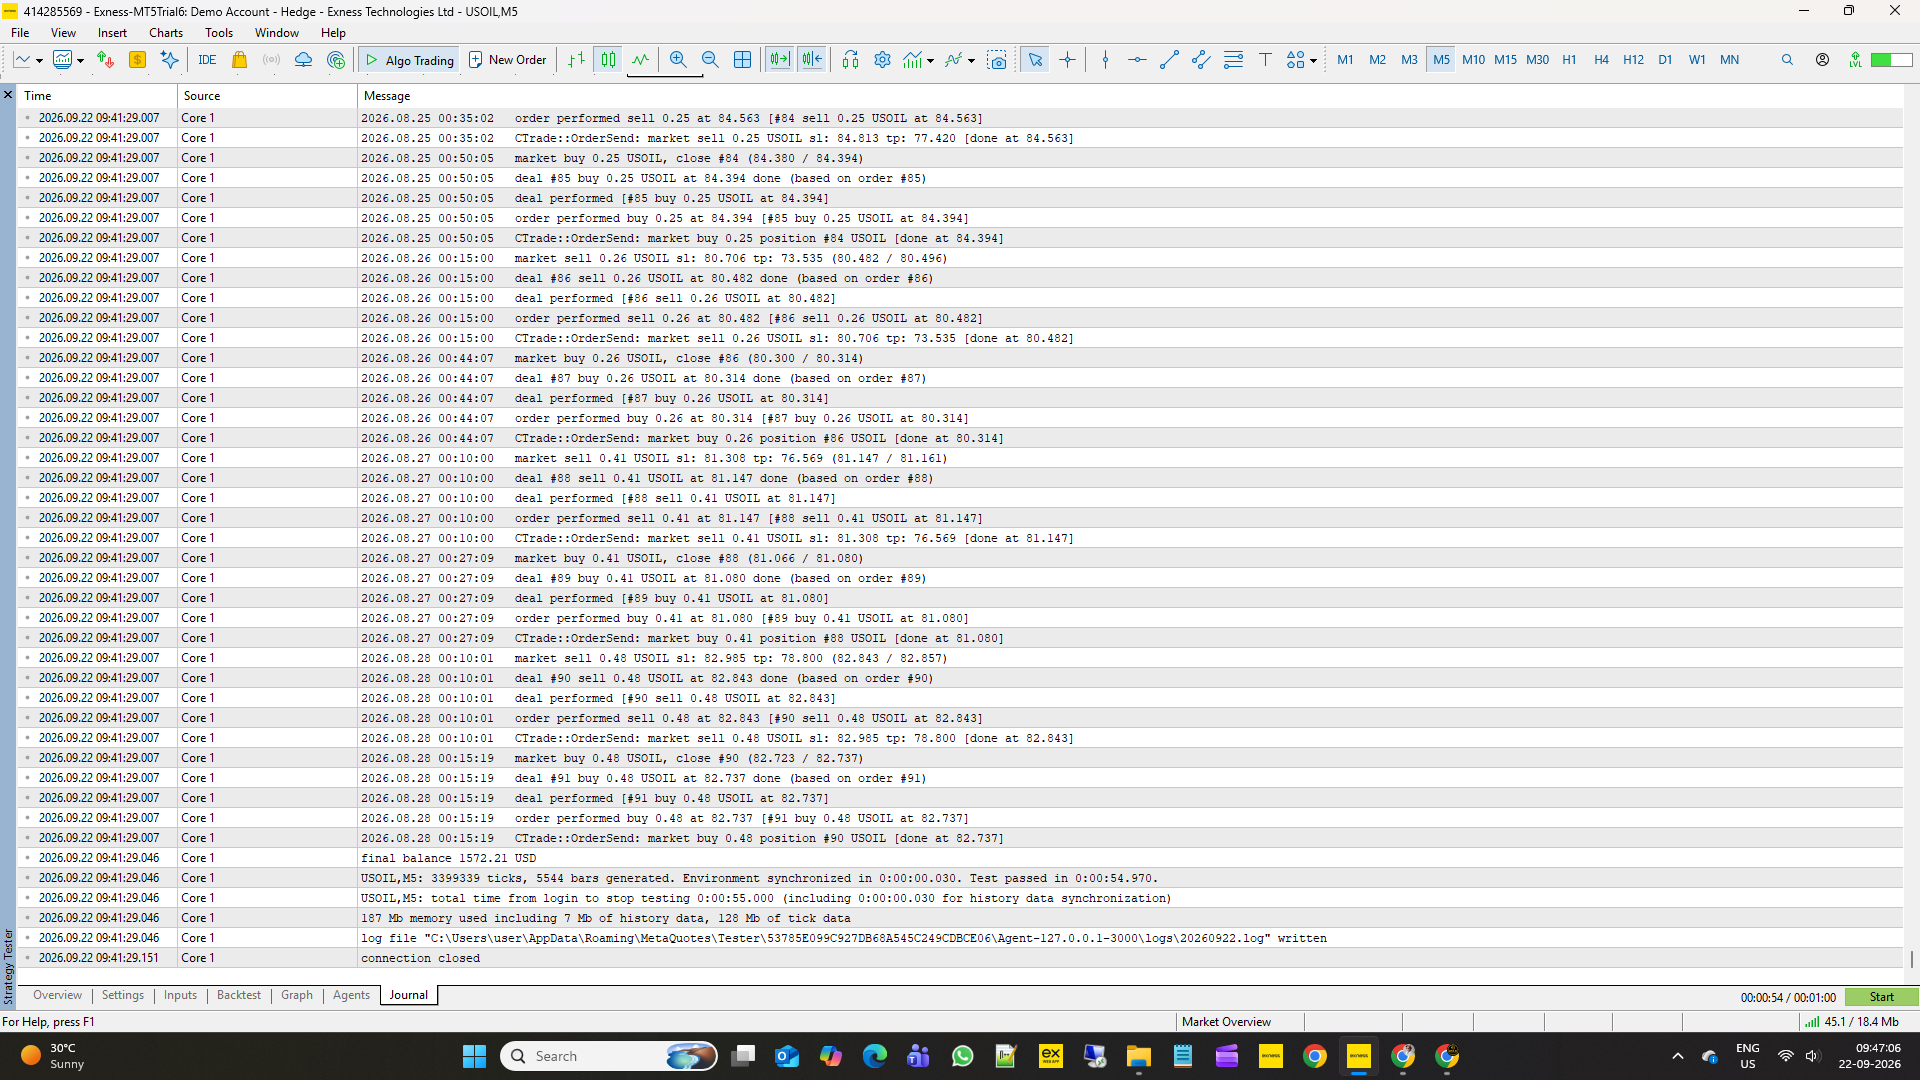
Insert the supplied USOIL Journal screenshot here.
The Journal confirms the final tester balance of $1,572.21 USD.
11. Reproduce the Test
The USOIL test can be reproduced in MetaTrader 5 using the same EA version, symbol, timeframe, test period and input configuration described in this report.
The Default .SET file used for the published Strategy Tester analysis is available free on request through MQL5 Private Chat.
Traders can also request configuration guidance for their own:
- Account capital
- Risk level
- Broker
- Symbol
- Timeframe
- Capital allocation
- Margin requirements
Tailor-made configuration and optimization assistance is available separately through MQL5 Private Chat.
12. 12-Symbol Strategy Tester Analysis Series
This USOIL study is part of the broader:
MSX AI Multi Symbol Scalper — 12-Symbol Strategy Tester Analysis Series
Open the complete 12-Symbol Strategy Tester Analysis Series
The series examines individual historical Strategy Tester results across multiple markets using the same general evaluation framework.
Current reference symbols include:
• BTCUSD • XAUUSD • USDJPY • USTEC • US500 • US30 • XAGUSD • ETHUSD • JP225 • USOIL • EURUSD • AUS200
For this series, each symbol is evaluated individually in MT5 Strategy Tester. The reference deployment uses one EA instance per symbol with Trade Both Side (BUY + SELL).
13. Historical Study Disclosure
This report is a historical MetaTrader 5 Strategy Tester study conducted on USOIL M5 for August 2026.
The results are dependent on the tested broker environment, historical tick data, spread conditions, execution delay, symbol specifications and the exact EA inputs shown in this report.
The Strategy Tester result does not represent live trading performance, does not guarantee future results and does not represent the performance of a complete multi-symbol portfolio.
The individual USOIL result should not be extrapolated or multiplied to estimate future portfolio returns.
14. At a Glance
Symbol: USOIL
Timeframe: M5
Period: August 2026
Initial Deposit: $1,000
Final Balance: $1,572.21
Net Profit: $572.21
Profit Factor: 2.34
Total Trades: 57
Winning Trades: 45 / 78.95%
Maximum Equity Drawdown: 22.15%
History Quality: 96%
Modelling: Every tick based on real ticks
Trade Direction: BUY + SELL
Hard Reversal Exit: ON
Partial Profit Management: ON
Per-EA Capital Allocation: 20%
MSX AI Multi Symbol Scalper v2.10
Professional Multi-Symbol, Multi-Timeframe & Flexible Portfolio Trading Expert Advisor for MetaTrader 5
View MSX AI Multi Symbol Scalper v2.10 on MQL5
#MSXAI
#USOIL #USOILTrading #CrudeOilTrading #WTICrude #USOILM5 #OilTradingEA #CrudeOilEA #USOILStrategy #OilMarketAnalysis #EnergyMarketTrading #CrudeOilStrategy