Temporal Spectra: How VISTmany Identifies Zones of Market Activation

Temporal Spectra: How VISTmany Identifies Zones of Market Activation
From Individual LAPs to Structured Timing Spectra
A single market timing can identify a specific future moment that deserves attention. However, VISTmany studies not only individual LAPs (Liquidity Activation Points), but also the way multiple LAPs form structured temporal groups.
These groups are called Temporal Spectra.
A is a concentration of future LAP timings within a defined temporal structure. Depending on how the LAPs are generated, VISTmany distinguishes between Horizontal Temporal Spectra and Vertical Temporal Spectra.
This distinction is important because different types of temporal concentration can describe different stages of market activation.

Horizontal Temporal Spectrum
A Horizontal Temporal Spectrum consists of several LAPs generated by the same timing interval and concentrated within a relatively close time region.
For example, consider a 7-minute LAP interval:
13:05 → 13:07 → 13:10
These are LAP timings generated within the same timing structure.
Instead of treating them as three completely independent timings, the group can be analysed as a 7-minute Horizontal Temporal Spectrum.
The important information is not only the existence of each individual LAP, but also:
• the number of LAPs in the spectrum;
• the distance between neighbouring LAPs;
• the beginning and end of the spectrum;
• the density of LAPs;
• the position of the current market relative to the spectrum;
• the direction associated with the LAPs;
• the expected movement associated with the timings.
A dense Horizontal Spectrum can therefore define a temporal area of increased attention, rather than a single exact minute.

Vertical Temporal Spectrum
A Vertical Temporal Spectrum is formed when LAPs from different timing intervals occupy the same or strongly overlapping temporal region.
For example, a market may simultaneously contain:
• LAP 60 minutes;
• LAP 40 minutes;
• LAP 15 minutes;
• LAP 7 minutes.
If the horizontal spectra generated by these different timing intervals converge in the same temporal region, the structures form a Vertical Temporal Spectrum.
The key feature is therefore not simply that several different LAP intervals exist.
It is that their temporal structures overlap or converge around the same future period.
This creates a multi-scale temporal concentration.
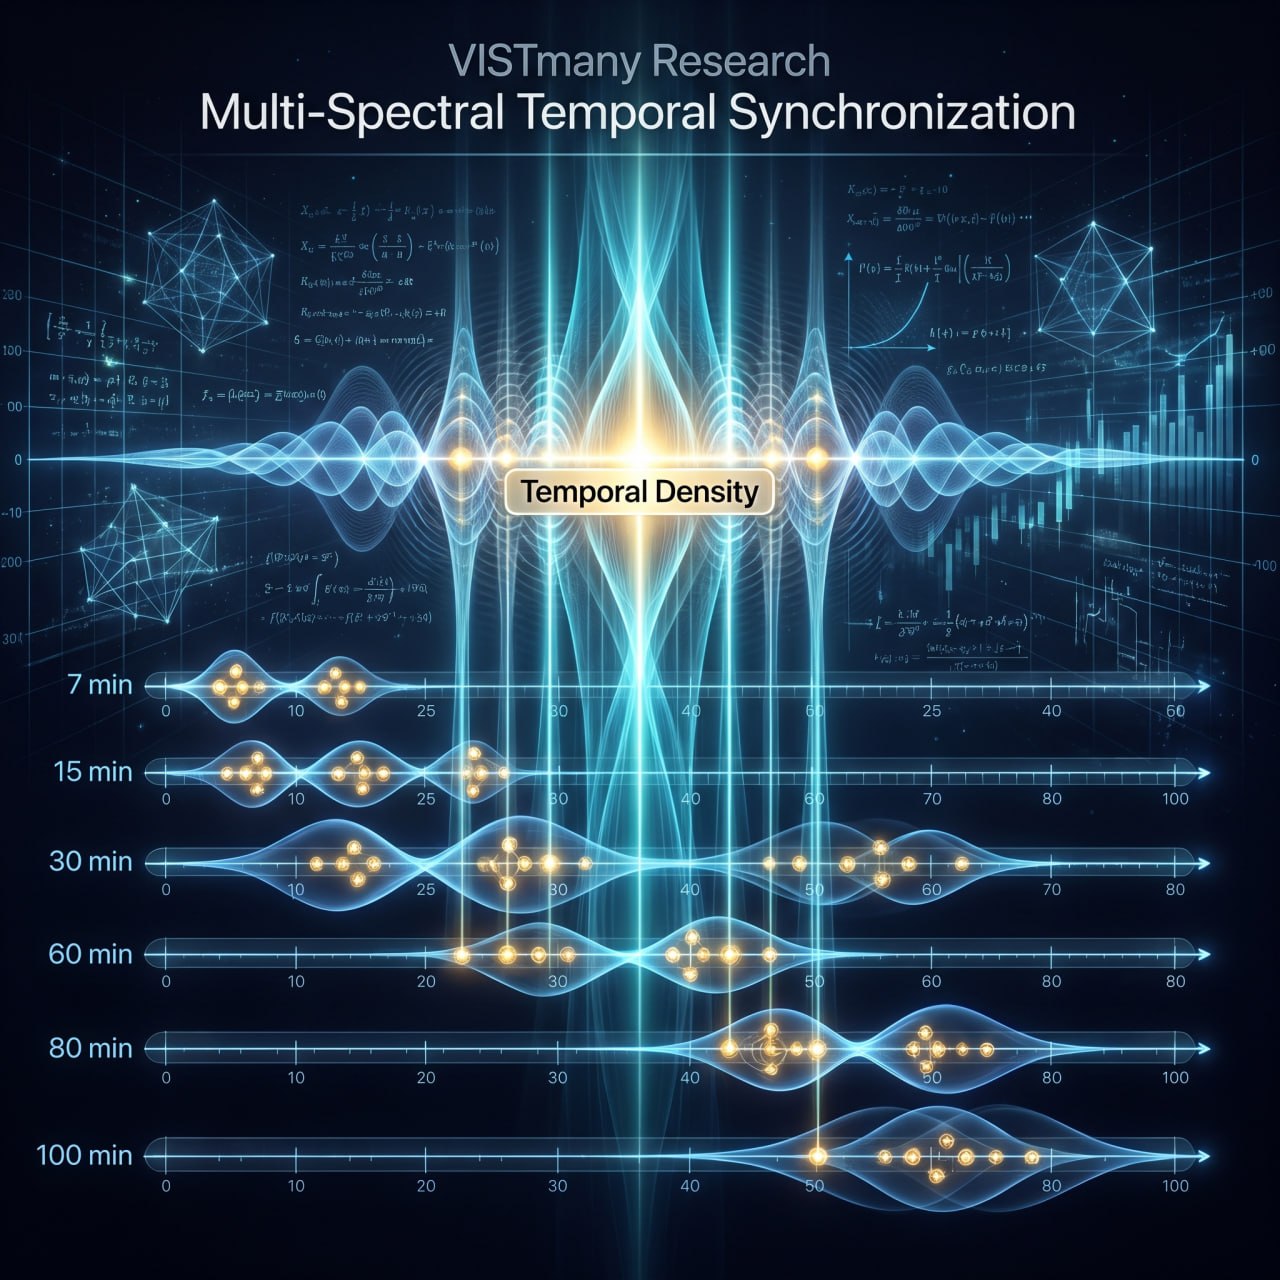
Multi-Scale Activation Zones
When Horizontal Spectra from several different LAP intervals converge in the same temporal region, the result can be viewed as a multi-scale zone of potential market activation.
For example:
60-minute spectrum
↓
40-minute spectrum
↓
15-minute spectrum
↓
7-minute spectrum
When these structures concentrate around the same future time region, the market is being observed simultaneously through several temporal scales.
The larger intervals provide broader temporal context.
The smaller intervals provide increasingly precise local structure.
This is one of the important ideas behind the VISTmany concept of Temporal Space: future market activity can be studied as a structured temporal environment rather than as a sequence of isolated signals.
Why the Vertical Spectrum Matters
A single 7-minute LAP may represent a local timing event.
A group of 7-minute LAPs may form a Horizontal Spectrum.
But when that spectrum is supported by overlapping structures from 15-, 40-, and 60-minute LAPs, the same temporal region contains information from several scales simultaneously.
Such a configuration can represent a strong potential activation zone.
It does not mean that price must move in a particular direction or that every LAP should be traded.
Instead, it identifies a future temporal region where the concentration of independently calculated timing structures deserves increased attention.
The direction, expected movement and price context must still be analysed.
Timing Direction and Price Context
Temporal Spectra should not be interpreted independently of price.
For example, a BUY-oriented spectrum should be studied together with the preceding price movement and current price structure.
Likewise, a SELL-oriented spectrum should be considered in relation to the preceding upward movement and the surrounding price structure.
The temporal spectrum answers primarily:
When is the market entering a concentrated timing structure?
Price analysis helps answer:
Where is the market positioned when that temporal structure becomes active?
This is the basis of the VISTmany Time + Price approach.
One-Week-Ahead LAP Forecast in iVISTscalp5
A fundamental feature of the VISTmany methodology is that iVISTscalp5 calculates LAP timing forecasts one full week ahead in MetaTrader 5.
For any supported financial instrument, the MT5 indicator calculates future timing structures for the coming week.
This means that Horizontal and Vertical Temporal Spectra can be studied before the corresponding market period occurs.
The forecast provides a forward-looking temporal map containing future LAPs, their timing intervals, direction and expected movement.
This is different from identifying a timing only after the corresponding price movement has already occurred.
Web Version of iVISTscalp5
The official VISTmany website also provides a web version of iVISTscalp5 for real-time timing analysis.
To avoid excessive server load, the web version calculates and displays timing forecasts one day ahead, rather than performing the full one-week-ahead MT5 calculation.
Therefore the two formats have different calculation horizons:
iVISTscalp5 in MT5:
1 week ahead
iVISTscalp5 web version:
1 day ahead
The underlying VISTmany concept remains the same: future LAP timings are calculated first, and subsequent market behaviour can then be observed in relation to those calculated temporal structures.
Temporal Spectra as Research Objects
Temporal Spectra allow VISTmany to move beyond the analysis of individual timings.
The research question becomes:
What happens when several future temporal structures begin to concentrate in the same region of time?
This makes it possible to study:
• temporal density;
• multi-scale synchronization;
• Horizontal Spectra;
• Vertical Spectra;
• activation zones;
• direction alignment;
• expected movement;
• price reaction;
• temporal expansion and decay.
A Temporal Spectrum is therefore not simply a collection of signals.
It is a structured configuration of future temporal coordinates.
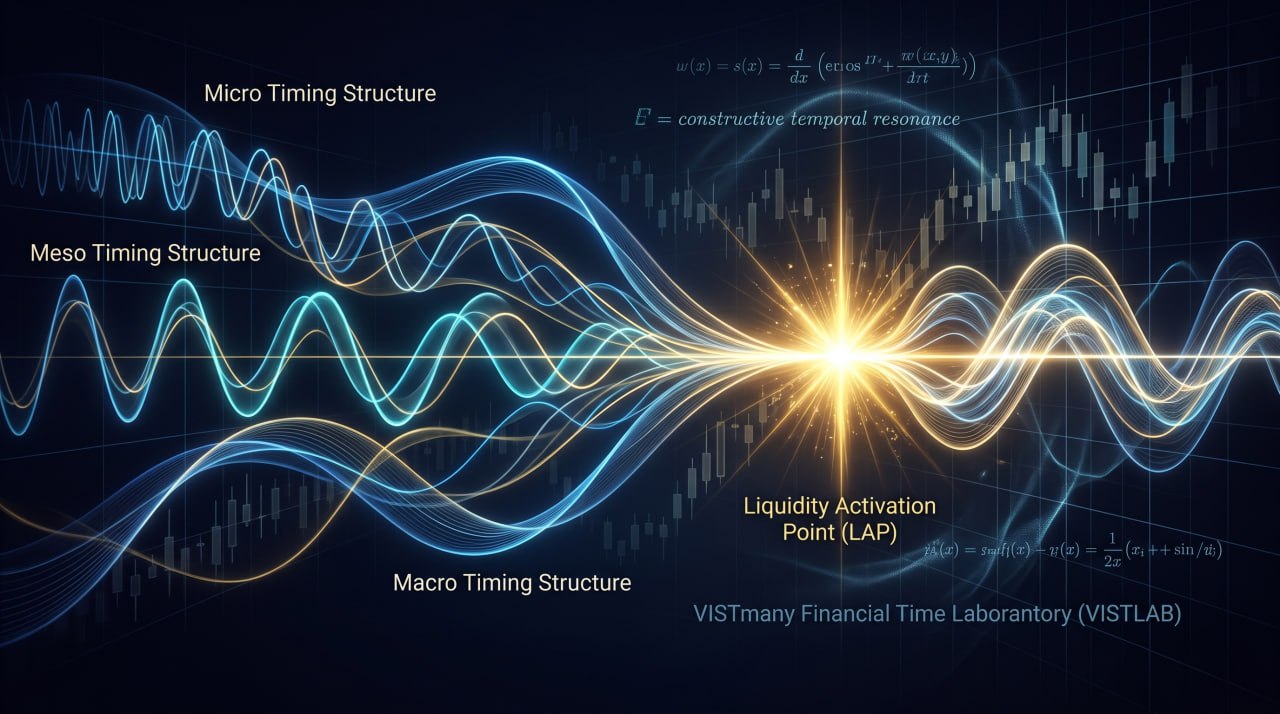
The VISTmany Principle
The central idea can be expressed simply:
One LAP identifies a future moment.
A Horizontal Spectrum identifies a concentrated timing structure.
A Vertical Spectrum connects different timing scales in the same temporal region.
A multi-scale convergence can define a stronger potential market activation zone.
And throughout the process, the trader remains responsible for interpreting price context and making the final decision.
Time identifies the opportunity window. Price shows the reaction.
Original publication: VISTmany Official Website.
This article was originally published on the official VISTmany website and is republished here for informational and research purposes.
Original source: https://vistmany.com/indicator