

Signalator Charts MT5 is a charting and trading utility for MetaTrader 5 that combines multiple chart types, chart-based trade planning, analytical overlays and professional visual customization in one interface.
It is part of the Signalator Trading and Analysis Ecosystem — a growing collection of practical MetaTrader tools for chart analysis, trade planning, risk control, account monitoring and trader workflow improvement.
Signalator Charts MT5 is designed for traders who want more than a standard MT5 chart. It allows you to work with Renko, Point & Figure, Kagi, Heikin Ashi and standard chart modes directly inside MetaTrader 5, while also providing trade controls, pattern tools, market structure tools and multiple chart appearance presets.
Signalator Charts MT5 - https://www.mql5.com/en/market/product/196824
Translations and User Guides
The complete Signalator Charts MT5 guide is available as a downloadable text guide in seven languages:
- Руководство на русском языке
- 中文用户指南
- Deutsche Bedienungsanleitung
1. What Signalator Charts MT5 Does
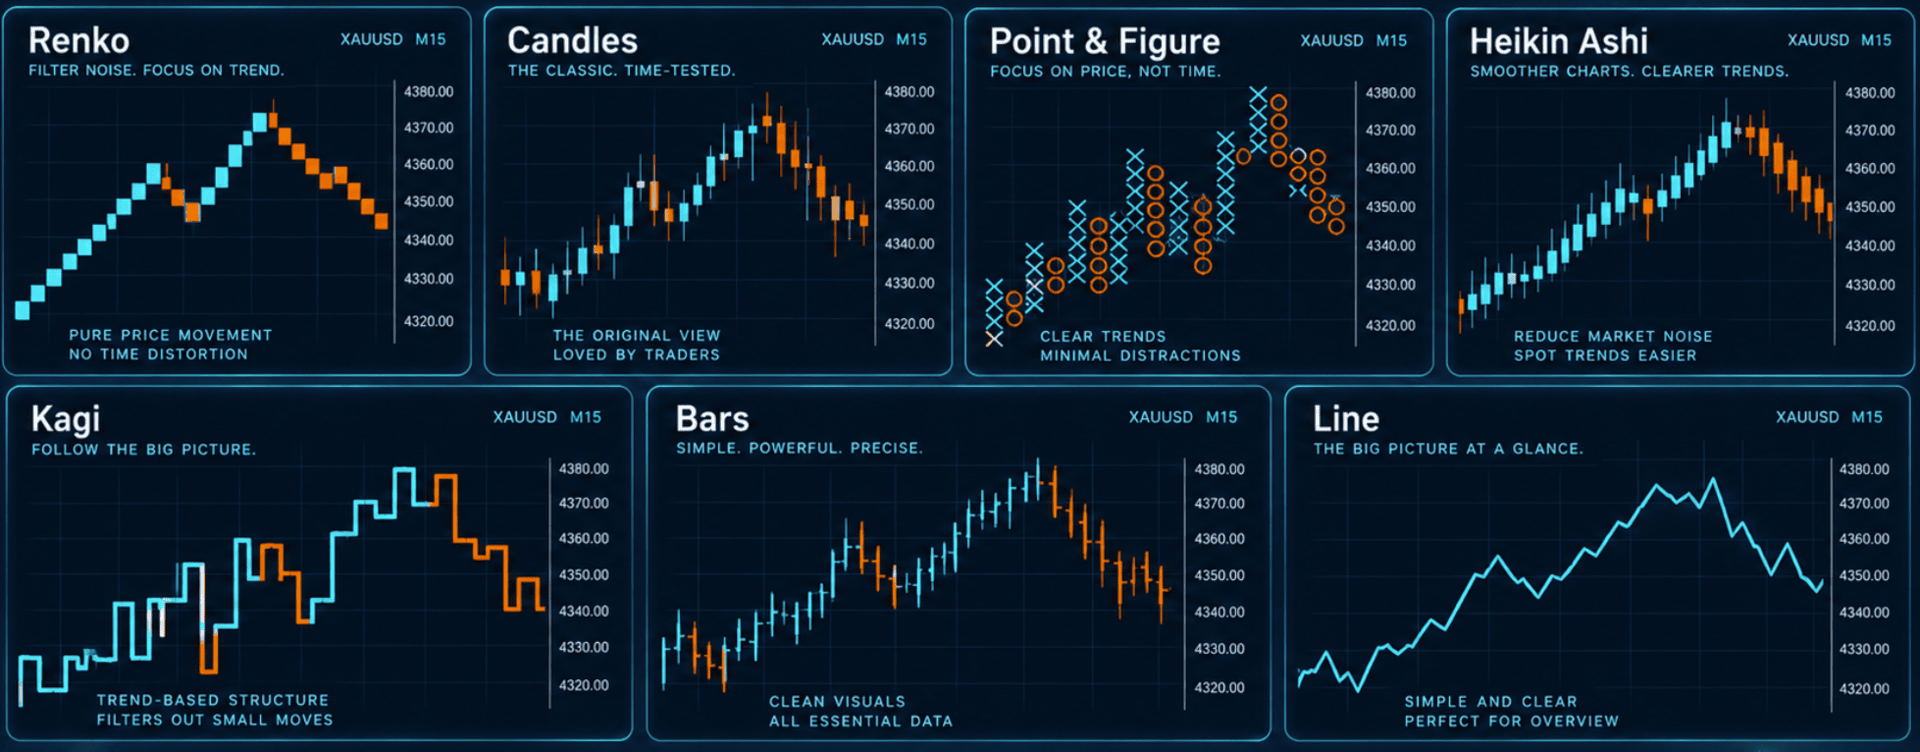
Signalator Charts MT5 gives you a flexible chart workspace directly on the chart. Instead of using several separate tools, you can switch between different chart types, adjust chart construction, apply visual presets, review analytical overlays and prepare trades from one integrated panel.
The product supports:
- Renko
- Candles
- Point & Figure / P&F
- Heikin Ashi
- Kagi
- Bars
- Line
For traders who prefer alternative price representation, this makes it possible to compare chart types and work with different analytical styles without leaving MT5.
2. Main Interface Structure
The left sidebar is the main navigation area. It gives fast access to the chart modules and utility sections.
Main sections:
- Renko
- Candles
- P&F
- Heikin Ashi
- Kagi
- Bars
- Line
- Trade
- Settings
Each chart section is organized into practical pages such as Setup, Style and View, so chart construction, appearance and on-chart information can be controlled separately.
The interface also supports Full and Tiny modes, which helps when using the utility on smaller screens, VPS environments or while keeping more chart space visible.
3. Renko Charts
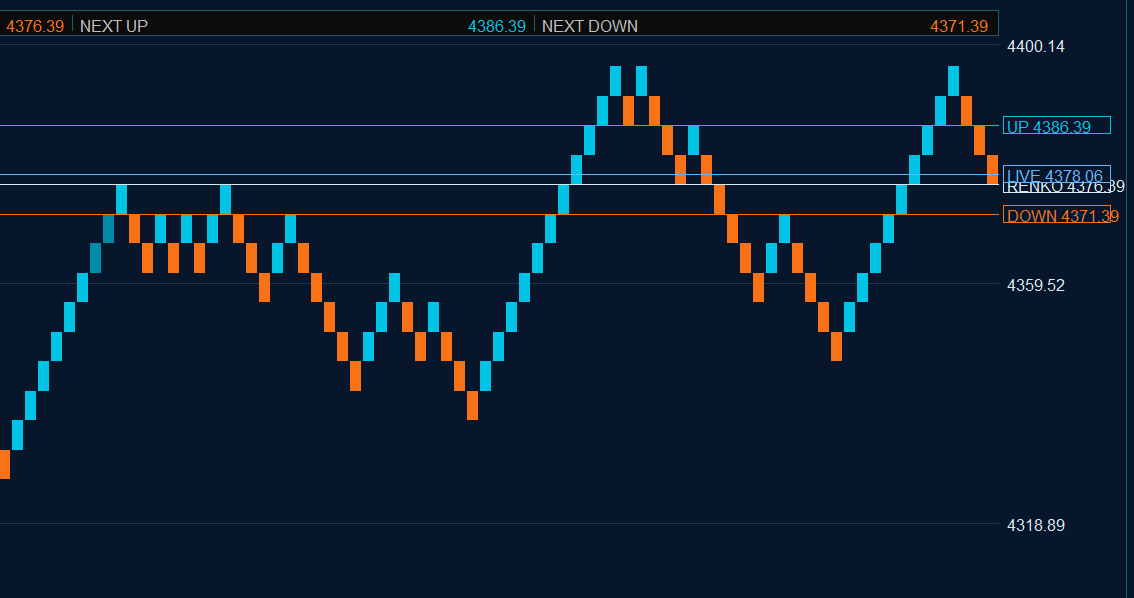
Renko is one of the main strengths of Signalator Charts MT5. Unlike a standard time-based chart, Renko focuses mainly on price movement. A new brick is created only after price has moved far enough to satisfy the selected brick and reversal rules.
Signalator Charts MT5 provides extensive control over how that Renko structure is constructed.
Source Data
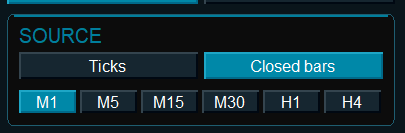
The Renko engine can use Ticks or Closed Bars.
With Tick source, incoming price updates are processed directly. With Closed Bars, Renko construction uses completed bars from the selected source timeframe.
Available source periods include M1, M5, M15, M30, H1 and H4.
The source timeframe is not a Renko timeframe. It determines how frequently completed source prices are supplied to the Renko engine.
For example, M5 source means that Renko construction is evaluated from completed M5 bars rather than from every individual tick. This can produce a different Renko structure because intrabar movements are not processed independently.
Brick Size
 |  |  |
|---|
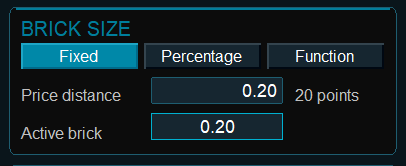
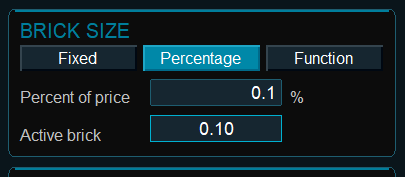
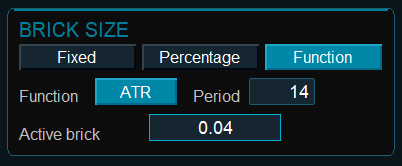
Signalator Charts MT5 supports several Renko sizing methods.
Fixed uses the same nominal price distance for every brick.
For example, if Gold uses a brick size of 5.00, the nominal grid advances in 5.00 price steps.
Percentage calculates the brick distance from the current price level. This allows the absolute Renko size to adapt as the instrument price changes.
Function uses ATR-based sizing. The selected ATR period determines the active brick distance from completed market data.
The interface shows the current Active Brick so the actual distance being used by the engine can be reviewed directly.
Reversal
 |  |
|---|
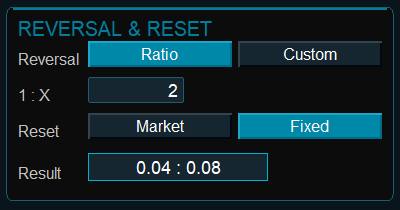
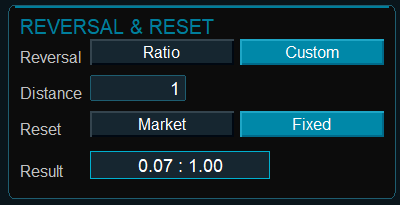
Continuation distance and reversal distance can be configured separately.
Ratio defines the reversal relative to the brick size.
For example, with:
Brick = 5.00
Reversal Ratio = 1:2
approximately 10.00 of opposite movement is required before the current Renko direction reverses.
Custom allows the reversal distance to be entered directly instead of using a fixed ratio.
For example:
Brick = 5.00
Custom Reversal = 12.00
This makes it possible to create Renko structures that do not follow a standard 1:1 or 1:2 relationship.
Fixed Reset and Market Reset
| market | fixed |
|---|---|
 |  |
This option determines how the Renko base is established after a brick trigger is reached.
Fixed Reset keeps construction aligned to the established Renko price grid.
For example, if the base is 4300 and the brick size is 5.00, the upward grid is:
4305 → 4310 → 4315 → 4320
If the next processed market price is 4317, the Renko structure still works through the predefined 5-point levels. The completed grid levels remain aligned to the fixed Renko structure.
This normally produces a more regular geometric chart with consistent nominal brick boundaries.
Market Reset still uses the Renko distance to decide when a movement is large enough to create a brick, but after the trigger is reached the new construction base follows the actual processed market price.
Using the same example, if the previous base is 4300, the brick size is 5.00 and the next processed price is 4317, the 4305 trigger has clearly been exceeded. With Market Reset, the new active Renko base can reset from the observed market price rather than remaining tied to the original 5-point grid.
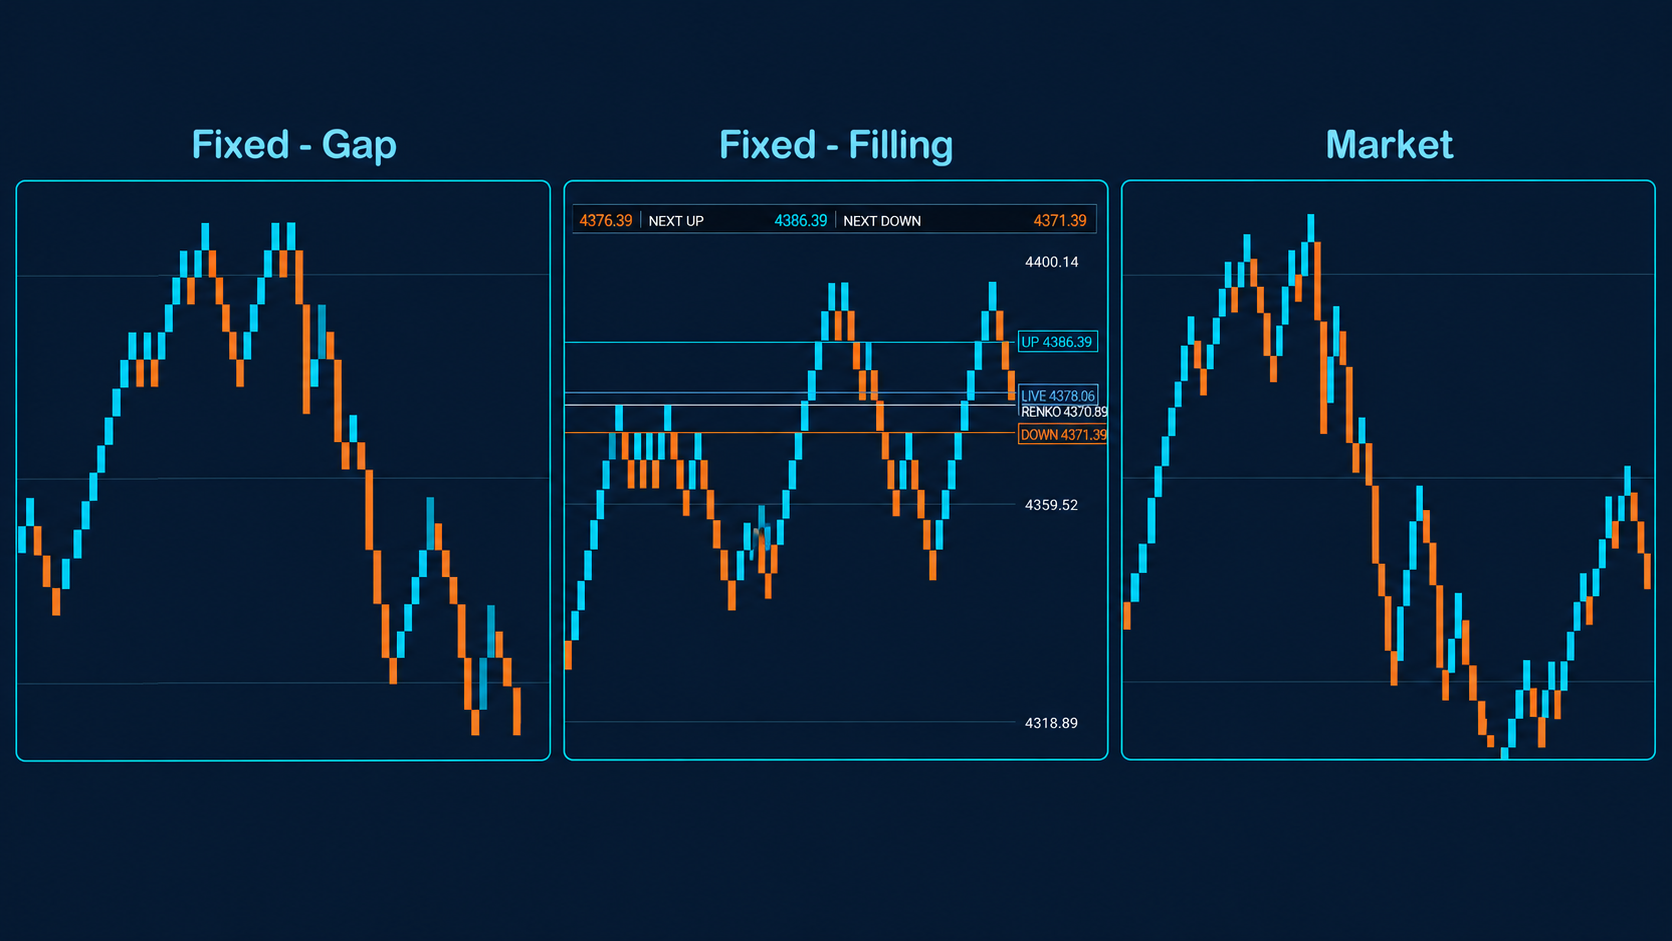
This is why Fixed Reset and Market Reset can produce visibly different Renko charts from exactly the same market data.
The difference becomes especially noticeable when:
- Closed Bars are used instead of Tick source
- the source timeframe is larger
- volatility is high
- price moves quickly through several brick distances
- market gaps occur
In simple terms:
Fixed Reset — preserve the Renko grid.
Market Reset — use the Renko distance as the trigger, then continue from the actual observed market price.
Fill Bricks and Gap
With Fixed Reset, the engine also allows you to choose how a movement that crosses several Renko levels during one source event is represented.
Suppose:
Brick = 5.00
Current Renko base = 4300
Next processed price = 4320
The move has crossed four nominal Renko levels:
4300 → 4305 → 4310 → 4315 → 4320
Fill Bricks creates each crossed Renko level as an individual brick.
The chart therefore displays the full nominal path:
4300 → 4305
4305 → 4310
4310 → 4315
4315 → 4320
This produces the traditional sequence of regular Renko bricks.
Gap compresses the same multi-brick movement into a larger visible movement instead of displaying every intermediate level as a separate synthetic brick.
The underlying movement is still represented, but the chart contains fewer individual bricks and keeps sudden jumps visually more compact.
This is why Fill Bricks and Gap can look dramatically different even when they are built from the same source prices.
The difference is particularly visible with:
- larger source timeframes
- small Renko brick sizes
- high-volatility instruments
- news moves
- market openings and gaps
With Tick source and continuous price movement, Fill and Gap may often look quite similar because price tends to cross each threshold progressively.
How Fixed / Market and Fill / Gap Relate
The construction modes can be understood as follows:
Fixed + Fill — preserve every crossed Renko grid level as an individual brick.
Fixed + Gap — preserve the fixed grid logic but compress multi-level jumps visually.
Market Reset — trigger using Renko distance and then continue from the actual observed market price.
Fill / Gap therefore applies to the fixed-grid construction where intermediate Renko levels exist explicitly.
Reset Schedule
The Reset Schedule is different from Fixed / Market Reset.
Fixed / Market controls how individual Renko movements establish their next calculation base.
The schedule controls when an entirely new Renko construction segment begins.
Available modes are:
Continuous — construction continues without a scheduled reset.
Daily — a new Renko segment begins each day at the selected server hour.
Weekly — a new Renko segment begins at the weekly reset boundary.
Historical Renko bricks remain available; the scheduled reset changes the active construction state for the new segment.
Initial Anchor
The anchor determines the starting reference from which the initial Renko grid is established.
Automatic lets the engine determine the starting reference from available market data.
Grid Aligned aligns the initial reference to the Renko price grid.
Manual allows an exact starting price to be entered.
The anchor can affect the complete Renko structure because changing the starting grid changes the location of every subsequent fixed Renko level.
For example, a 5-point grid starting at 4300 produces:
4300, 4305, 4310, 4315...
while the same 5-point grid starting at 4302 produces:
4302, 4307, 4312, 4317...
History and View Controls
The Renko View section allows the constructed chart to be inspected without changing its underlying construction.
Available information includes:
- Live Price
- Last Closed
- Next Up
- Next Down
- current direction
- loaded history
- visible brick count
- grid
- price axis
- time axis
Next Up and Next Down show the active continuation and reversal trigger levels according to the current Renko configuration.
The amount of loaded history and the number of bricks currently displayed are controlled separately. The chart can also be dragged horizontally to inspect older Renko history.
Additional Renko Tools
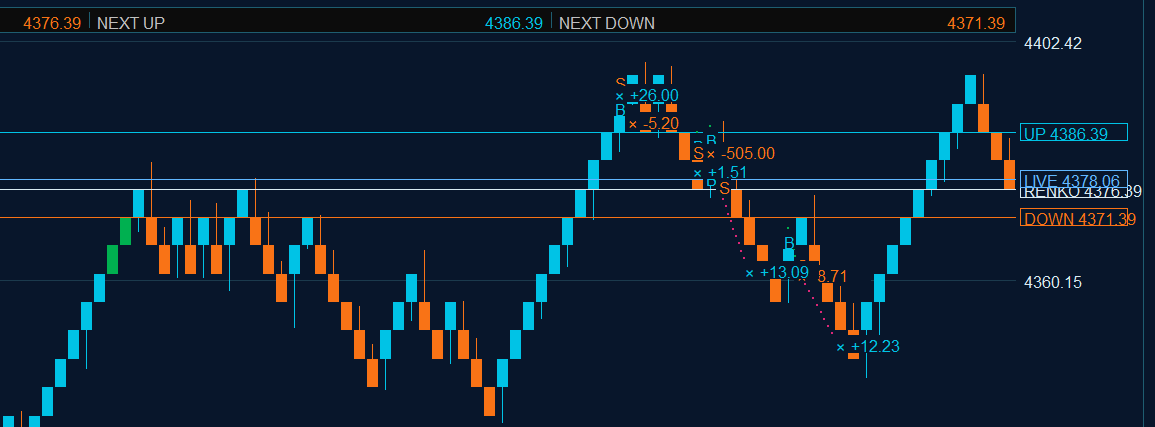
Renko also supports optional visual and analytical layers including:
- Wicks
- Recent Trades
- Renko Market Structure
These overlays can be enabled or disabled without changing the underlying Renko construction.
4. Point & Figure, Kagi and Heikin Ashi
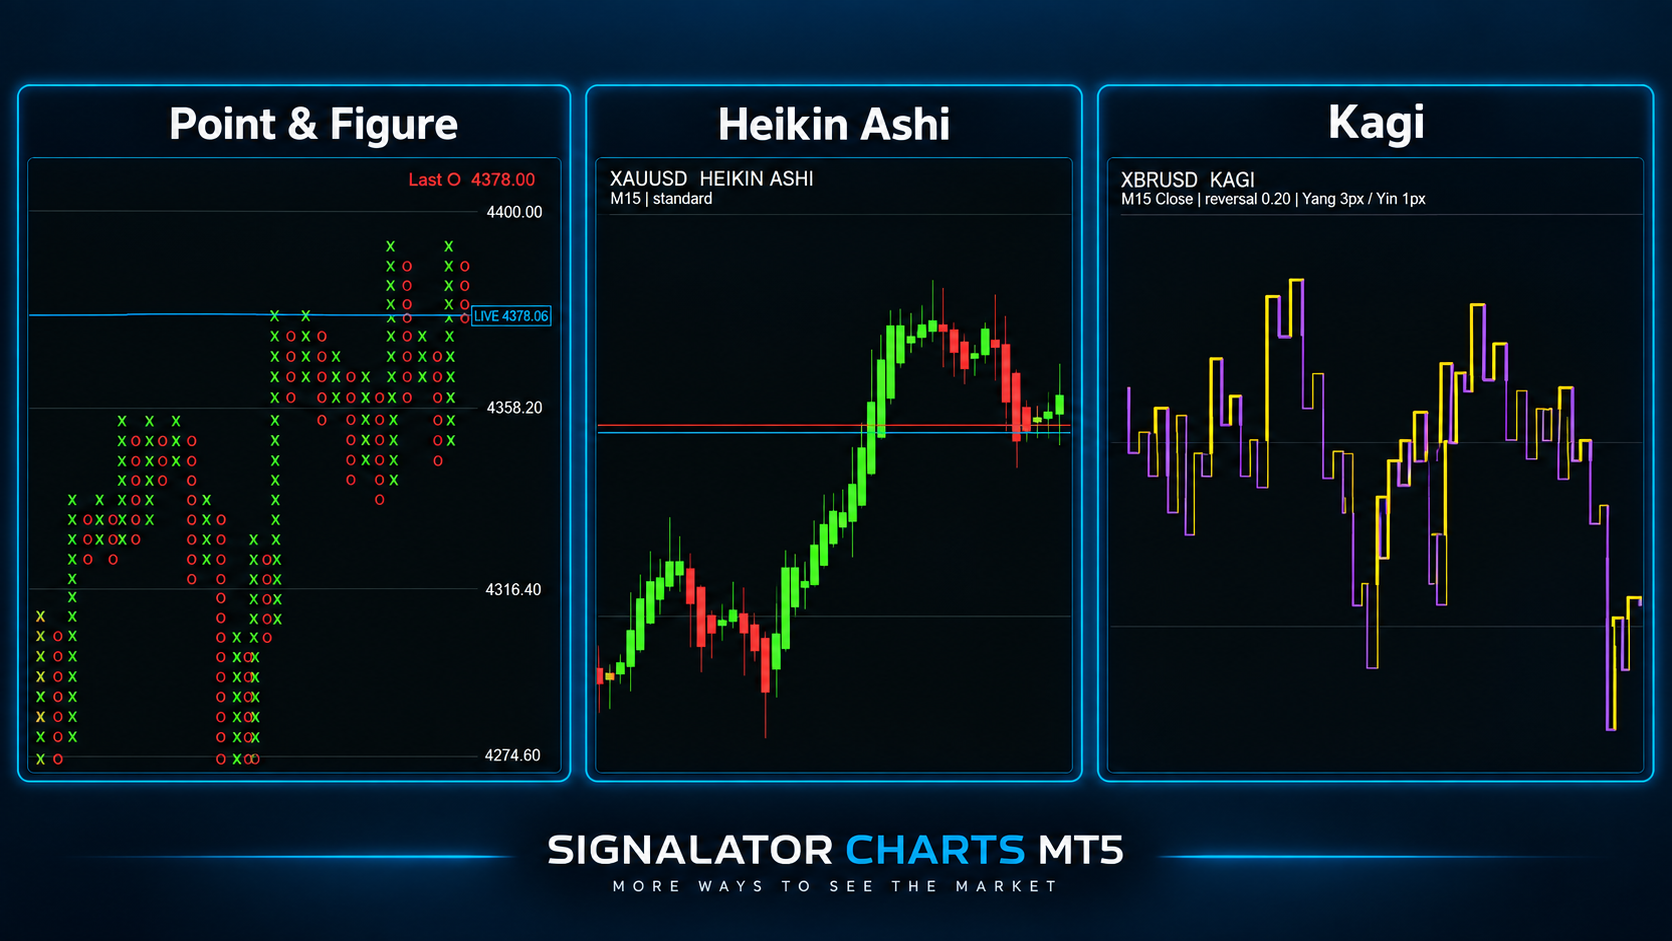
Signalator Charts MT5 is not limited to Renko. It also provides several alternative chart representations for traders who want different views of price structure.
Point & Figure includes:
- Tick or Closed Bars source
- Close or High-Low processing
- Fixed or Percentage box sizing
- Configurable reversal boxes
- Continuous, Daily or Weekly reset schedule
- Hover diagnostics and live / last values
Point & Figure organizes price movement into rising X columns and falling O columns. Time is secondary: a new column is created only after price reverses by the configured number of boxes.
Kagi includes:
- Tick or Closed Bars source
- Close or High-Low processing
- Fixed or Percentage reversal
- Rising and falling segments
- Yang / Yin behaviour
- Shoulder and waist logic
- Continuous, Daily or Weekly reset options
Kagi focuses on meaningful price reversals instead of fixed time periods. Line direction and thickness help visualize changes in the underlying price structure.
Heikin Ashi includes:
- Standard Heikin Ashi formulas
- Live current-bar updates
- Style and view controls
- Hover diagnostics
Heikin Ashi recalculates candle values from current and previous OHLC information to produce a smoother representation of price movement than standard candles.
5. Standard Chart Modes
For traders who also want to keep native chart styles available, Signalator Charts MT5 includes standard chart modes:
- Candles
- Bars
- Line
These chart types include easy timeframe switching directly from the panel. Candles, Bars and Line modes use normal MT5 chart data while remaining integrated with the Signalator interface and visual presets.
6. Analytical Overlays
Signalator Charts MT5 includes optional analytical tools that can be enabled only when needed. They are analytical overlays and do not change the underlying chart construction.
Candlestick Patterns
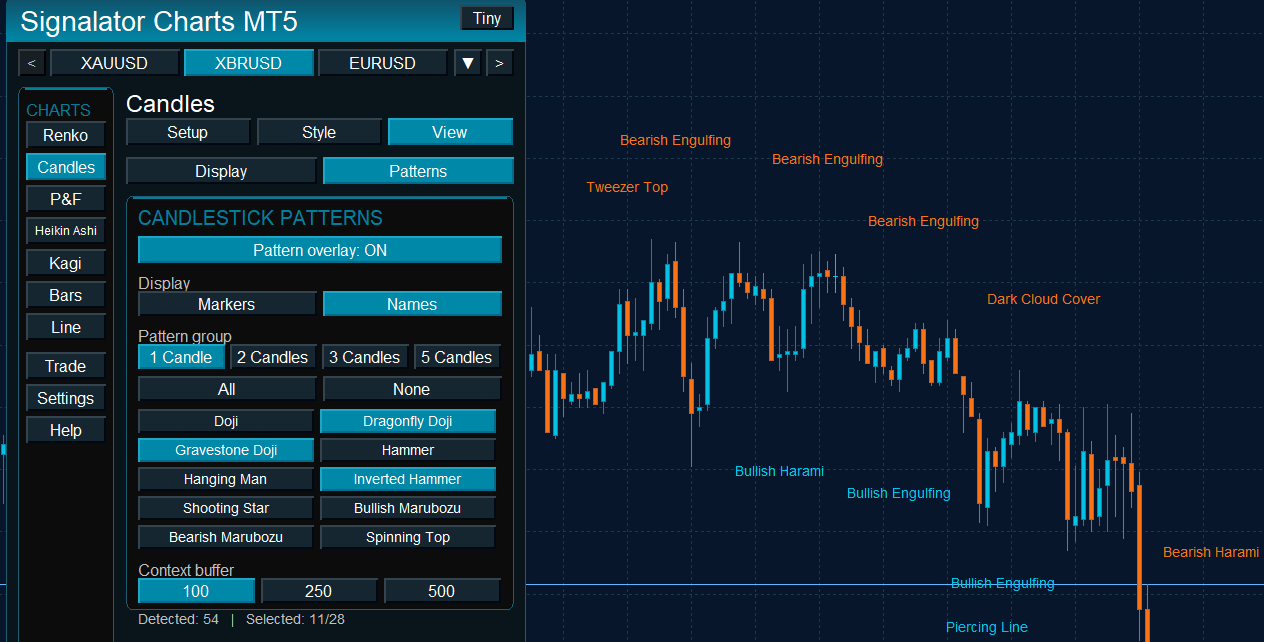
The Candlestick Patterns module analyzes completed candles and can automatically identify a selection of commonly used one-candle and multi-candle formations.
The current pattern library contains 28 formations covering single-candle, two-candle, three-candle and larger structures.
Patterns can be filtered by group and direction, allowing bullish, bearish and neutral formations to be enabled or disabled independently.
Display options include:
- Pattern Markers
- Pattern Names
- Bullish patterns
- Bearish patterns
- Neutral patterns
- Pattern group selection
For reversal-type formations, the module also considers recent candle context rather than treating every isolated candle shape as an automatic reversal signal.
To reduce clutter, when several formations qualify on the same completed candle the module displays the highest-priority matching pattern rather than stacking many names on top of each other.
Pattern analysis follows the visible chart area, so scrolling or zooming updates the displayed pattern markers while historical candle data remains unchanged.
The pattern module is an analytical aid only. A detected candlestick formation is not automatically a trading signal and should be considered together with market context, structure and risk management.
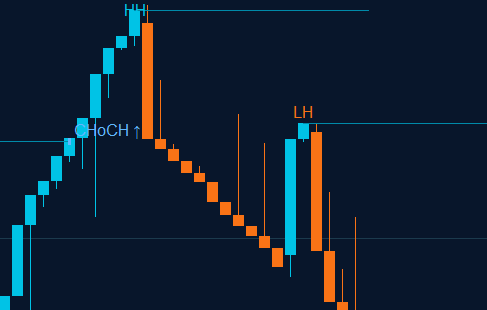
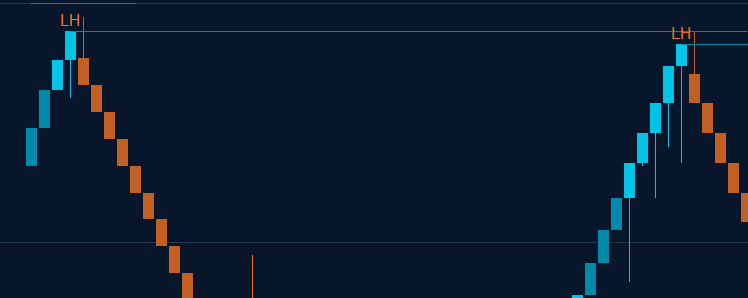
Renko Market Structure
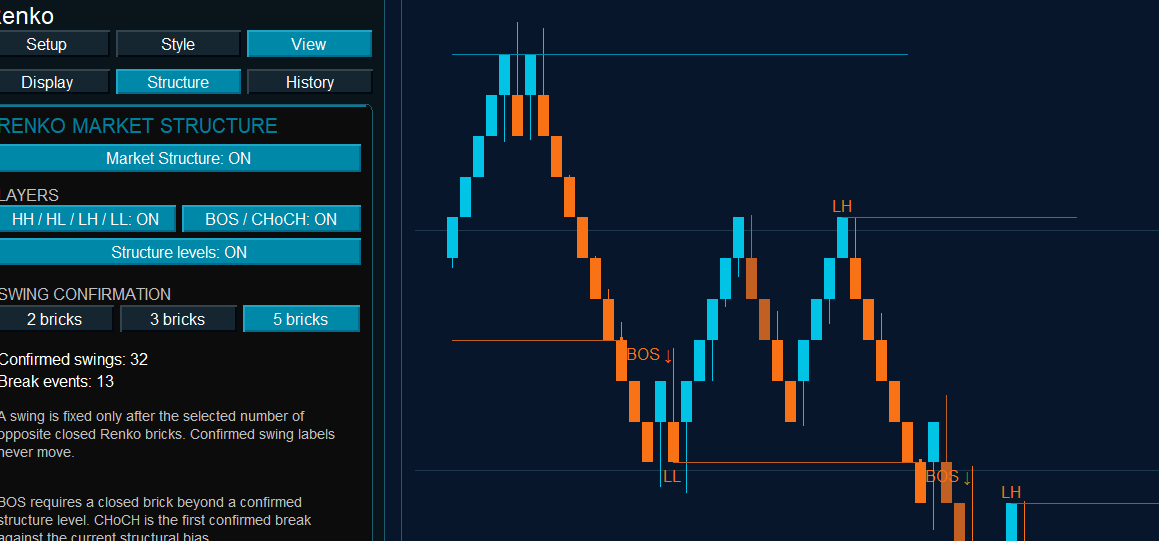
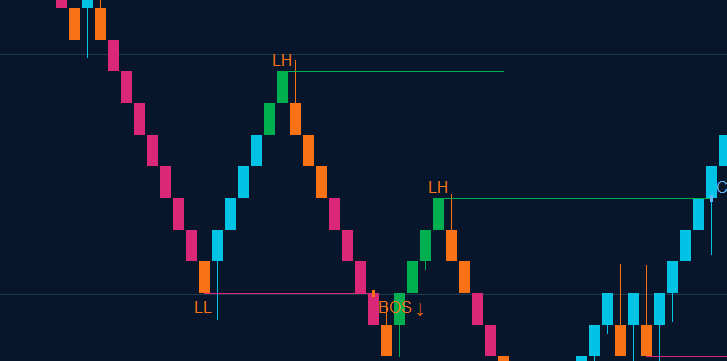
The optional Renko Market Structure module analyzes confirmed closed Renko bricks and can display:
- HH — Higher High
- HL — Higher Low
- LH — Lower High
- LL — Lower Low
- BOS — Break of Structure
- CHoCH — Change of Character
Swing points are confirmed only after the configured structure conditions are satisfied. This helps avoid moving an already confirmed structural pivot every time a new brick appears.
BOS is used to identify a confirmed break in the direction of the active structure, while CHoCH highlights the first confirmed break against the existing structural direction.
The structure layer can display swing labels, structure events and active levels separately.
Like the pattern module, Renko Market Structure is an optional analytical layer and does not change the underlying Renko brick construction.
7. Chart Style Presets and Visual Customization
Signalator Charts MT5 includes a set of professional chart style presets so traders can quickly switch between different visual environments.
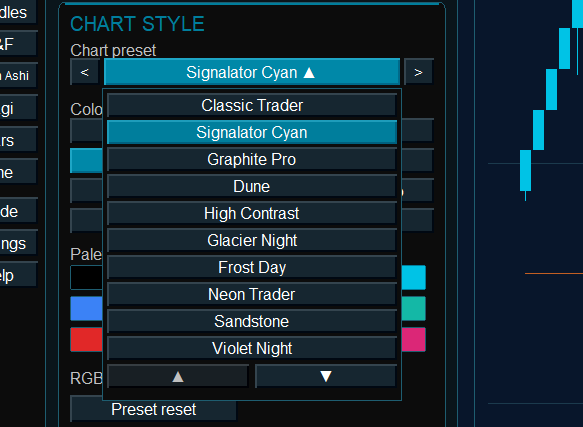
The product currently includes 20 global chart presets, including styles such as:
- Classic Trader
- Signalator Cyan
- Graphite Pro
- Dune
- High Contrast
- Glacier Night
- Frost Day
- Violet Night
- Forest
- Midnight Gold
Presets do not change only the background. They control the complete chart appearance including background, grid, text, candle or brick colours, bullish and bearish elements, accents and related visual components.
However, the presets are only a starting point. Most chart colours can also be adjusted manually, allowing you to create your own chart appearance instead of using one of the predefined combinations.
| Depending on the selected chart type, you can customize visual elements such as: - Chart background | 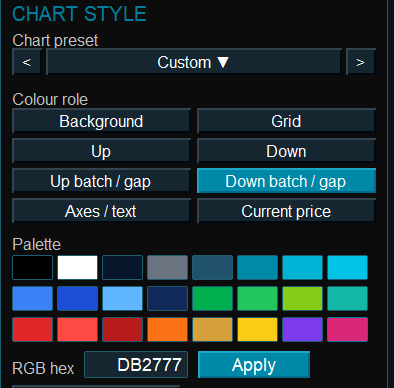 |
|---|
This means you can select a preset and then modify individual colours to create your own custom style.
Where volume is displayed, volume styling is also integrated with the selected chart appearance and can be adjusted separately.
The chart preset and the main interface theme are independent. For example, you can use the Dark interface together with a light chart, a high-contrast chart or your own custom colour combination.
Presets can be switched using the drop-down menu or the left and right arrows, while individual chart colours can be changed from the Style section.
8. Integrated Trade Module
 |  |
|---|
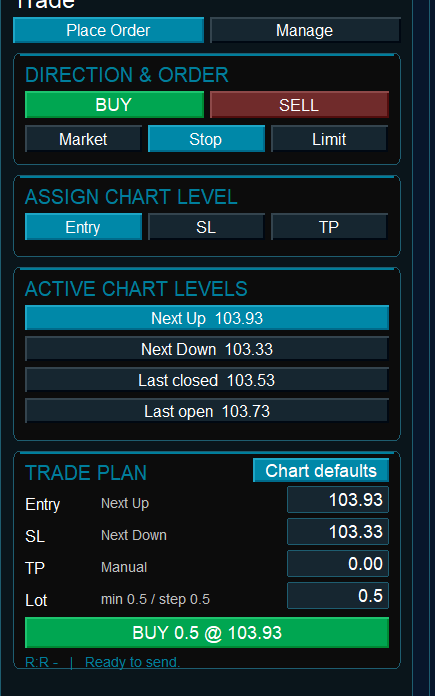
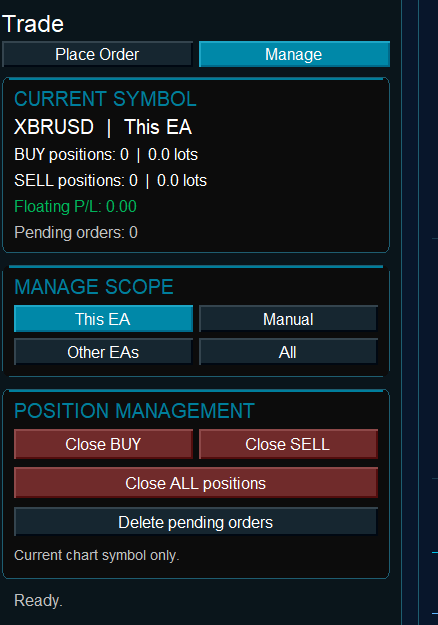
Signalator Charts MT5 is not only for viewing charts. It also includes an integrated Trade module designed for chart-based trade preparation and quick execution.
Main trade capabilities include:
- Market and Pending trading modes
- Buy and Sell actions
- Pending Stop and Limit selection
- Editable Entry, SL, TP and Lot fields
- Automatic chart-derived defaults where applicable
- Chart-based default levels for Renko and other structures
- Basic trade management controls
- Management scope selection
Depending on the selected chart type and available structural levels, the Trade module can automatically populate suggested Entry, Stop Loss or Take Profit values from the current chart.
The values remain editable, allowing the trader to use the chart-derived level directly or replace it with a manual price.
Before an order is sent, broker trading rules, symbol settings and order validity are checked through MT5.
The goal is not to replace every function of a dedicated trade-management product, but to provide a fast on-chart workflow for preparing and executing trades from the current chart structure.
9. Symbol Switching and Workflow Convenience
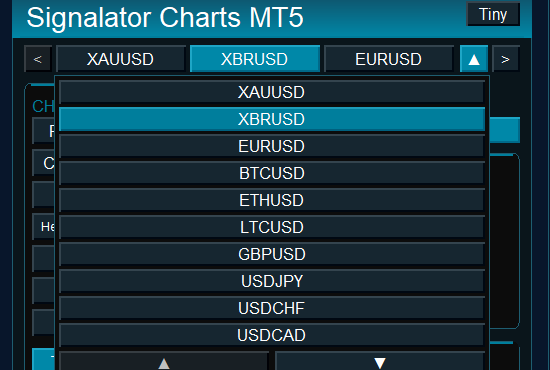
Signalator Charts MT5 includes integrated symbol switching from Market Watch.
The symbol strip provides quick access to frequently visible Market Watch instruments, while the symbol selector allows another available instrument to be selected directly from the panel.
This makes it possible to move between instruments without leaving the Signalator workspace.
The chart type, interface mode and other relevant workspace settings are retained where applicable when changing symbols.
10. Languages and Interface Themes
The interface supports seven languages:
- English
- Spanish
- Russian
- Chinese
- Japanese
- Portuguese
- German
Signalator Charts MT5 also includes several interface themes:
- Dark
- Light
- Dune
The interface theme controls the application panel itself, while chart presets control the visual appearance of the chart.
11. Full and Tiny Interface Modes
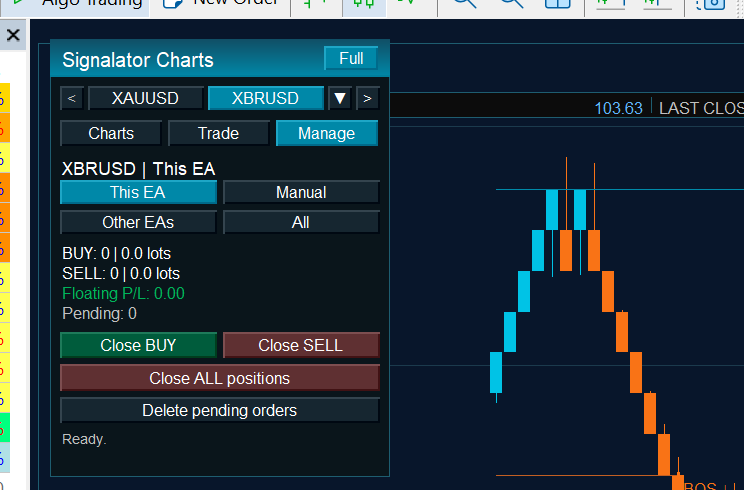
The normal Full interface provides access to the complete chart setup, style, view, trading and settings controls.
Tiny Mode is designed for situations where the trader wants to keep more chart area visible.
It provides compact access to important chart, trade and position-management functions while occupying considerably less screen space.
Tiny Mode can also be moved around the chart and used when working on smaller monitors, laptops or VPS desktops.
12. How to Start
The simplest way to begin is:
1. Attach Signalator Charts MT5 to any chart.
2. Choose the required chart type from the left sidebar.
3. Open Setup and configure chart construction.
4. Open Style and choose a chart preset or visual setup.
5. Open View and enable the information or analytical overlays you want to see.
6. Drag custom charts horizontally when you want to inspect older constructed history.
7. Use Trade when you want to prepare or manage trades directly from the chart.
8. Use Settings to select the interface theme and language.
13. Who This Product Is For
Signalator Charts MT5 is designed for traders who want:
- alternative chart representations inside MT5
- advanced Renko construction options
- Point & Figure and Kagi analysis
- multiple chart types in one interface
- chart-based trading workflow
- candlestick pattern analysis
- Renko market structure analysis
- fast visual customization
- compact and full interface modes
- multi-language support
14. Final Notes
Signalator Charts MT5 is a practical charting and trading workspace designed to provide different ways of viewing price while keeping chart configuration, analysis and trade preparation inside MetaTrader 5.
Alternative charts such as Renko, Point & Figure and Kagi are constructed representations of market data. Different source periods, sizing methods, reset rules, anchors and reversal settings can therefore produce different chart structures from the same underlying market.
Analytical tools such as Candlestick Patterns and Renko Market Structure are provided for chart analysis and should not be interpreted as guaranteed trading signals.
The application performs its main chart calculations and interface functions locally inside MetaTrader 5 and does not rely on external servers for normal operation.