One Drawdown Day Does Not Define a System: What Two Unseen Test Months Show

Breakouter X6 Portfolio – product page and free Strategy Tester demo:
Breakouter X6 Portfolio
Public Minimum Lot real-money account:
Breakouter – Minimum Lot Live Signal
Public experimental High Risk account:
Breakouter High Risk Experimental – Live Signal
On Friday, 11 September 2026, Breakouter experienced a drawdown day. Such days are unpleasant and should be documented transparently. However, they are part of every trading strategy that accepts genuine market risk.
One losing day is neither meaningless nor a complete assessment of a trading system. It is one data point within a longer history. The right response is therefore not to play it down, but to evaluate it in context.
To provide that context, I examined July and August 2026 as two separate months. These periods were not used during the development or calibration of the system and were previously unseen for this examination. The tests also included a simulated execution delay of 500 ms.
Important: The live drawdown on 11 September and the backtests shown here are separate observations. Historical tests do not prove that the current live performance will develop or recover in the same way. They illustrate why short-term results can vary substantially in a rule-based portfolio.
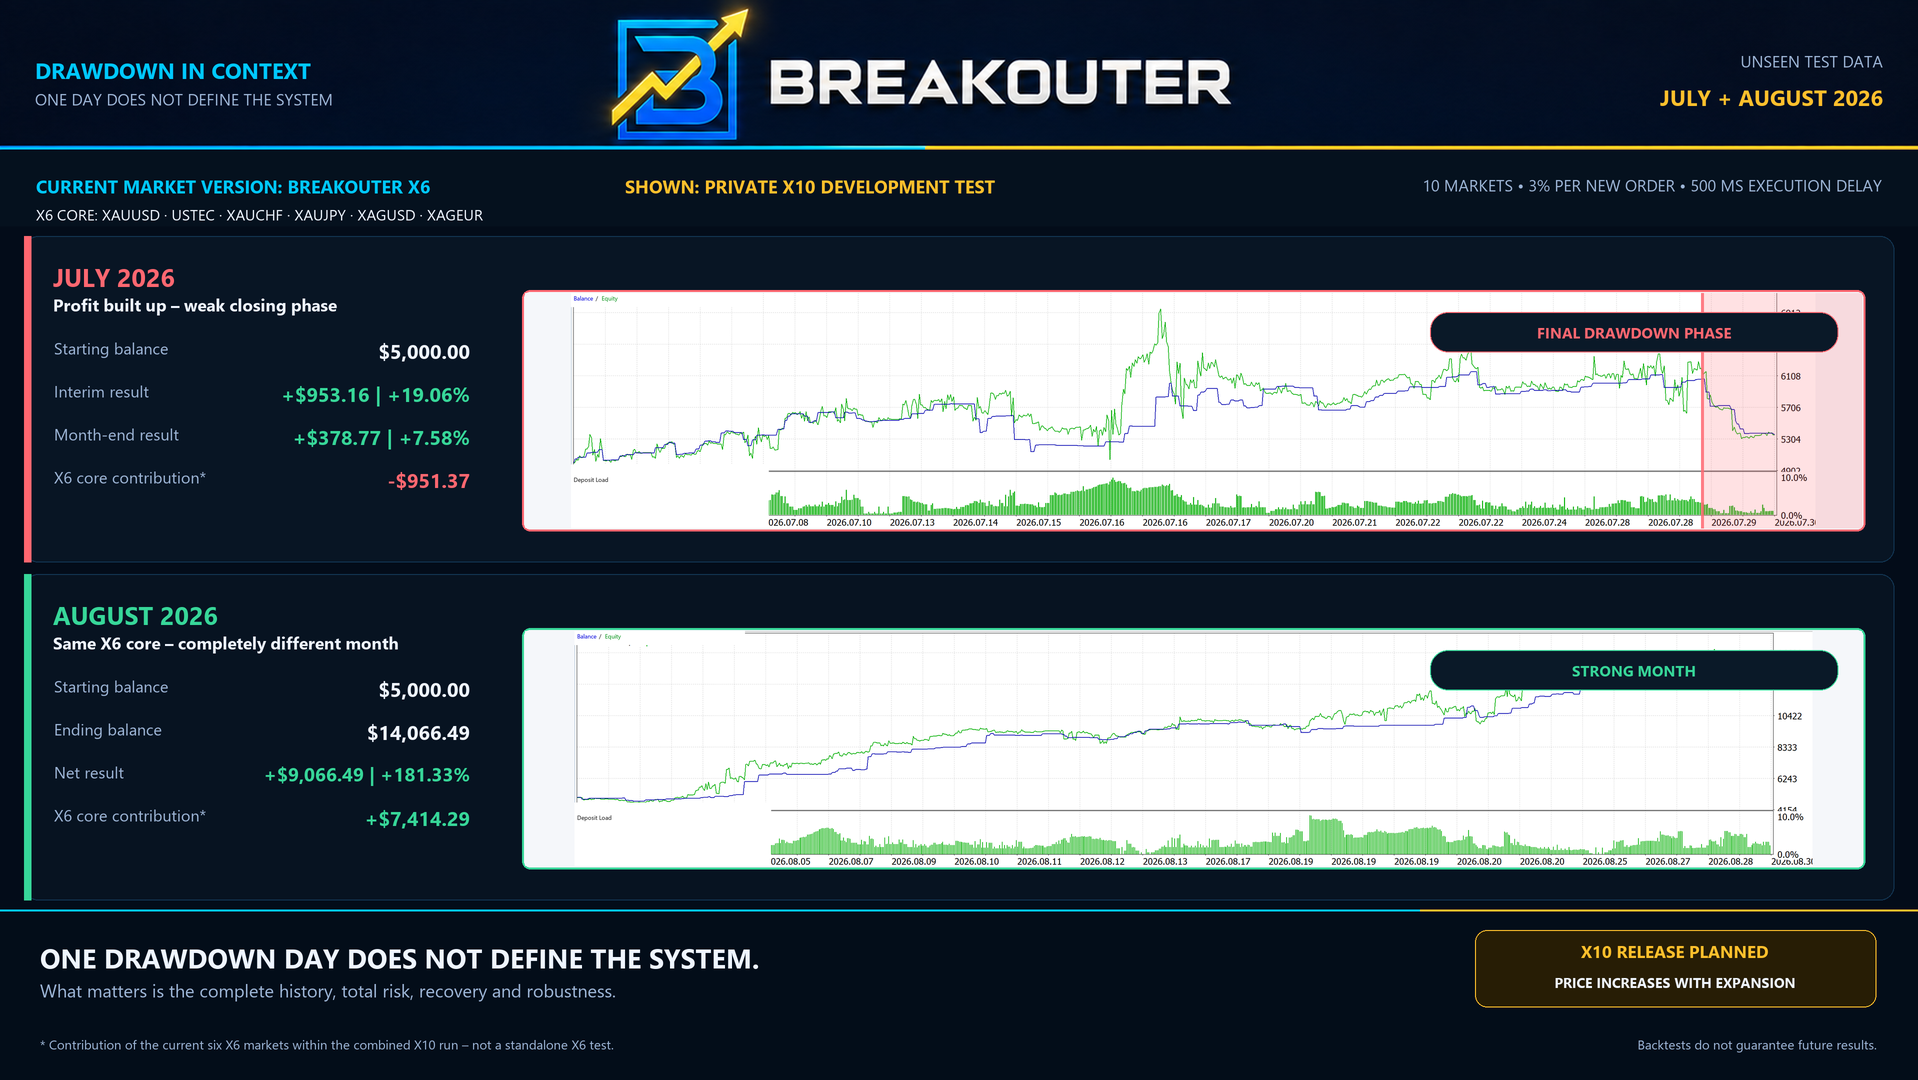
July 2026: profit built up and a substantial part given back
- Starting balance: $5,000.00
- Displayed balance before the final drawdown phase: $5,953.16
- Interim result: +$953.16 or +19.06%
- Month-end balance: $5,378.77
- Month result: +$378.77 or +7.58%
- Decline between the two displayed balances: −$574.39
July clearly demonstrates how misleading one isolated snapshot can be. Shortly before month-end, the portfolio had built a substantial profit. During the weak closing phase, a large part of that profit was given back. The complete month remained positive, but the path was far from linear.
The −$574.39 is the difference between the two displayed account balances. It is not automatically the maximum equity drawdown of the complete month because deeper or higher open-equity values may have occurred between the two snapshots.
What the current X6 core contributed in July
The Breakouter X6 version currently available on the MQL5 Market contains these six markets:
XAUUSD · USTEC · XAUCHF · XAUJPY · XAGUSD · XAGEUR
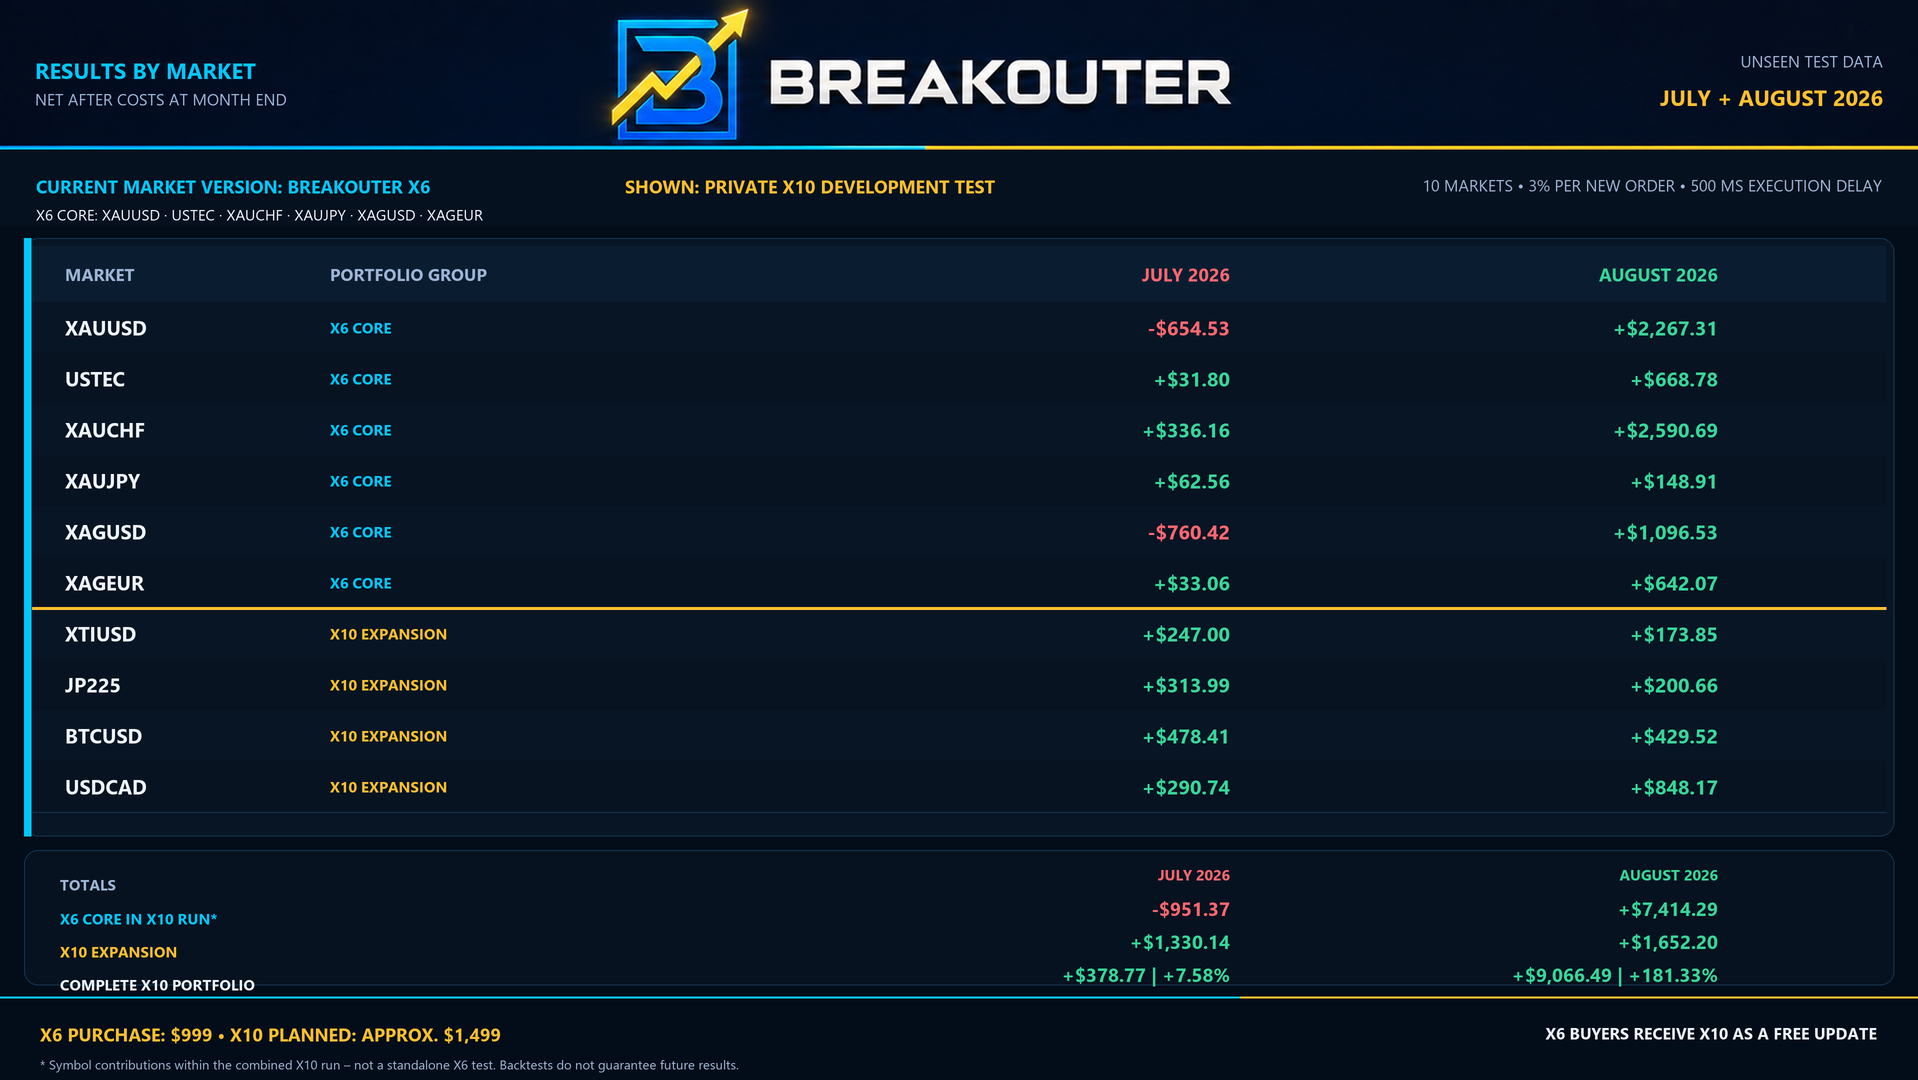
Within the combined X10 test, the summed contribution of these six X6 core markets at the end of July was −$951.37.
This is not a standalone X6 return. All ten markets operated on the same account, and the shared account size also influenced subsequent position sizes.
Nevertheless, the figure openly demonstrates that the six markets in the current product can experience weak phases and clusters of losses. The four additional X10 markets contributed a combined +$1,330.14 in the same run, allowing the complete X10 portfolio to finish July at +$378.77.
August 2026: the same core, a completely different path
- Starting balance: $5,000.00
- Month-end balance: $14,066.49
- Net result: +$9,066.49 or +181.33%
- Contribution of the six X6 core markets within the X10 run: +$7,414.29
- Contribution of the four additional X10 markets: +$1,652.20
August shows the other side of the same system logic. This result is exceptional and must not be interpreted as a normal monthly expectation or a performance promise.
A setting of 3% risk per new order is aggressive, especially because several positions may be active simultaneously.
The comparison is not intended to suggest that a strong month automatically follows a weak one. It shows how differently two previously unseen test months can develop even though the same rule-based system core is operating.
Breakouter does not use one identical strategy everywhere
A Breakouter multi-market portfolio is not created by copying one completely identical strategy across ten symbols. The individual market modules use different strategy and rule profiles.
Depending on the symbol, setup and market development, the system uses different predefined configurations and processes, including:
- different Stop Loss structures
- different break-even rules
- different trailing methods
- different reactions to the respective market movement
- symbol- and setup-specific parameters within the predefined trading logic
These differences spread dependence across several markets and rule profiles. They cannot prevent several modules from losing at the same time.
Why diversification cannot eliminate drawdowns
Diversification does not mean that all positions will always offset one another. Correlations can change. Markets that normally behave differently may suddenly move together during strong market events.
False breakouts, price gaps or rapid reversals can also affect several breakout positions in close succession. This creates a loss cluster: several individually valid trades lose within a short period.
A larger portfolio can reduce dependence on a single source of returns. It cannot guarantee smooth returns or a low drawdown. Even a diversified portfolio requires sufficient capital, controlled position sizes and the ability to withstand unavoidable losing periods.
What the 500 ms delay test shows – and what it does not
The simulated execution delay of 500 ms makes the test conditions less favourable than immediate execution.
The fact that both months finished positive under this assumption shows that the results of these runs did not depend exclusively on idealised execution without delay.
However, a 500 ms delay is not a complete simulation of every real trading condition. Real slippage depends on volatility, liquidity, broker, server location, order size and news events. Price gaps, partial fills and unusual spread expansion can still produce worse results.
How a drawdown day should be evaluated
One day should not be celebrated solely because it was profitable, nor condemned solely because it produced a loss. A more meaningful assessment considers questions such as:
- How large are balance and equity drawdowns?
- How often do loss clusters occur?
- How long do recovery periods take?
- How are results distributed across markets and strategy modules?
- How high is simultaneous portfolio exposure?
- Does the logic remain stable on previously unused data?
- How does performance change under less favourable execution conditions?
Even a positive backtest cannot answer these questions conclusively. It is one component of the evaluation, not a substitute for long-term forward and live observation.
Breakouter X6 today and the planned X10 expansion
The current Market version is Breakouter X6 with XAUUSD, USTEC, XAUCHF, XAUJPY, XAGUSD and XAGEUR.
The private X10 development version expands this core with XTIUSD, JP225, BTCUSD and USDCAD. After successful completion of the ongoing tests, X10 is planned to replace the current X6 version.
Anyone who purchases Breakouter X6 before the X10 release will receive X10 through MQL5 as a free product update, without having to purchase the product again. The existing product licence will remain valid.
This statement applies to purchased product licences and not to a rental period that has already expired.
The current purchase price of Breakouter X6 is $999. With the portfolio expanding from six to ten markets, the planned purchase price at the X10 release is approximately $1,499.
The final release and price remain subject to successful completion of the ongoing tests.
Conclusion
A drawdown day is not automatically a system error. It is part of a complete return path, just like profitable phases, sideways periods and recoveries.
July shows how quickly previously accumulated profit can become smaller. August demonstrates how strongly the same system core can perform in another market environment. Neither month should be used alone as proof of future results.
The purpose of a robust system is not to make drawdowns impossible. It is to manage risk through predefined rules, keep losing periods measurable and examine its behaviour across many different market environments.
View Breakouter X6 Portfolio or test the free demo in the Strategy Tester:
Breakouter X6 Portfolio – Product Page and Demo
Risk notice: The displayed 3% setting applies to each new order and is not a limit for the entire account. Several positions may be active simultaneously, which can make total portfolio risk substantially higher. This article is provided solely for information and system documentation. Backtests and historical results do not guarantee future performance. Trading leveraged financial instruments can result in substantial losses, including the complete loss of invested capital.