Ramandeep Singh
Ramandeep Singh
  • Information
no
experience
9
products
1
demo versions
0
jobs
0
signals
0
subscribers
Algorithmic Trader & MT5 Developer at Traders Mantra
X
I am an algorithmic trader, technical analyst and MT5 tool developer focused on Gold (XAUUSD), Silver and Forex. I have applied Elliott Wave analysis in live markets since 2020, supported by market structure, trendline analysis, momentum, volatility and trading psychology.

At Traders Mantra, I research systematic trading ideas and develop practical MT5 indicators and Expert Advisors. My work focuses on clear trading logic, controlled risk, realistic backtesting and tools that simplify complex price behaviour without making exaggerated promises.

I am the developer of Smart Trendline Detector for MetaTrader 5. I also share product guidance, trading research and educational market insights through my MQL5 blog and channel.
Ramandeep Singh
A screenshot shows what an indicator looked like at one selected moment. A demo helps you examine how it behaves across many moments...
Ramandeep Singh
Ramandeep Singh
A trading tool should not earn trust from one attractive screenshot.
I test an indicator by changing the symbol, timeframe and market condition, then watching what changes when new candles arrive. For risk tools, I manually verify at least one calculation. For analytical tools, I check whether historical objects move, disappear or appear late.
A demo is not merely a preview. Used properly, it is a small controlled experiment.
This is also the right way to evaluate tools such as Trendline Machinegun or Smart Trendline Detector: test the behaviour first, then decide whether it fits your own trading process.
Ramandeep Singh
Added poll What confirms a trendline breakout for you?
  • 25% (2)
  • 38% (3)
  • 0% (0)
  • 38% (3)
Total voters: 8
Ramandeep Singh
Ramandeep Singh
A trendline looks obvious after the move. The real test is whether you could have drawn and used it before the breakout.

When I test a trendline indicator, I watch three things:

• When did the line first appear?
• Did its anchor points change as new candles formed?
• Was the breakout visible in real time, or only on the historical chart?

A clean screenshot can’t answer those questions. Forward testing can.

What do you check first when testing a trendline indicator?
Ramandeep Singh
A candle closing outside a price envelope attracts attention. It does not, by itself, tell us whether the move will continue or reverse. TM Price Stretch Map is a free MetaTrader 5 indicator built around a simple sequence: stretch, return inside, then assess the trade...
Ramandeep Singh
Ramandeep Singh
Introducing TM Price Stretch Map, my free indicator for MetaTrader 5.

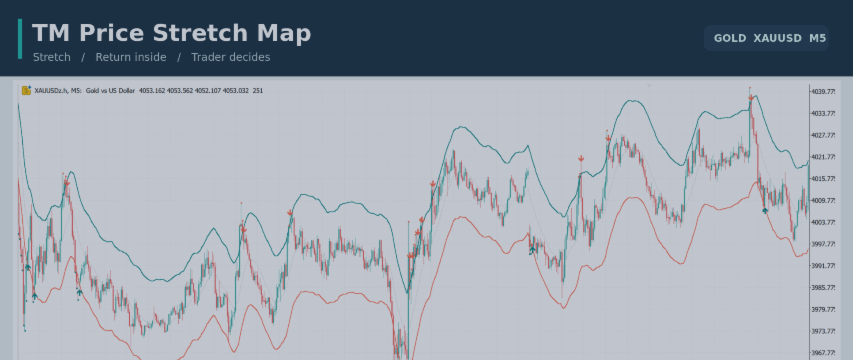
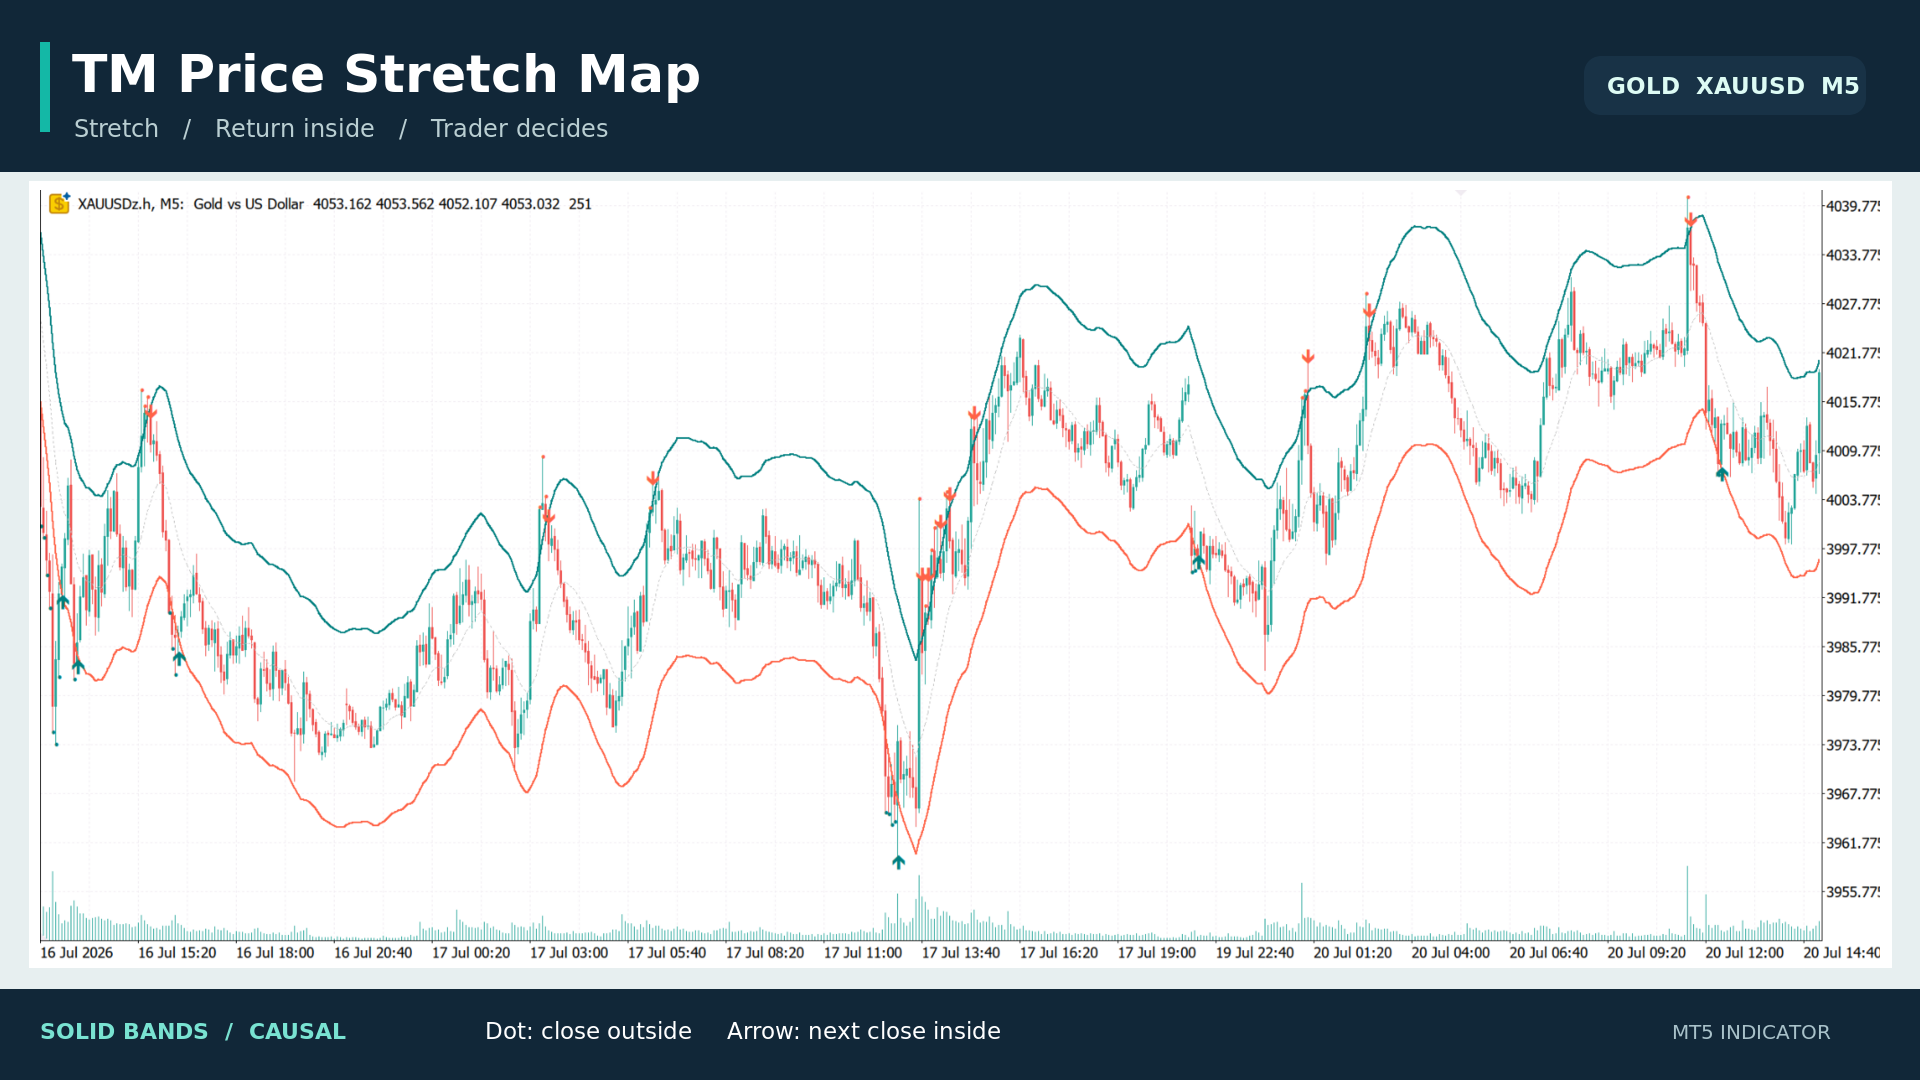
The idea is simple: first spot a candle that closes beyond the price envelope. Then watch whether the next completed candle closes back inside. Small dots mark the stretch; arrows mark the return.

The solid bands and markers use prices available at the time of each candle. There is also an optional dashed smoothing overlay for visual analysis, which can repaint. It does not generate the markers.

A return inside the bands is a setup to examine, not an automatic trade. I use it alongside market structure, trend and risk management.

https://www.mql5.com/en/market/product/197922

Search for “TM Price Stretch Map” in my MQL5 Market products to download it free. I’d be interested to hear which symbol and timeframe you try it on.
Ramandeep Singh Published product

TM Price Stretch Map displays a price envelope to help traders notice when a candle closes beyond a band and when the next completed candle returns inside it. The solid upper and lower bands use a causal Gaussian kernel calculation. A red dot marks a completed close above the upper band; a teal dot marks a completed close below the lower band. A down arrow marks the next completed candle closing back inside both bands after an upper stretch. An up arrow marks the equivalent return after a lower

Ramandeep Singh
TM Untapped Levels Oscillator for MT5 – See Market Pressure Beyond Price Markets constantly leave behind unfinished price interaction...
Ramandeep Singh
Ramandeep Singh
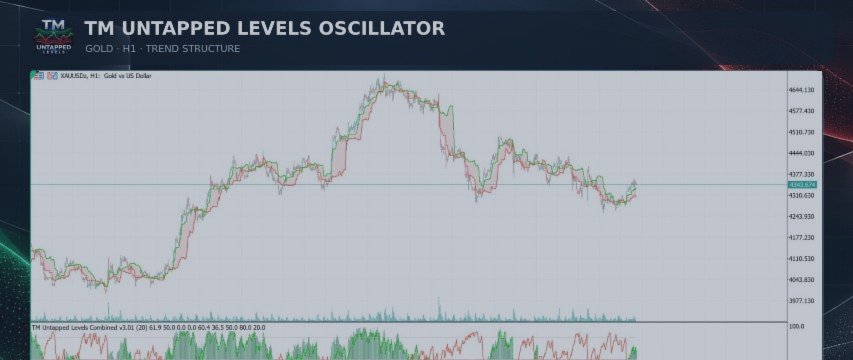
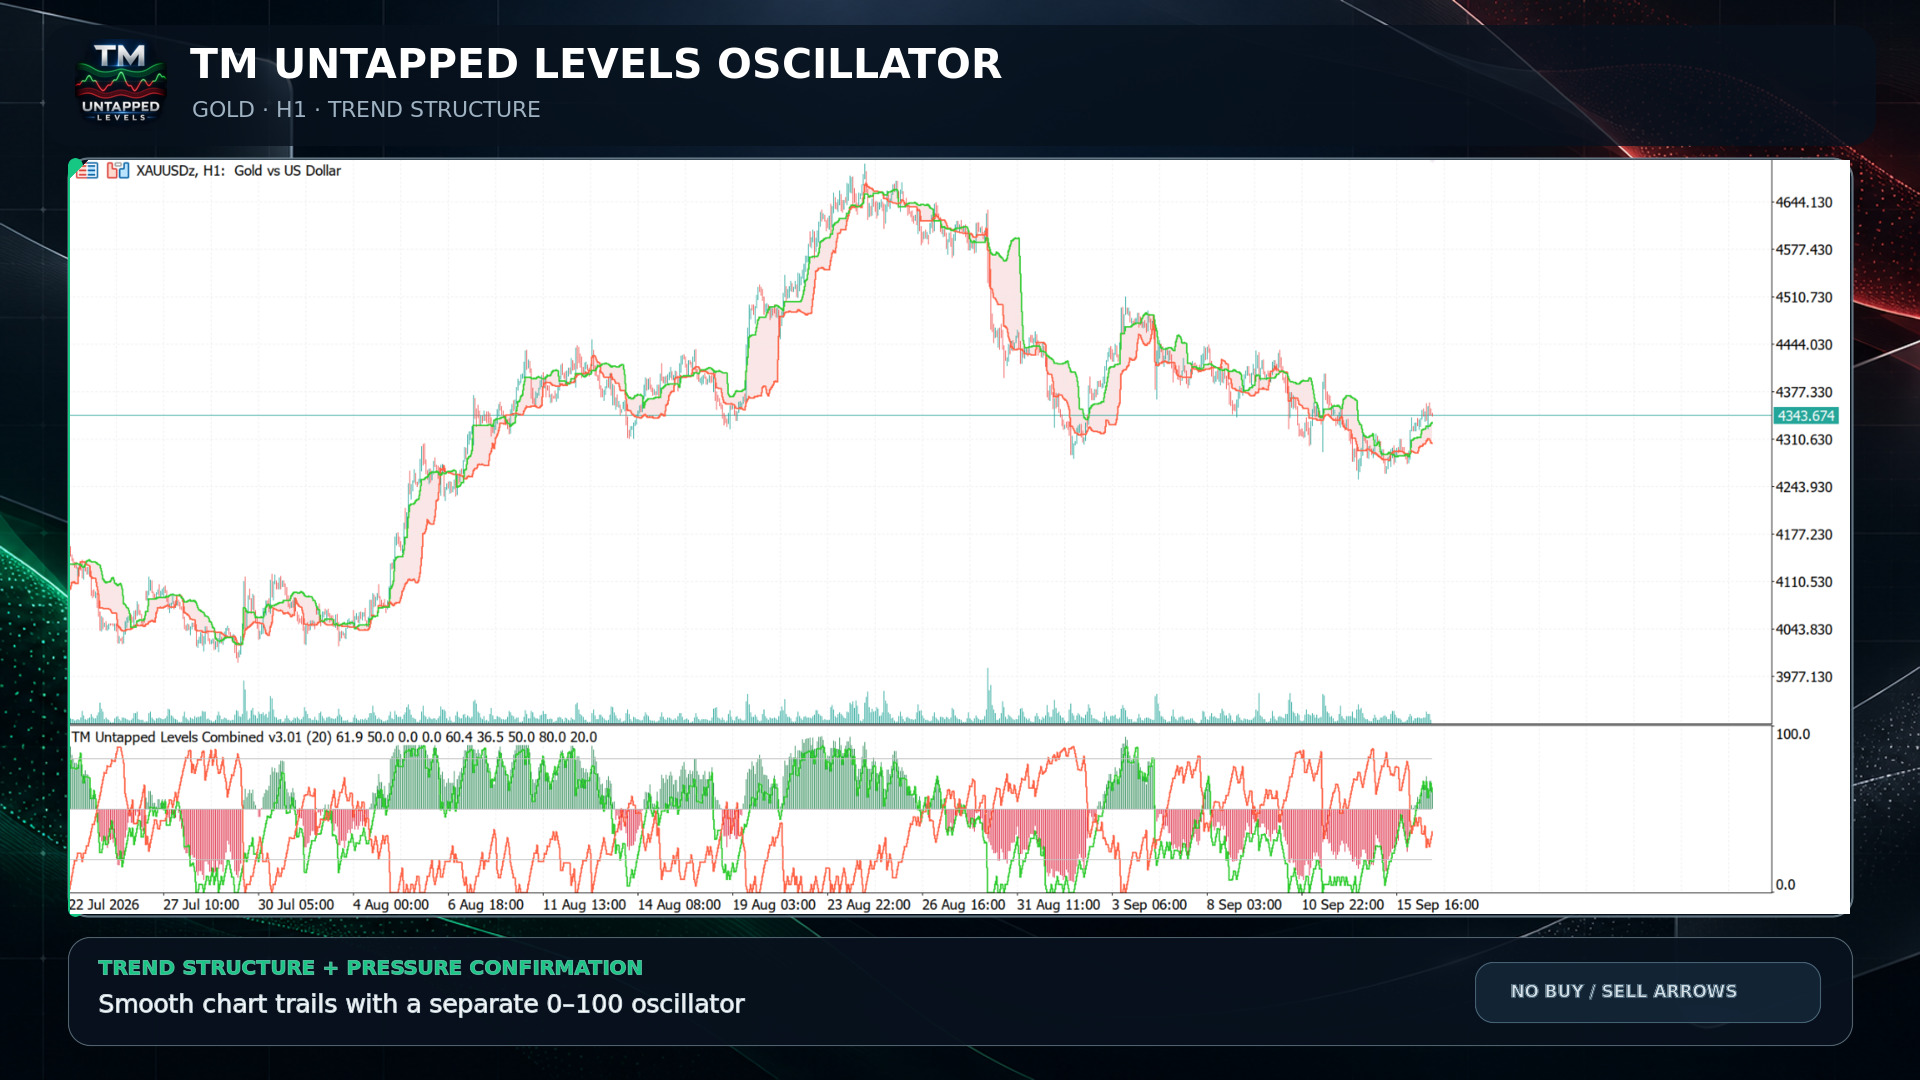
TM Untapped Levels Oscillator is a dual-display market pressure indicator for MetaTrader 5. It combines a clear oscillator panel with smooth trailing levels directly on the main price chart.

The indicator tracks prior highs and lows that remain untapped by later price action. Their persistence is converted into bullish and bearish pressure scores from 0 to 100. This helps traders see which side of the market is retaining more unresolved structure without covering the chart with buy and sell arrows.

KEY FEATURES

• Bullish and bearish pressure lines
• Centered two-color histogram around the 50 balance level
• Adjustable upper and lower reference thresholds
• Smooth upper and lower trailing levels on the main chart
• Optional shaded chart zone between the trails
• Up to 1,500 overlay bars displayed by default
• Quality-weighted scoring using level age and ATR-normalized distance
• Optional popup, push, email and sound alerts
• No buy or sell arrows on the chart
• Works on all symbols and timeframes


Download it for FREE
https://www.mql5.com/en/market/product/196347
Ramandeep Singh Published product

TM Untapped Levels Oscillator is a dual-display market pressure indicator for MetaTrader 5. It combines a clear oscillator panel with smooth trailing levels directly on the main price chart. The indicator tracks prior highs and lows that remain untapped by later price action. Their persistence is converted into bullish and bearish pressure scores from 0 to 100. This helps traders see which side of the market is retaining more unresolved structure without covering the chart with buy and sell

Ramandeep Singh Published product

TM Volatility Scalping Edge is an adaptive volatility indicator for MetaTrader 5, designed for traders who prefer selective and easy-to-read scalping opportunities instead of continuous signals. The indicator studies ATR-based volatility, price interaction with dynamic volatility boundaries, directional pressure and repeated market movements. When the required conditions align, a green or orange arrow highlights a potential bullish or bearish setup. The adaptive upper and lower bands

Ramandeep Singh
Understanding Liquidity and Market Structure with TM Liquidity Compass Market structure and liquidity are closely connected. Price frequently moves from one liquidity area toward another, while structural changes help traders understand whether buyers or sellers currently have greater influence...
Ramandeep Singh
Ramandeep Singh
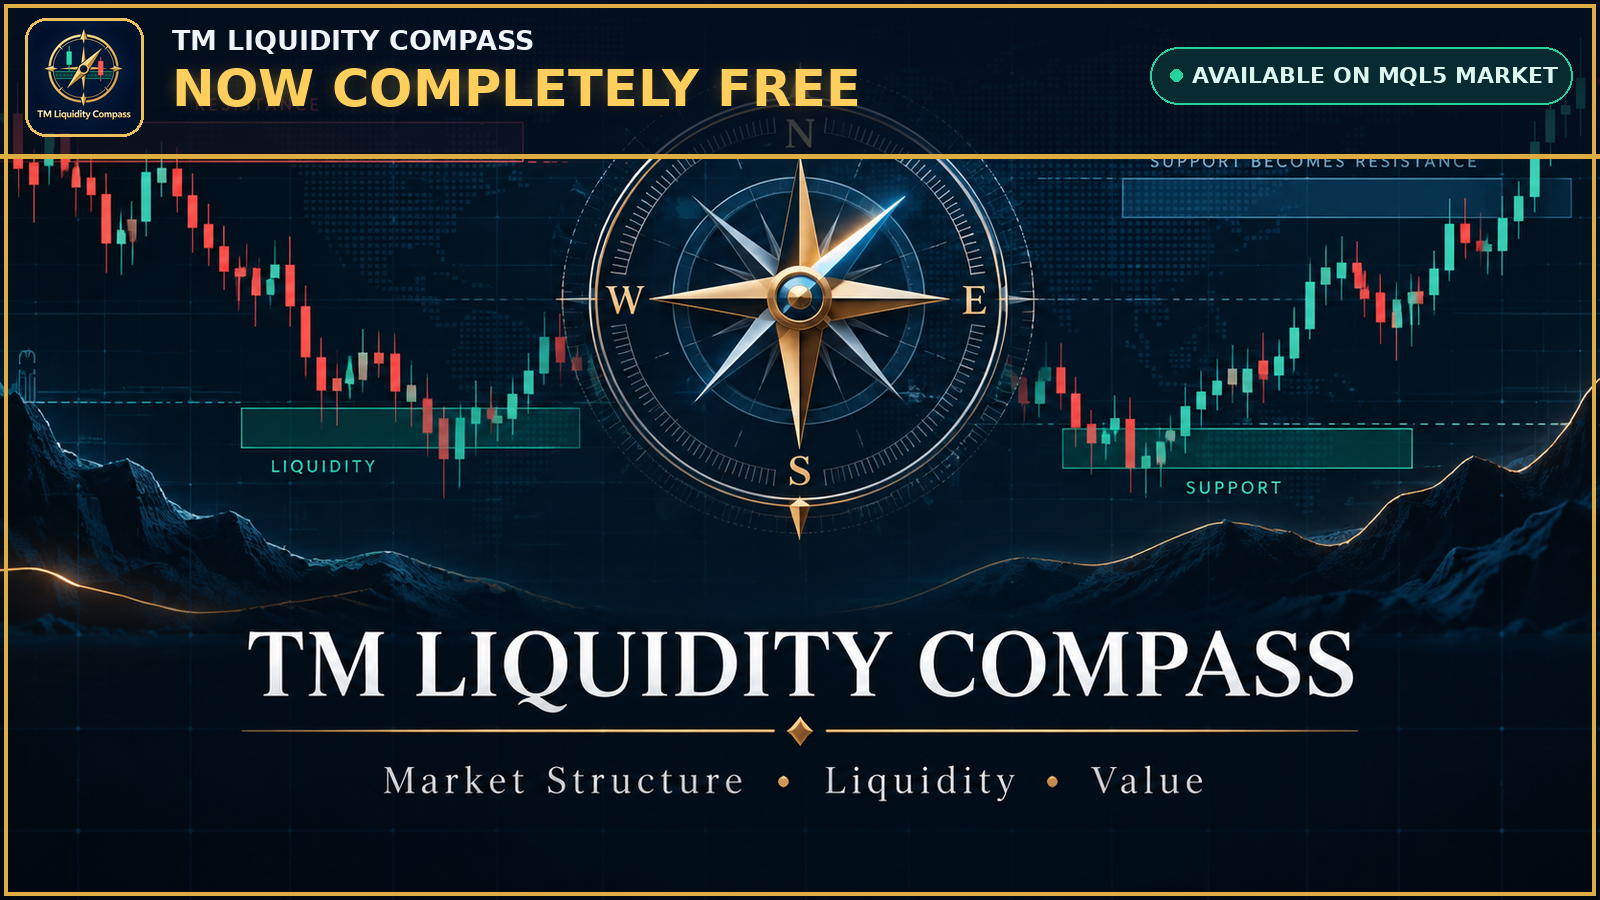
TM Liquidity Compass is now completely FREE on the MQL5 Market.

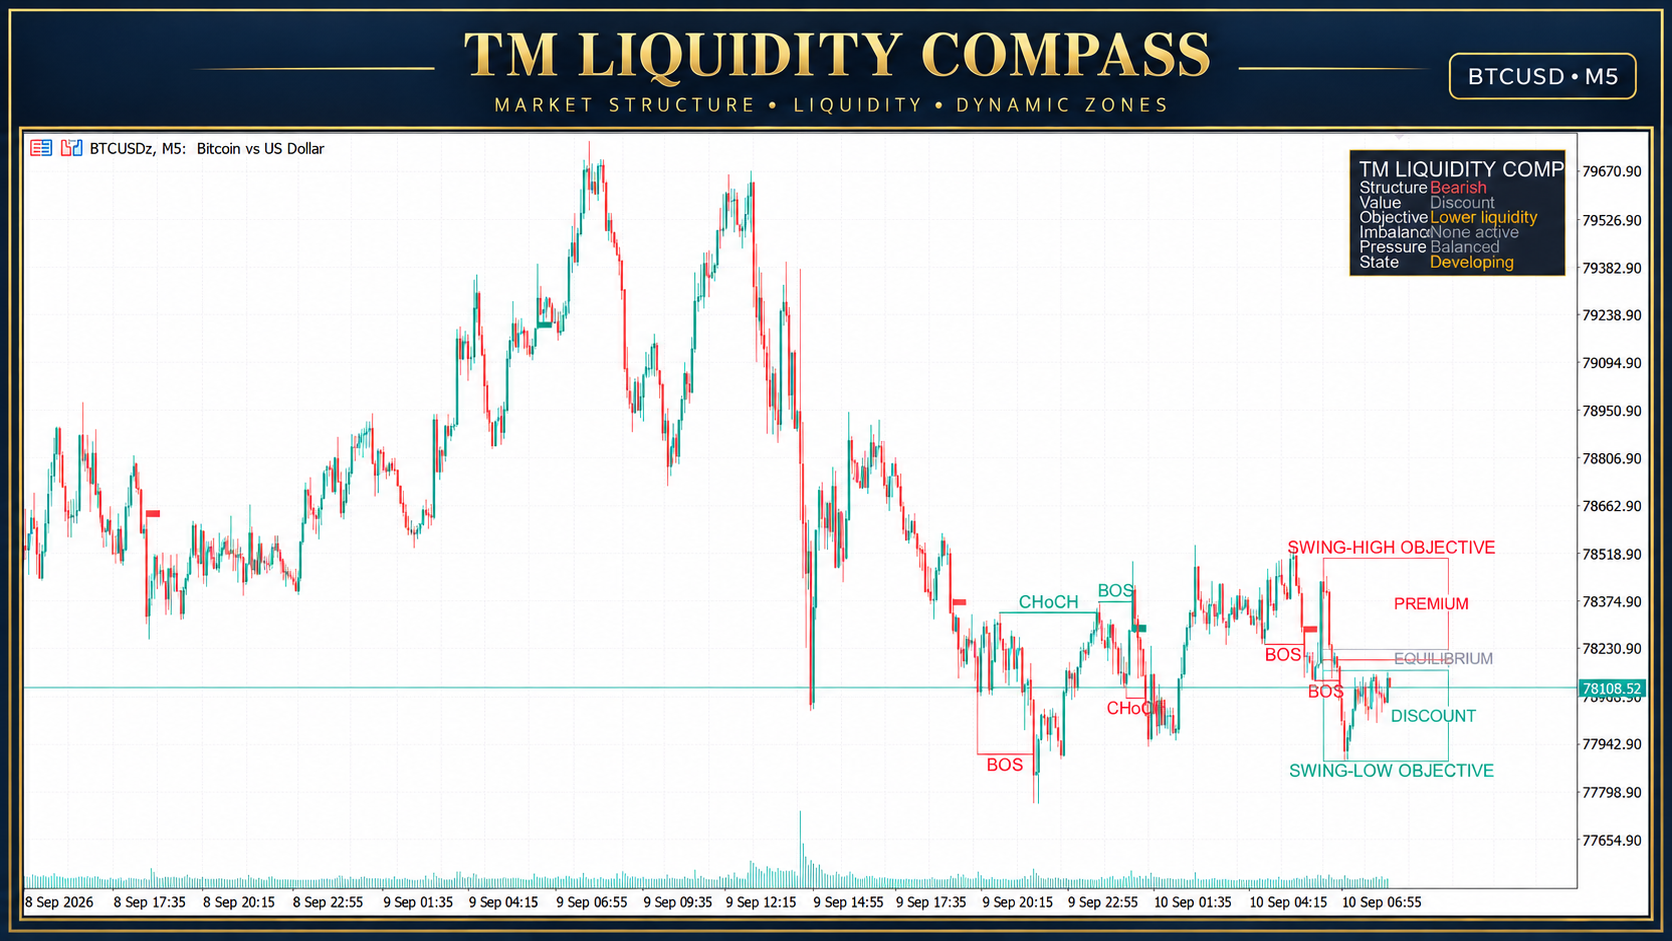
The indicator brings market structure and liquidity information together in one clear chart view:

• BOS and CHoCH
• Active bullish or bearish market bias
• Premium, equilibrium and discount areas
• Nearest upper and lower liquidity objectives
• Qualified imbalance and FVG areas
• One dynamic dominant support or resistance zone
• Compact Buyers, Sellers or Balanced pressure dashboard

TM Liquidity Compass is an analytical indicator for MetaTrader 5. It does not open, manage or close trades automatically.

Download it FREE:

https://www.mql5.com/en/market/product/195174

You can also open the MetaTrader 5 Market and search for “TM Liquidity Compass.”
Ramandeep Singh
How to Read Market Structure and Liquidity with TM Liquidity Compass A trading chart can contain dozens of signals, zones and technical labels. The real challenge is not finding more information—it is understanding which information matters now...
Ramandeep Singh
Ramandeep Singh
Introducing TM Liquidity Compass for MetaTrader 5.

TM Liquidity Compass brings market structure, liquidity context and value mapping together in one clean chart-based indicator.

Main features:

• Confirmed BOS and CHoCH structure markings
• Green and red trade-confirmation bands
• Premium, equilibrium and discount areas
• Upper and lower liquidity objectives
• One dynamic dominant support or resistance zone
• Qualified imbalance detection
• Compact market-context dashboard
• Adjustable visual and calculation settings

The dominant zone automatically adapts as market conditions change. Strong support is displayed in green and strong resistance in red. When a zone is breached or weakened, it is removed and replaced by a new qualifying area.

The indicator is designed to provide organized market context without overcrowding the chart.

TM Liquidity Compass is currently being prepared for release on the MQL5 Market.

This is an analytical tool and does not guarantee trading results. Always apply your own analysis and risk-management rules.

#MetaTrader5 #MQL5 #MarketStructure #Liquidity #BOS #CHoCH #TradingIndicator
Ramandeep Singh Published product

TM Liquidity Compass is a chart-based market structure and liquidity indicator for MetaTrader 5. It combines confirmed BOS and CHoCH markings, premium/equilibrium/discount areas, nearby liquidity objectives, qualified imbalance detection, and one dynamic dominant support or resistance zone. A compact panel summarizes the current structure, value area, objective, imbalance, pressure and market state. Main features: Confirmed BOS and CHoCH structure markings Green and red trade-confirmation bands

Ramandeep Singh
TM QuantShift Regime Matrix: A Smarter Market Regime Indicator for MT5 Markets rarely move in one consistent condition. A clean bullish trend can lose momentum and become a range. A quiet market can suddenly enter a volatile phase...
Ramandeep Singh
Ramandeep Singh
Introducing **TM QuantShift Regime Matrix** — now available on the MQL5 Market.

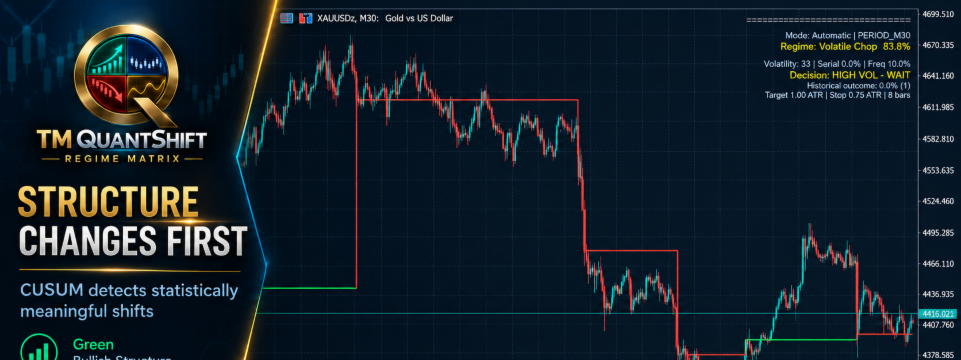
Markets do not behave the same way all the time. They transition between bullish trends, bearish trends, ranges and volatile conditions. QuantShift is designed to identify these structural changes and display each detected regime through clean, colour-coded levels directly on the chart.

Key features:

• Adaptive change-point detection
• Bullish, bearish, ranging and volatile-regime classification
• Clear regime-level visualization
• Automatic symbol and timeframe adaptation
• Suitable for Forex, Gold, Silver, Oil, indices and cryptocurrencies
• Particularly useful on M30 and H1
• No distracting BUY or SELL arrows

TM QuantShift Regime Matrix is a market-analysis tool—not an automated trading system. It helps traders understand when the character of the market may be changing before applying their own entry strategy and risk management.

**See the shift. Understand the regime. Trade with context.**

https://www.mql5.com/en/market/product/194664

#MQL5 #MetaTrader5 #TradingIndicator #MarketRegime #TechnicalAnalysis #ForexTrading #GoldTrading #AlgorithmicTrading #TradingMantra
Ramandeep Singh Published product

TM QuantShift Regime Matrix is an adaptive market-state indicator for MetaTrader 5. It is designed to make important changes in market behaviour visible before they are lost inside ordinary price noise. The indicator combines three quantitative analysis engines: 1. Change-Point Detection The CUSUM engine studies standardized price returns and accumulated directional pressure to identify meaningful structural shifts. 2. Probabilistic Market Regimes The regime model evaluates price direction

Ramandeep Singh
Automatic Trendline Analysis for MT5: Introducing Trendline MachineGun Trendlines are among the most widely used tools in technical analysis. They help traders identify market direction, dynamic support, dynamic resistance, breakout areas and possible zones of confluence...
12