Automatic Trendline Analysis for MT5: Introducing Trendline MachineGun

Trendlines are among the most widely used tools in technical analysis. They help traders identify market direction, dynamic support, dynamic resistance, breakout areas and possible zones of confluence.
The concept is simple, but practical trendline analysis is not always easy.
A chart can contain many possible swing points. Different combinations of those points can produce different trendlines, and manually comparing every valid line takes time. If an automatic indicator displays every possible line, the result can become even more confusing than manual analysis.
I developed Trendline MachineGun MT5 to address this problem.
The indicator automatically detects multiple support and resistance trendlines, evaluates their technical strength, removes near-duplicate lines and highlights the structures that currently deserve the most attention.

Why Automatic Trendline Detection Needs More Than Two Swing Points
A basic automatic trendline indicator can connect two swing lows to create support or two swing highs to create resistance.
However, two points alone do not explain how technically meaningful a line may be.
A useful trendline analysis should also consider questions such as:
-
Has price respected the line more than twice?
-
Are the swing points recent or very old?
-
Is the line still relevant to the current market structure?
-
Are several almost identical lines being displayed?
-
Is the line positioned correctly in relation to the current price?
-
Has another trendline become more important as new candles formed?
Trendline MachineGun MT5 evaluates several possible trendline candidates instead of treating the first detected line as the only valid structure.
Dynamic Strength Score from 0 to 100
Every valid trendline receives a strength score between 0 and 100.
The score considers factors including historical price touches, the quality of the confirmation points and the recency of the swings used to construct the line.
A trendline supported by several meaningful touches will normally receive a higher score than a newly formed or weakly confirmed line.
These scores are not static. The indicator updates its analysis on every new candle. When market structure changes and another line becomes stronger, the ranking changes automatically.
The purpose of the score is not to guarantee that a level will hold. It provides a consistent method for comparing several technical structures visible on the same chart.

Only Three Principal Labels
Displaying a label in front of every trendline can quickly make a chart unreadable. Labels may overlap with one another, cover candles or create too much visual noise.
Trendline MachineGun MT5 therefore limits the main chart text to three principal labels:
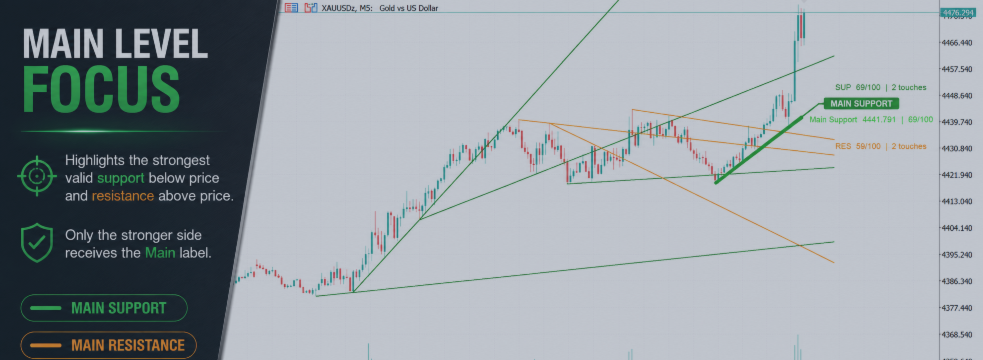
SUP identifies the highest-ranked support trendline.
RES identifies the highest-ranked resistance trendline.
Main Support or Main Resistance identifies the stronger principal level from the two sides.
If the scores change, the labels move automatically to the newly selected lines. This keeps the displayed information aligned with the latest calculation.
The chart may contain several useful trendlines, but the text remains focused on the most relevant structures.
Identifying the Main Market Level
The indicator separately evaluates support below the current price and resistance above the current price.
Main Support is selected from the valid support structures below the market.
Main Resistance is selected from the valid resistance structures above the market.
The side with the stronger qualified level receives the Main label. Therefore, only one Main Support or Main Resistance label is displayed at a time.
The selected Main line is also drawn more prominently, helping the trader identify the dominant technical structure without manually comparing every visible line.

Filtering Similar Trendlines
Automatic trendline detection can produce several lines that are extremely close and have nearly the same slope.
Displaying all such lines adds little analytical value and can make the chart appear unnecessarily crowded.
Trendline MachineGun MT5 compares same-side trendlines using their position and slope. If two support lines are very close and structurally similar, the stronger or more recent line is retained. The same process is applied independently to resistance lines.
Support and resistance lines are never merged with each other.
This filter reduces visual duplication while preserving the underlying trendline detection process.
Pressure Zone and Technical Confluence
A market can become particularly interesting when several active trendlines converge around a similar price.
Trendline MachineGun MT5 can identify this type of concentration as a Pressure Zone.
The Pressure Zone is displayed as a horizontal purple dotted line. The user can configure the maximum distance used to determine convergence and the minimum number of lines required to create the zone.
A Pressure Zone should not be treated as a guaranteed reversal or breakout signal. It highlights an area where several calculated structures are concentrated, allowing the trader to examine that area more closely.
Multi-Timeframe Trendline Analysis
A trendline visible on a higher timeframe may remain relevant while trading on a lower timeframe.
Trendline MachineGun MT5 can analyse either the current chart timeframe or a separately selected timeframe. This allows traders to display higher-timeframe structures on a lower-timeframe chart.
Multiple instances of the indicator can also operate independently on the same chart. Different colours can be assigned to each instance to distinguish between analysis timeframes.
For example, a trader may display H1 trendlines while observing entries on an M5 chart.
High-Density Mode
High-Density Mode examines a greater number of possible swing-point combinations.
This can reveal additional trendline candidates, but it also increases the amount of calculation required. It may be more demanding when used on low timeframes, several symbols or multiple charts simultaneously.
For a cleaner and lighter default configuration, High-Density Mode is disabled initially. Traders who want a broader scan can enable it from the indicator inputs.
Designed for a Clean Working Chart
The default configuration displays a maximum of eight trendlines.
Support lines are shown in green, resistance lines in orange, the selected Main line is emphasised, and a Pressure Zone is shown as a purple dotted horizontal level.
Swing dots are hidden by default but can be enabled when a trader wants to inspect the swing points used by the system.
Automatically created trendlines are also locked by default, helping prevent accidental movement while navigating the chart.
Additional information remains available through hover tooltips, including:
-
Line type
-
Analysis timeframe
-
Strength score
-
Number of detected touches
This approach keeps the chart clean while still making detailed information accessible when required.
[Insert Screenshot 4: A clean final chart on another symbol or timeframe]
Where Trendline MachineGun Can Be Used
The indicator can be applied to different markets and trading styles, including:
-
Forex
-
Gold and other metals
-
Indices
-
Cryptocurrencies
-
Stocks
-
Intraday analysis
-
Swing trading
-
Multi-timeframe analysis
-
Discretionary price-action trading
Its behaviour depends on the available price history and the market structure of the selected symbol and timeframe.
Final Thoughts
Trendline analysis contains an element of interpretation. Different traders may choose different swing points or assign different importance to individual lines.
Trendline MachineGun MT5 does not attempt to remove the trader from the decision-making process. Its purpose is to perform the repetitive work of detecting, comparing, scoring and organising multiple trendline structures.
The trader remains responsible for interpreting the wider market context and deciding how the information should be used.
Trendline MachineGun MT5 is available through the MQL5 Market:
https://www.mql5.com/en/market/product/194003
Important: Trendline MachineGun MT5 is an analytical indicator. It does not open, modify or close trades and does not guarantee trading results. Trendlines and strength scores may change as new candles form and new swing points are confirmed. Always use independent analysis and appropriate risk management.