Gold (XAUUSD) Trade Review – A 4R Setup with Quantum Naked SMC Prime

 Gold (XAUUSD) Trade Review – A 4R Setup with Quantum Naked SMC Prime
 A useful trading review explains the decision behind the entry, the point where the idea would become invalid, and how price behaved afterward.
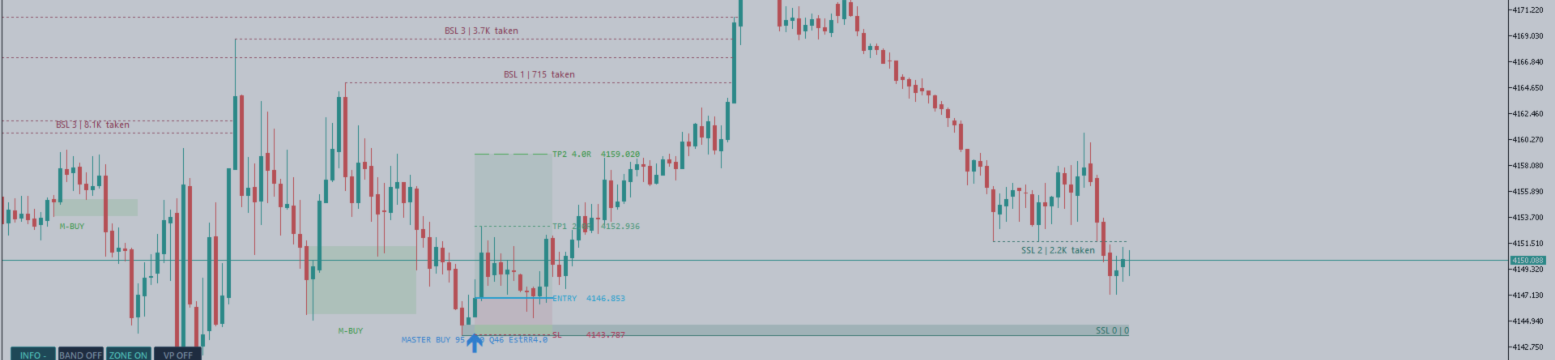
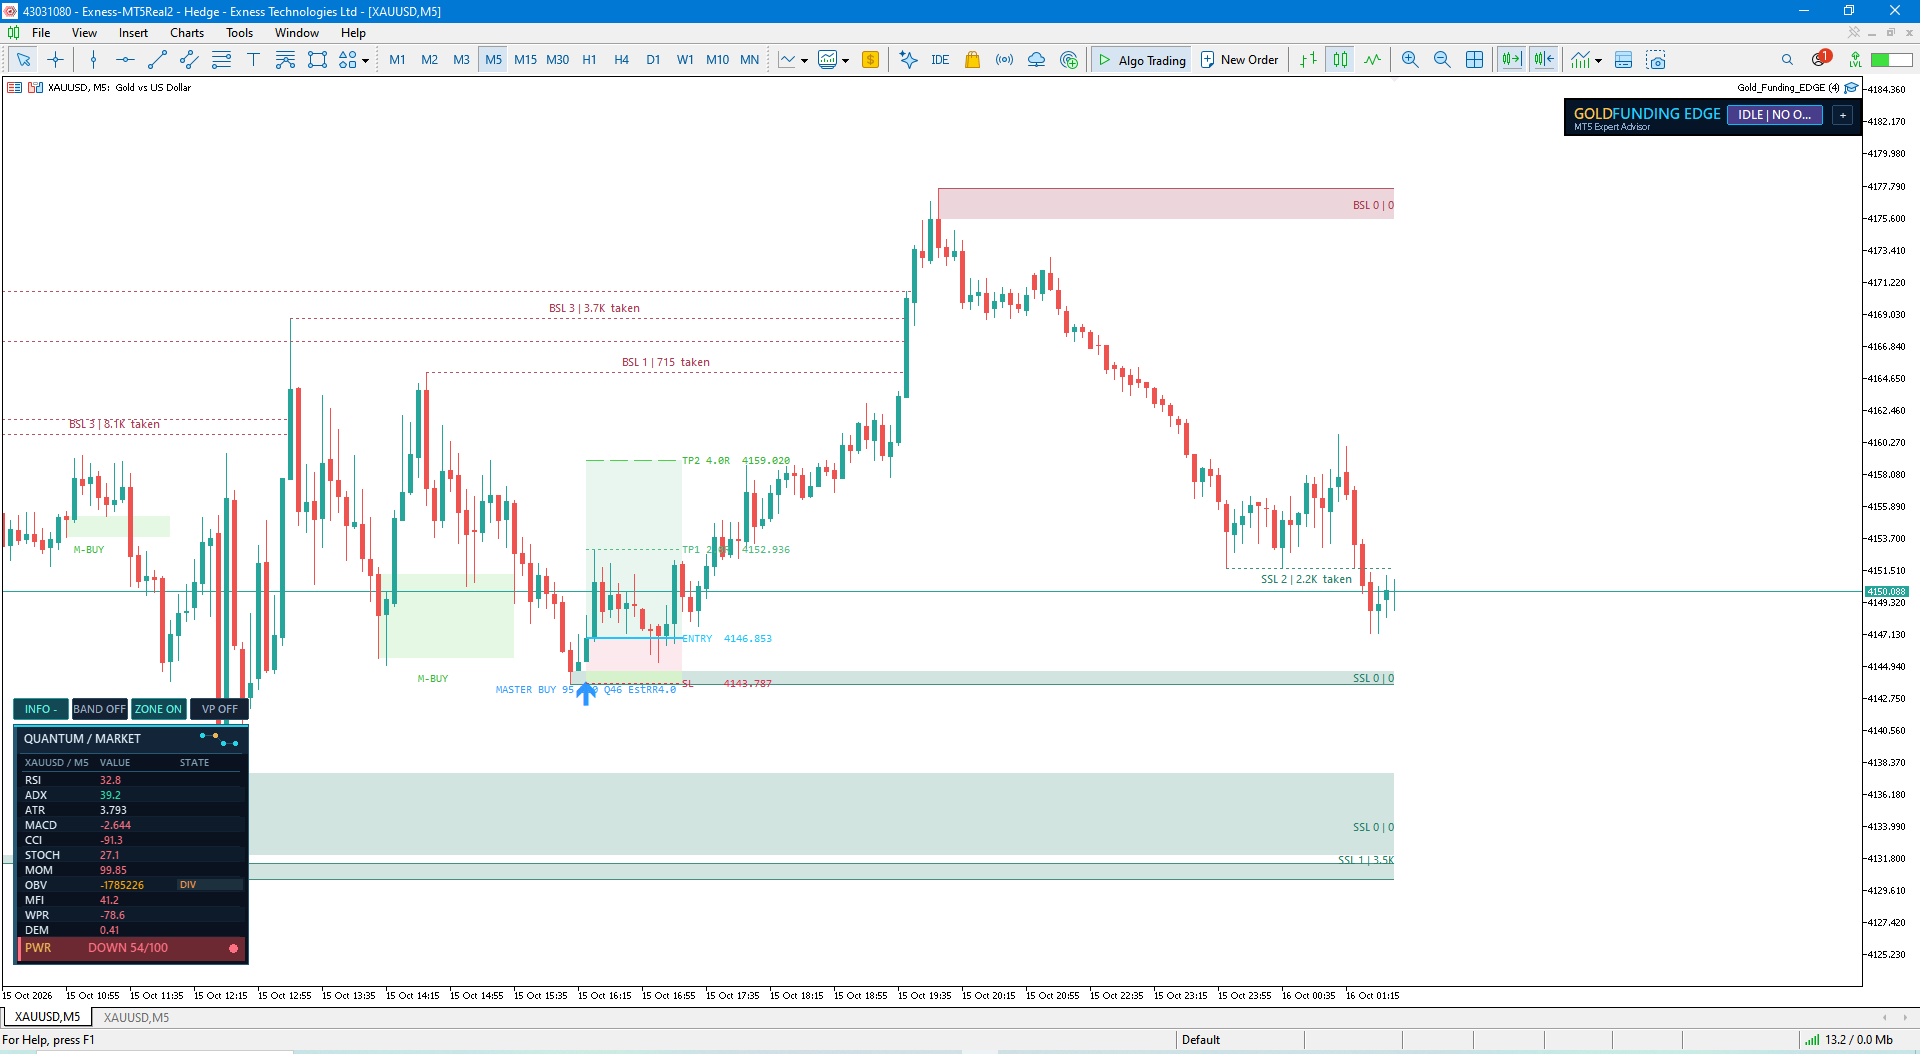
On October 15, Quantum Naked SMC Prime marked a bullish setup on the XAUUSD M5 chart with a defined entry, stop loss, and two upside objectives. Price subsequently reached the approximately 4R target, before extending higher and eventually retracing.
This review examines that setup through the supplied H4, M15, and M5 charts, showing how market context, entry location, and risk definition fit together.
The Broader Context: A Recovery Inside an H4 Range
The H4 chart places the trade within a broader range between 4,066.403 and 4,217.430. Although gold had recovered from the lower part of this range, the preceding decline remained relevant.
The midpoint of that range was approximately 4,141.917. The marked M5 entry at 4,146.853 was close to this equilibrium area.
This distinction matters: the setup was an intraday recovery opportunity inside a larger range. It did not require gold to establish a complete higher-timeframe bullish reversal.
M15: A Support Test Within the Recovery
The M15 chart shows a strong rebound from the October 14 low, followed by a period of two-way trading on October 15.
During that consolidation, price repeatedly tested nearby highs and lows. Several liquidity events are labelled on the chart, illustrating why buying every upward candle would have been difficult.
The relevant support area was approximately 4,144–4,150. The setup developed around this area, allowing the bullish idea to be evaluated close to a defined downside boundary.
The subsequent advance toward 4,177.610 confirms that buyers eventually achieved further upside expansion. That later outcome, however, should be kept separate from the information available at the original entry.
The M5 Setup: Defined Risk Before the Expansion
Quantum Naked SMC Prime displayed a MASTER BUY marker alongside the following trade levels:
| Component | Displayed price |
|---|---|
| Entry | 4,146.853 |
| Stop loss | 4,143.787 |
| TP1 — labelled 2R | 4,152.936 |
| TP2 — labelled 4R | 4,159.020 |
The entry-to-stop distance was 3.066 USD per ounce. The distance from entry to TP2 was 12.167 USD per ounce, equivalent to approximately 3.97R before trading costs.
The stop sat below the nearby support boundary. This gave the setup a specific failure condition: a move through the stop would invalidate the trade, rather than justify increasing exposure or widening risk.
The M5 chart also shows overlapping candles around the entry region before the stronger advance. The move was not immediate, which makes the original risk boundary an important part of the review.
How Price Reached the Target
After trading around the entry area, gold advanced through 4,152.936 and then reached 4,159.020, completing the displayed approximately 4R objective.
Price subsequently accelerated through additional marked highs and continued toward the 4,177 area.
That extension was beyond the original target. It should not be treated as a reason to judge the planned exit negatively: the purpose of a predefined target is to establish a repeatable decision before the outcome is known.
The later retracement toward 4,150 also demonstrates why a successful earlier setup should not be treated as a permanent buy signal.
Where Quantum Naked SMC Prime Fits into the Process
In this example, the indicator brought several parts of the analysis onto the chart: marked liquidity areas, buy zones, a directional setup marker, and explicit entry, stop-loss, and target levels.
This presentation makes it easier to inspect the relationship between the trade location and its risk. It also provides concrete levels for reviewing what happened after the setup appeared.
The trader still needs to assess the broader structure, upcoming news, spread, and execution conditions. A historical chart example cannot establish the indicator’s overall win rate or confirm that every displayed setup would produce the same result.
For traders interested in exploring the tool used in this review:
View Quantum Naked SMC Prime on MQL5 Market
What This Trade Illustrates
The strongest lesson from this example is the relationship between location and risk.
The marked entry was close to support, the stop defined when the idea would fail, and the target offered approximately four times the initial price risk. Price then delivered enough upside movement to reach that objective.
For future setups, the same questions remain useful: Where is the trade located within the larger structure? What invalidates it? Is there enough room to the target? And does the setup still make sense before the outcome is known?
This is a retrospective chart review. The screenshots show price reaching the displayed target levels; they do not independently verify order fills or net account returns. Actual results depend on execution, spread, commissions, and trade management. Past outcomes do not guarantee future performance.


