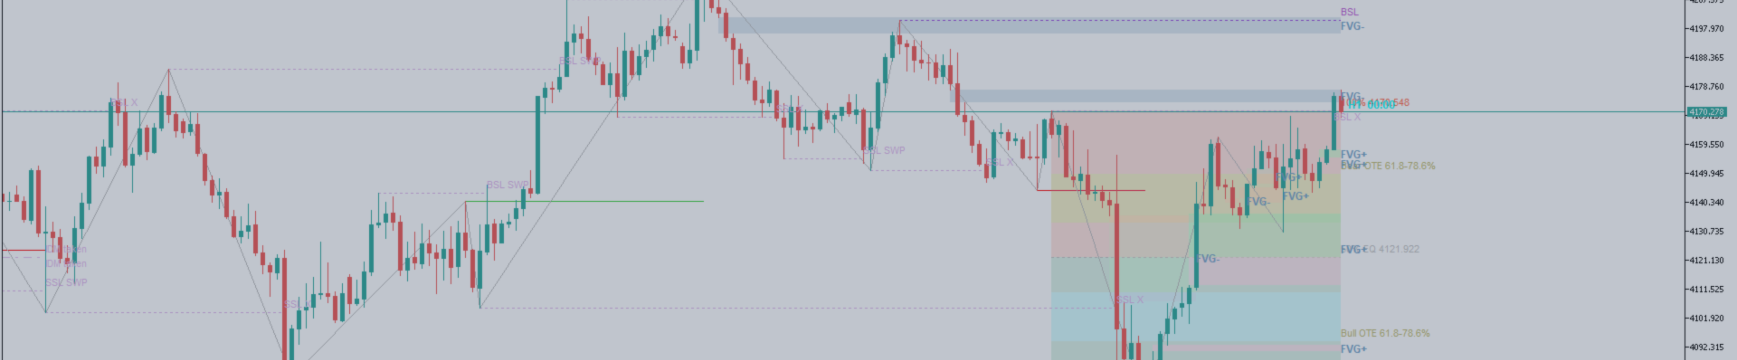

Gold is recovering on the H1 chart, but the rebound remains inside a broader H4 trading range. With the supplied chart showing price near 4,170.28, the main question is whether buyers can sustain the recovery toward 4,200–4,217, or whether the move will lose momentum before reaching the range high.
Current outlook: WAIT. Short-term momentum has improved, but price is approaching an area where buying without a pullback offers a less attractive risk-to-reward profile.
This analysis uses the supplied chart snapshot. Levels should be checked against the latest broker prices before use.
Market Structure: H1 Recovery Within an H4 Range
The H1 chart shows a strong recovery from 4,073.30, followed by a return toward the recent local high around 4,170. The rebound has reclaimed several internal price levels, indicating stronger short-term buying pressure.
However, the H4 chart remains inside a range defined by approximately 4,066.40–4,217.43. A recovery within this range does not yet confirm a broader bullish reversal.
The daily chart also remains below its displayed equilibrium near 4,328.35. This keeps the larger corrective context relevant, even while H1 momentum improves.
The distinction matters: buyers currently control the immediate recovery, while the higher-timeframe structure still requires confirmation.
Key Levels to Watch
| Price level / zone | Technical significance |
|---|---|
| 4,200–4,217.43 | Overhead liquidity and the H4 range high |
| 4,170–4,175 | Immediate H1 breakout area |
| 4,142–4,150 | Potential pullback support and recovery decision zone |
| 4,130–4,135 | Nearby internal support |
| 4,073.30–4,066.40 | Major downside reference: H1 low and H4 range low |
| 3,959.46 | Deeper daily support reference |
Zones are approximate unless an exact chart label is shown.
Why 4,142–4,150 Matters
The midpoint of the displayed H4 range is approximately 4,141.92. A pullback toward this area would test whether buyers can defend the recovery after the initial expansion higher.
Holding this zone would preserve the possibility of another move toward 4,170–4,175, followed by 4,200 and potentially 4,217.43.
A touch alone would not confirm support. The important evidence would be rejection of lower prices, a bullish displacement, and a successful retest on a lower timeframe.
Primary Scenario: A Confirmed Pullback Supports Further Recovery
The preferred continuation scenario requires price to pull back toward 4,142–4,150 and demonstrate that buyers remain active.
The confirmation sequence to watch on M5 or M15 is:
-
A sweep of a local low near the support zone.
-
A close back above the swept level.
-
A bullish displacement through a nearby lower-timeframe swing high.
-
A retest that holds the reclaimed structure.
If these conditions develop, the upside reference points are:
-
First objective: 4,170–4,175.
-
Second objective: approximately 4,200.
-
Extended objective: 4,217.43, provided the recovery maintains follow-through.
M5 and M15 charts were not supplied, so this is a conditional setup rather than an already confirmed entry.
Any simulated trade should use the actual confirmation structure to define its stop. If the distance to the first meaningful target does not provide at least 1:2 risk-to-reward after costs, the setup should be skipped.
What Would Invalidate the Recovery Scenario?
An H1 close below approximately 4,142, followed by a failed attempt to reclaim 4,142–4,150, would weaken the continuation thesis.
That sequence would suggest that the pullback is developing into renewed selling pressure.
Only after this failure would a bearish continuation scenario become relevant. Downside reference areas would then include 4,130, approximately 4,105, and eventually 4,073–4,066.
A sustained H4 break below 4,066.40 would be more significant because it would challenge the lower boundary of the current trading range.
What If Gold Breaks Higher Without a Pullback?
A direct move above 4,175 could bring 4,200–4,217 into focus. However, a brief move through resistance is not enough to establish acceptance.
Look for a completed candle above the level, follow-through, and a retest that holds. If price reaches the target area before offering a valid setup, the original opportunity has expired and the structure needs to be reassessed.
Current Decision: Wait for Better Evidence
Around 4,160–4,185, price is already in the upper half of the H4 range. Buying here risks entering after a substantial recovery, while selling immediately would oppose the visible H1 momentum.
This makes the current area a wait-for-confirmation zone.
The practical focus is straightforward:
Watch 4,142–4,150 for a confirmed support response, and 4,200–4,217 for the next major test of the recovery.
A confirmed hold of support would favor further upside exploration. A breakdown and failed reclaim would cancel that view. Until either sequence develops, patience remains the clearest decision.
This article is for educational and market research purposes. It presents conditional scenarios, not a live trade signal or a guarantee of future price movement.


