Scalper Inside PRO 9.0: Refined Calculations, Trade Walkthroughs and Free Smart SL

Hi everyone, I’m really glad to finally share Scalper Inside PRO 9.0 with you. It is a major step forward for our favorite MT4 indicator, with refinements to signal generation, more reliable calculations, improvements to the built-in optimizer, and many internal updates. In this article, I will show the new version in action through selected trade examples using only the default settings and introduce SIPRO Smart SL, a free companion module for owners of the official Scalper Inside PRO indicator. Smart SL adds a structure-based stop reference directly to the chart, helping you see the initial distance to that level and better assess the structure of a potential trade after a signal appears.

Why the jump from 8.45 straight to 9.0? Because this release is more than a collection of small fixes. I worked on the signal generation, improved the reliability of the calculations, refined the built-in optimizer, and made a number of changes behind the scenes. The familiar core idea of Scalper Inside PRO is still here, but version 9.0 gives it a more refined foundation. And I don’t want to introduce 9.0 with a changelog alone. Whenever I prepare a new release, I first test it using only the default settings. That lets me see what a trader sees before making adjustments for a particular instrument: which signals deserve a closer look, where market context matters, and how the target levels fit into the picture.
I did exactly that with version 9.0 across several markets. Every chart and trade example that follows uses Scalper Inside PRO 9.0 with the default settings, without running the optimizer or applying custom settings. I’ll walk you through what I noticed, which signals I passed on, and how I approached the target levels.
This article and all examples below use Scalper Inside PRO v9.0
Some functions and options may be unavailable in earlier versions of the indicator.
If you have not updated yet, you can find the current version here: Scalper Inside PRO on MQL5 Market
New to Scalper Inside PRO? Start with the introductory guides below to understand its signals, target levels and built-in tools.
Start here if you’re new to Scalper Inside PRO
• Scalper Inside PRO: intraday setup, entries, targets, and core features
• How to use the HTF-Filter for trade management and filtering
• Using Scalper Inside PRO with market context, strong levels, and risk management
Official product notice: Scalper Inside PRO is available exclusively through the official MQL5 Market.
Please avoid unauthorized copies or third-party downloads, as they may be outdated, modified or unsafe. Official users receive product updates and technical support.

What Changed in Version 9.0
- Refined signal generation. The familiar core approach of Scalper Inside PRO remains in place.
- Calculation refinements. Improvements across the indicator are designed to make its calculations more consistent in practical use.
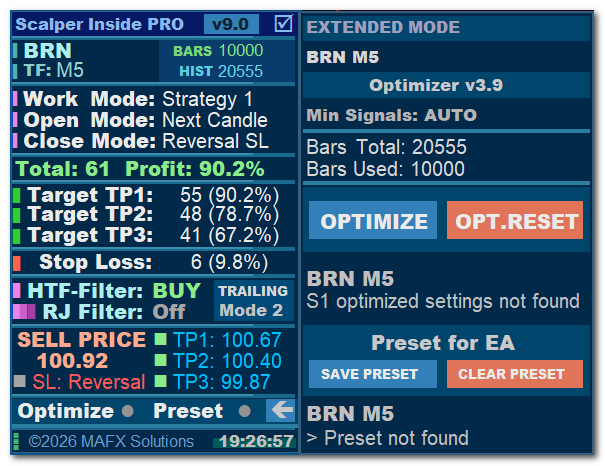
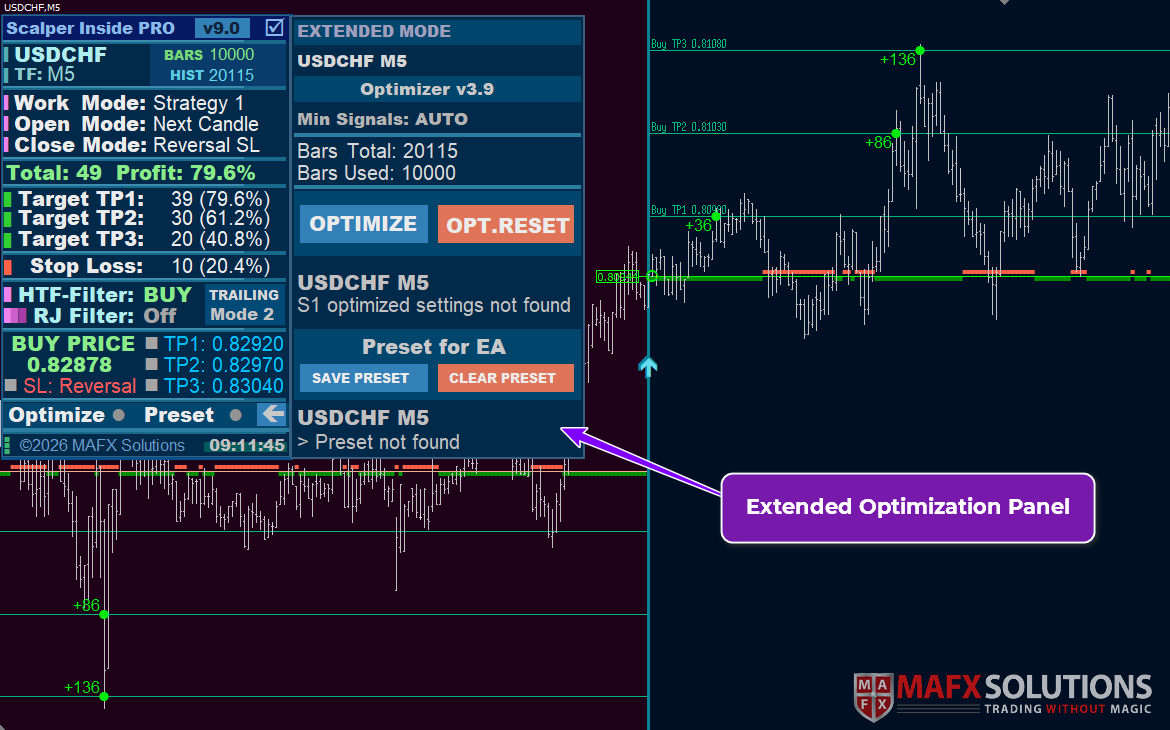
- Built-in optimizer refinements. Improvements designed for a smoother and more consistent optimization workflow.
- Internal improvements. Additional refinements designed to make the current release more stable and consistent in practical use.
- Exclusive free companion indicator for official users: SIPRO Smart SL. Built for official Scalper Inside PRO owners, SIPRO Smart SL visualizes a structure-based potential stop-loss reference directly on the chart, helping you see the initial distance to that level alongside the target levels before considering a trade.

The Core Principle Behind Scalper Inside PRO
Before moving on to the examples, it is worth returning to the main idea behind how Scalper Inside PRO works.
Scalper Inside PRO is not designed to react to every small price movement or chase the market after a move is already underway. Its logic is based on a more selective approach: waiting for price to reach an important area, test a meaningful level, and then looking for confirmation that a genuine impulse may be developing through that level.
This is why the signals may sometimes appear slightly later than the very first touch or the first candle at a level. That small amount of confirmation is intentional. The indicator is looking for a market condition where price is no longer simply moving back and forth inside noise, but where there is a meaningful chance that momentum is beginning to take control.
The objective is not to catch every possible entry. The objective is to identify those moments when the probability of a fast and clean move is higher – the type of movement that can reach TP1, and potentially continue toward TP2 and TP3, without spending excessive time around the entry area.
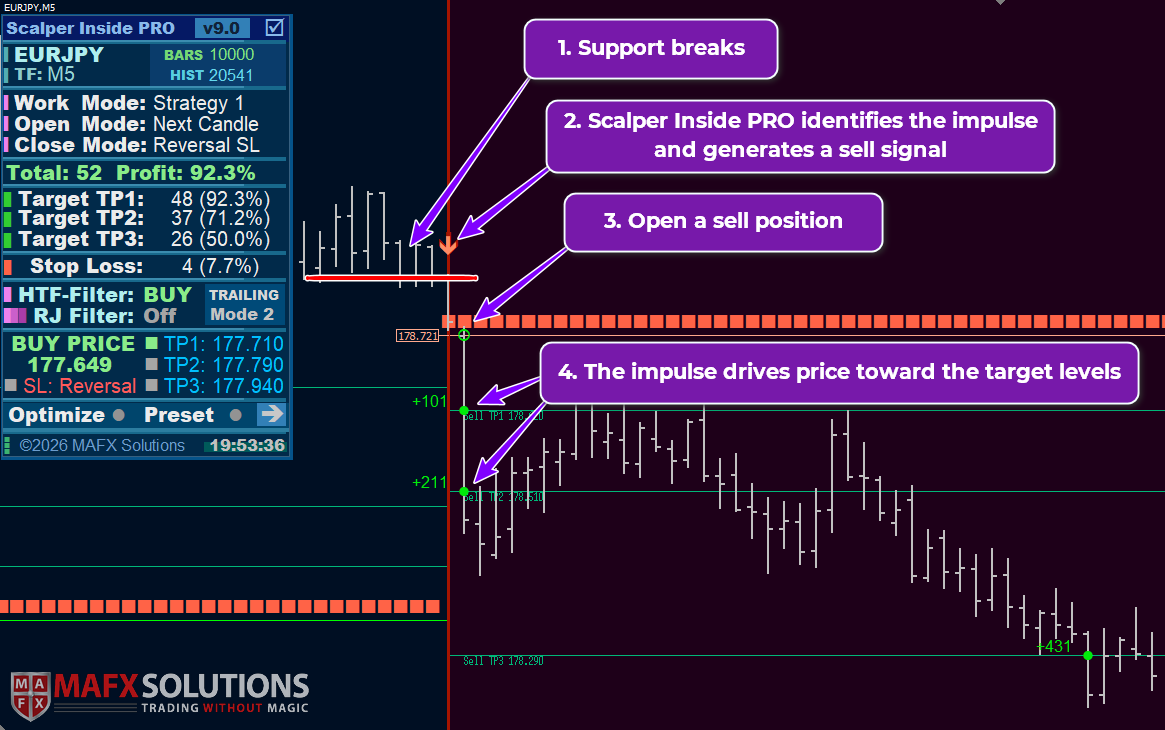
In practical terms, Scalper Inside PRO looks for a sequence such as this:
- Price approaches or tests an important market level
- The level begins to show a meaningful reaction
- Momentum develops and price attempts to break through the area rather than merely touch it
- Scalper Inside PRO identifies the developing impulse and provides the trading structure: entry context, target levels, and a potential stop-loss reference
This makes the system selective by design. It may not always produce the earliest possible signal, but it is intended to avoid treating every minor fluctuation as a trading opportunity. The focus is on quality, structure, and momentum rather than generating the maximum possible number of alerts.
TP1, TP2, and TP3 should therefore be viewed as more than arbitrary price targets. They provide a structured framework for assessing the potential path of a confirmed impulse and managing the position as the move develops. When market conditions are strong, price may reach these levels quickly; when momentum weakens, the same structure still provides clear reference points for trade management.

A Quick Look at the Real-Time Test
Before going into the details, here is a quick look at the real-time test I run before releasing a new version of Scalper Inside PRO. This time, I decided to share it with you and use it as an opportunity to review several market situations together and show how the indicator can be used in practice.
The screenshot below shows the combined result of several trading days using Scalper Inside PRO 9.0 on M5 with the default settings. I did not use the built-in optimizer or apply custom settings for individual instruments. For simplicity, I also did not use strong levels from higher timeframes, although they can provide useful additional context and may improve trade selection. You can read more about using strong levels here.


Closed Trade P/L: 1,221.98
Final balance: 6,221.98
Maximal drawdown: 75.81 (1.42%)
The test started with a deposit of 5,000.00 and ended with a balance of 6,221.98. The closed trade result for this three-day testing period was 1,221.98. What I find especially important is not only the final result shown, but also how the trades were managed while the test was running. The maximal drawdown shown in the statement was 75.81, or 1.42%.
Important remark: This is a personal real-time test result from a limited period. It is not a typical result, a guarantee of future performance or investment advice. Trading involves risk, and results can vary depending on market conditions, execution, position size and trade management.
This was not a fully automated test, but I kept the approach deliberately simple. After selecting the instruments, I took most of the signals that appeared under the default settings on M5 and managed the positions manually using Scalper Inside PRO 9.0 signals. I also avoided trading during exceptional market conditions. For example, I stayed out of the market on Friday because it was the first Friday of the month, when the U.S. Nonfarm Payrolls report can create unusually volatile and unpredictable conditions.
The purpose of the examples below is to show the decisions behind the result: how the instruments were selected, how the signals were handled, where profit was protected, and what happened when the market did not follow through as expected.

Testing Scalper Inside PRO 9.0 with Default Settings
As I have mentioned many times before, I always prefer to test a new version in real time rather than rely only on historical charts.
A historical chart can be useful for studying how a signal behaved after the fact. But it cannot fully reproduce the decisions a trader has to make in the moment: whether market conditions are still suitable, whether momentum is developing or fading, whether a signal deserves attention, and how the position should be managed once price begins to move.
Real-time testing gives me a much clearer picture of how the indicator behaves as market conditions change. It also allows me to approach the chart in the same way that other traders will after installing the new version, without knowing what the next candles will do.
For this test, I used the default settings of Scalper Inside PRO 9.0. I did not run the built-in optimizer or apply custom settings for individual instruments. The goal was to see how the updated version performs as a practical starting point before making any instrument-specific adjustments.

How I Approached the Real-Time Test
Before reviewing the individual trades, let me explain the practical approach behind this test.
Why I Use the M5 Timeframe
For this type of testing, I usually work with the M5 timeframe. M5 gives me a useful balance between speed and structure. It is fast enough for intraday trading and short-term opportunities, while still giving price action enough room to form a readable market structure. Important reactions, breaks and developing impulses are generally easier to evaluate than they are on a one-minute chart.
I do not use M1 as my main working timeframe. That does not mean that M1 cannot be traded with Scalper Inside PRO. It can. However, it is a much faster environment, where small fluctuations, spread, execution quality and short-term noise can have a much greater effect on the result. M1 requires quicker decisions, more attention and, in my view, considerably more emotional discipline.
For me personally, M5 provides a more comfortable and structured way to work. It allows me to focus on the quality of the setup rather than reacting to every small movement. The M1 timeframe may suit traders who are comfortable making very fast decisions, but it is not the timeframe I chose for this three-day review.
How I Select Instruments for Testing
Before starting the review, I do not simply open random charts and take every signal. The instrument itself matters. Even a well-structured setup can become less attractive if the spread is too high, volatility is too limited or the market is spending most of its time moving sideways.
When selecting instruments for Scalper Inside PRO 9.0, I use several practical criteria.
1. A Reasonable Spread
The first thing I check is the spread. In short-term trading, the spread is an immediate cost that price needs to overcome before a position can move beyond the entry cost. This becomes even more important when the expected intraday move is relatively small.
When target levels are relatively close to the entry area, an unnecessarily wide spread can take too much from the available move. A narrower spread does not guarantee a good trade, but it gives the setup more room to develop without the spread consuming a meaningful part of the potential move.
This is one reason why I prefer liquid instruments and always check current broker conditions rather than assuming that one symbol will behave the same way at every time of day.
2. A Strong Win Rate (WR%)
As a starting point, I generally prefer instruments where the Win Rate (WR%) shown by Scalper Inside PRO is around 75% or higher.
For me, a higher Win Rate suggests that the instrument has recently produced a larger proportion of signals that developed in a useful and readable way. It is not a guarantee of what will happen next, and it should never be treated as a reason to take every signal without context. It is simply one of the filters that helps me focus attention on markets that are currently behaving more cleanly.
There are exceptions. If I know an instrument well and understand how it tends to behave during different sessions or market phases, I may still consider it even when the Win Rate is lower. Familiarity matters. Some markets become more active only during specific hours, while others may be less suitable when conditions become slow, irregular or range-bound.
The point is not to find a perfect number. The point is to avoid treating every instrument as equally attractive at every moment.
3. Sufficient Volatility and Clear Movement
I also want to see that the instrument has enough movement to justify trading it.
This does not require a complicated calculation. A quick review of the recent chart can often reveal a lot. I look at whether price has been making meaningful moves and developing clear impulses, or whether it has spent most of the recent period trapped inside a narrow, repetitive range.
When an instrument remains in a tight sideways corridor for too long, the probability of confusing movement increases. Price may produce breaks that do not follow through, signals may appear in both directions, and there may simply not be enough room for a trade to develop toward the target levels.
I prefer instruments where price has recently shown the ability to move with direction and momentum rather than remaining range-bound for long periods.
4. Recent Signal Quality on the Chart
Finally, I look at the recent signals themselves.
This is an important practical check. If recent signals are clean, price reacts with direction and the market produces meaningful follow-through, the instrument may be worth keeping on the watchlist.
But if the chart shows many mixed or confusing signals, frequent reversals and little movement after entries, that is often a warning sign. It may suggest that the market is currently range-bound, unstable or simply not well suited to this approach at that moment.
This does not mean that the instrument is bad. It only means that I may choose to leave it aside temporarily and focus on markets that are showing clearer conditions.

Does That Mean an Instrument Should Be Avoided Forever?
Not at all. Market conditions change. An instrument that looks flat, irregular or uninteresting today may become highly active next week. Trends change, volatility changes, trading sessions change and market behaviour changes with them.
The goal is not to permanently reject an instrument. The goal is to review it regularly and focus on the markets that currently offer clearer and more suitable conditions for the way I trade.
That is why instrument selection is an ongoing process rather than a one-time decision. I periodically check the charts, review recent signal behaviour and update the list of instruments I am willing to trade.
For this test, I focused on the instruments that met these conditions and showed the clearest recent market behaviour.

Of the instruments shown above, only two are currently below my preferred WR% range when using the default settings: EURUSD at 72.3% and GBPUSD at 71.4%. However, I include both in my tests most of the time. As I mentioned earlier, familiarity with an instrument’s behaviour is also important. When you understand how a market tends to move during different sessions and conditions, a slightly lower WR% can be assessed within that broader context.
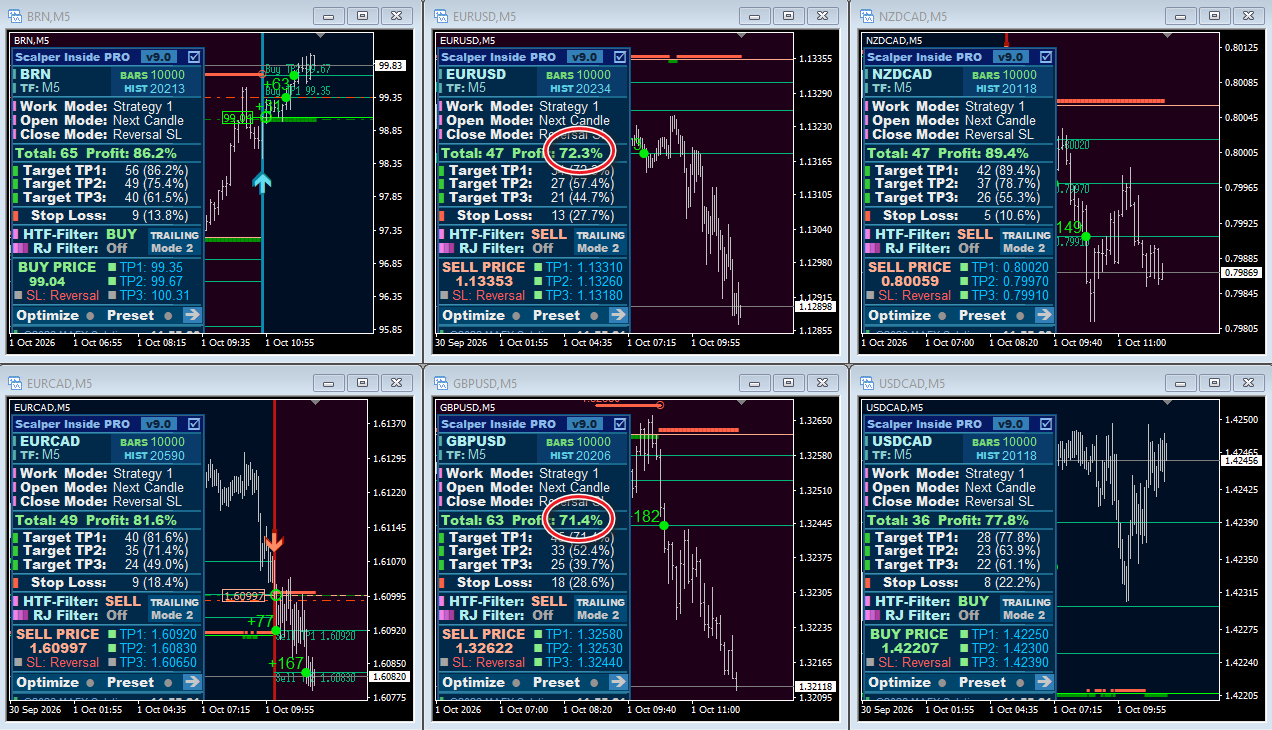
Next, let’s look at several examples selected from the three-day real-time test using the default settings on M5.

Scalper Inside PRO Real-Time Trade Walkthroughs
The examples below were selected from the same three-day real-time test using the default settings on M5. They include trades that reached their projected targets, trades where profit required active management, and setups that did not develop as expected. The purpose is not to present only ideal charts, but to show how I read the signals, target levels and changing market conditions in practice.
EURJPY M5: Fast Breakout to TP3

EURJPY example, following the same type of setup discussed earlier. After a fast breakout, price moved cleanly and steadily through the projected levels and reached TP3.
Once TP3 was reached, the protective stop was moved slightly above that level. If price had continued lower immediately, I would have moved the stop below TP3 and then managed the remaining move with a trailing stop. Instead, the impulse lost momentum, price retraced, and the protective stop above TP3 was triggered.
Price is now moving between the projected target levels. This is a normal market reaction: as mentioned earlier, these levels often become strong local areas of support and resistance.

BTCUSD M5: An Early Breakeven Exit Without Waiting for HTF Filter Weakness
BTCUSD example. The buy signal was supported by a green HTF Filter, and after several flat candles, price moved quickly and reached both TP1 and TP2. I moved the stop to breakeven too early, expecting a pullback after the rapid move. Price then reacted around TP2, returned to the entry area and closed the trade at breakeven.

The decision was driven by a desire to avoid a possible loss, but the HTF Filter remained green throughout the move and showed no sign of weakening bullish momentum. That did not guarantee further upside, but it was a reason not to tighten the stop immediately. Since price had already reached TP2, a more patient approach would have been to allow some room for a possible continuation toward TP3 while continuing to monitor the HTF Filter and the reaction around the projected levels.
I explained this type of trade management and the practical use of additional HTF Filter signals in more detail in an earlier article.

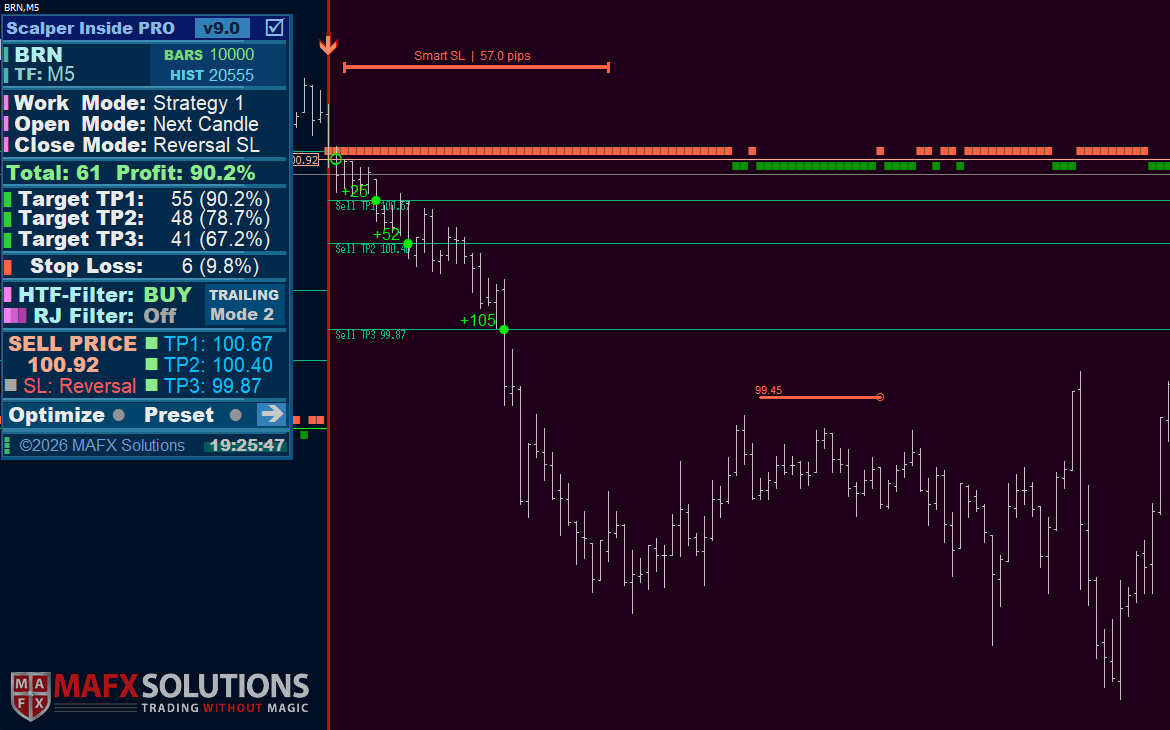
BRN M5: Another Early Breakeven Exit Despite HTF Filter Alignment
BRN example. This was almost a mirror image of the previous BTCUSD situation, but on the sell side. The HTF Filter remained aligned with the short setup and did not show a clear sign of weakening bearish momentum.

I simply lost focus and moved the stop to breakeven almost automatically. That decision did not give the trade enough room for a possible continuation toward TP3 or beyond.
The key point is to avoid moving the stop too early just out of habit. The HTF Filter does not guarantee that price will continue in the expected direction, but it can help show whether the broader momentum is still supporting the trade.

AUDCHF M5: Two Consecutive Losses – and Why They Still Matter
AUDCHF was the weakest instrument in this test, producing two consecutive losses. Without them, the overall result would have been noticeably stronger.

The first AUDCHF trade provided more room for active management. Price moved against the original sell setup and spent several candles without reaching the initial TP1 objective. It later returned and offered an opportunity to secure a smaller +42-point profit.
Price also reacted from a local support area. This did not guarantee a reversal, but it was another reason to reduce expectations for the short setup rather than continue waiting for the original TP3 objective. In situations like this, I do not always keep the original target unchanged. If price spends too long moving against the setup or fails to reach the first target within a defined number of bars, the objective can be brought closer – from TP3 to TP2, from TP2 to TP1, or eventually to breakeven.
The second loss occurred around the Australian CPI release on 30 September. At approximately 04:30 platform time (GMT+3), AUDCHF moved sharply lower in a single bearish candle, covering around 221 points. The HTF Filter turned to Sell only after the move had already developed, leaving limited practical room to react before the loss was already in progress.
This is also a reminder that important scheduled news should always be part of trade preparation and risk management. I covered my approach to monitoring high-impact economic releases in more detail in this article.
I am also working on a separate tool designed to make this part of trade preparation more convenient by bringing relevant news context into the workflow. It may become a useful addition for the Scalper Inside PRO community. More details will be shared in future updates.
Follow MAFX Solutions on Telegram for product news and updates:

WTI M5: Boring in the Best Possible Way
This WTI sell setup developed almost exactly as expected. Price moved cleanly through the projected levels, reached Sell TP3 and continued lower. The HTF Filter remained aligned with the sell direction throughout the move.

I closed the trade slightly below Sell TP3 while trailing the stop. A trader who continued to use the HTF Filter as a guide for trade management could potentially have captured additional movement after TP3. Of course, this was not guaranteed, but the filter did not show a clear reason to exit immediately.
This is the kind of trade that can feel almost boring – no major drawdown, no sudden reversal and no need for complicated decisions. The setup developed, the projected levels were reached, and the trade could be managed calmly.
I am showing this example for a reason. Many traders focus almost entirely on the most popular instruments: EURUSD, Gold or Bitcoin. But less obvious markets can sometimes offer clearer and more structured conditions.
My approach is not to force trades on one favourite instrument when its behaviour is unclear or inconsistent. It is to regularly review a wider group of markets and focus on the instruments that currently provide the cleanest conditions. The goal is not to outsmart the market. The goal is to trade what the market is offering.

XAUUSD M5: TP2 Reached, Then the Market Tried to Change Character
This XAUUSD sell setup reached TP2 at 4151.70 before price continued slightly lower. I closed the trade at 4149.87, after which price retraced higher.

At that point, the HTF Filter began to show signs of hesitation. Green squares appeared, indicating bullish HTF Filter activity, and the HTF Trailing level became visible at 4160.61. These signals did not invalidate the sell setup immediately, but they showed that the bearish move was no longer as clear as it had been earlier.
After that, price spent many bars moving around the entry area before eventually reaching TP3. Could the trade have been held for TP3? Yes, it could have. Nothing happened that clearly invalidated the original sell idea.
However, the outcome became less predictable. The HTF Filter showed a prolonged period of bullish sentiment, with around 21 green-square bars. In that situation, holding for TP3 would have required more patience and a willingness to accept a less certain outcome.
Sometimes, taking a confirmed result is more practical than waiting for a larger but less predictable move.

The examples above were selected from the original three-day real-time test. The following WTI example was recorded afterwards and is included as an additional live example of how the HTF Filter can be assessed when price pauses during an otherwise structured move.
WTI M5: Bearish Continuation After a Brief HTF Filter Pause

This WTI M5 Sell setup received clear initial Sell confirmation from the HTF Filter. As the move developed, the filter printed five consecutive red squares, supporting the bearish direction. Price then did not move through the Open Level immediately. Instead, the market paused and made a small pullback. During that pullback, the HTF Filter printed one green square, showing a brief bullish reaction.
However, the following HTF Filter signals returned to Sell. The broader bearish context remained intact, price continued lower and the trade reached TP3 without major difficulty.
This example shows why the HTF Filter is often more useful when assessed as a sequence rather than as one isolated signal. The single green square appeared during a small pullback around the Open Level, but the subsequent Sell signals confirmed that bearish momentum had returned.

XAGUSD M5: A Bird in the Hand Near TP2

This XAGUSD buy setup began from a clearly defined level. The HTF Filter turned green and remained aligned with the buy direction all the way to TP3.
The important decision point came around TP2. Price briefly moved through the level, but the candle closed directly around it rather than showing a clean continuation above it. This suggested that the level was being tested rather than decisively cleared on the first attempt. The protective level was trailed behind price as the move developed. When price turned lower, the position was closed at market at 61.205. The trade did not capture the full move to TP3, but it still closed with a solid protected profit.
Could the trade have been held until TP3? Yes. The HTF Filter remained green, and price eventually continued higher to reach TP3. However, the reaction around TP2 created a reasonable point to protect what had already been achieved rather than assume the move would continue without a deeper pullback.
Across the examples above, the projected levels repeatedly acted as meaningful reference areas rather than random lines on a chart. Price often paused, reacted or changed pace around them, which makes them useful not only as target markers but also as practical points for trade management.
This XAGUSD example shows that behaviour clearly. Price reacted around the TP2 area, paused there, and later returned toward the entry zone around 60.948 before continuing to TP3. A stop placed too close to the entry level could have been triggered during that return, even though the broader buy scenario later continued.
There is no perfect exit rule. Markets regularly test important price areas, and even a well-placed protective stop can be reached before the original direction resumes. That is why trade management has to be approached as a complete process: understand the context, monitor the signals, protect the position when appropriate and build experience with how price behaves around key levels.

SIPRO Smart SL: A Quick Stop-Distance Guide
Free Add-On for Official Users
SIPRO Smart SL is a separate indicator available free of charge to all official Scalper Inside PRO users. It is not built into Scalper Inside PRO and needs to be downloaded separately.
The download link is provided below. First, let’s explore what Smart SL adds to your chart and see it in action.
The same principle applies to stop-loss planning: no single rule can fit every trade, every instrument or every market condition. A quick visual reference can nevertheless help put the distance between a new signal and recent market structure into perspective.
That is the idea behind SIPRO Smart SL. It provides an approximate structure-based stop-distance reference for the latest SIPRO signal, displayed directly on the chart.

The Smart SL line is not a prediction, a guaranteed stop-loss price or an automatic exit instruction.
In this example, the line shows the distance between the entry area and the reference level below the Buy setup. This distance can be assessed alongside the projected TP1, TP2 and TP3 levels already displayed by Scalper Inside PRO.

Smart SL: Simple by Design
SIPRO Smart SL was designed to remain simple in practical use.
The indicator has one main setting: Smart Level Sensitivity. This setting controls how much recent market structure is reviewed when Smart SL calculates its reference level.

Lower sensitivity settings use a smaller structure range and usually create a closer, more reactive reference. Higher sensitivity settings use a wider range of recent price action and may produce a more conservative Smart SL reference.
The purpose is not to search for one perfect setting that works in every situation. Different instruments, timeframes and market conditions behave differently. Smart Level Sensitivity simply gives traders a practical way to adjust how closely or broadly Smart SL reads recent market structure.
Smart 4 is the default setting and provides a balanced starting point for many M5 charts.
Smart 1–3: Closer and more reactive structure reference
Smart 4–5: Balanced intraday structure reference
Smart 6–10: Wider and more conservative structure reference

Smart SL Across Different Timeframes
SIPRO Smart SL is not limited to M5 charts. It can also provide a structure-based stop-distance reference on other timeframes.
The following EURUSD examples show Smart SL on M15, M30 and H1. In each case, the line provides a visual reference for the distance between the latest SIPRO signal and the recent market structure on that chart.
The purpose remains the same across these timeframes: to make that distance easier to assess, not to prescribe a fixed stop-loss rule. The reference should be read in the context of the signal and price structure shown on each chart.



More Smart SL Examples
Here are a few more examples of SIPRO Smart SL across different instruments and timeframes. Alongside the Smart SL reference, pay attention to the HTF Filter signals and how they develop as price moves.



USDCAD M5: A Reference Level, Not a Wall
This USDCAD M5 Buy example illustrates an important limitation of the Smart SL reference. The chart shows an approximate stop distance of 18.0 pips, but price later moved below that reference before recovering and continuing higher to reach TP1, TP2 and TP3.

A stop-loss placed exactly at the displayed reference could have been triggered during that move, even though price eventually reached the projected targets. The later recovery does not make that stop-loss decision wrong; it simply shows that a structure-based reference cannot define the exact boundary of every pullback.
Smart SL highlights a level derived from recent market structure. It does not turn that level into a wall that price cannot cross, nor does it guarantee that a stop placed there will remain untouched. Smart SL helps put the distance into perspective; it does not replace a predefined risk-management plan.

Smart SL: Live Examples and Final Thoughts
XAUUSD: A Smoother Move with Clear HTF Alignment
This XAUUSD Buy setup developed into a smooth upward move, with seven consecutive green HTF Filter squares supporting the Buy direction. Smart SL provided a structure-based reference below the entry area, while the filter remained aligned as price advanced.

This is where the HTF Filter can help make trade assessment feel calmer: a consistent sequence of signals gives you additional context instead of leaving you to judge the move from price alone.

XAGUSD M5: A Pullback Before the Recovery
The XAGUSD Buy setup had a less straightforward start. Price pulled back to the Smart SL reference area before recovering and moving above TP1. At the time of the screenshot, the position remained open and was showing a floating profit.

The HTF Filter sequence was also more mixed, with red squares appearing during the pullbacks before green signals returned. Unlike the smoother XAUUSD example, this move required more patience and closer attention to the changing context.
Here, Smart SL provided a visible reference for the depth of the pullback, while the HTF Filter helped show how the directional context changed during the recovery.
The screenshots above captured the trades while they were still developing. Both positions were subsequently closed in profit: 206.84 on XAGUSD and 146.98 on XAUUSD, for a combined result of 353.82 in account currency.

Different price paths, complementary references. These examples illustrate how Smart SL and the HTF Filter can be read together: one puts the distance to recent structure into perspective, while the other adds directional context. Neither guarantees the outcome or replaces a risk-management plan.

Get SIPRO Smart SL for Free
SIPRO Smart SL is now available as a free standalone add-on for official Scalper Inside PRO users.
Please note: Smart SL requires Scalper Inside PRO on the same chart. It provides an approximate structure-based visual reference, not a guaranteed stop-loss level. It does not place or modify stop-loss orders.
Not using Scalper Inside PRO yet? Explore the main indicator on MQL5 Market:
🍀 Good Luck & Big Profits