

🎮 Start here: the buttons on your chart
When you attach the indicator you will see two things in the top-left corner:
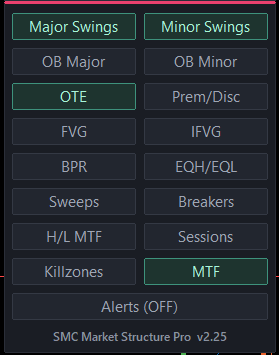
🖥️ A small panel showing the trend on six timeframes 🔘 Seventeen buttons below it, two per row
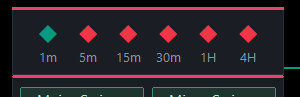
Click any button to switch that feature on or off. ⚡ It happens instantly — no settings window, no waiting.
The buttons, in order: Major Swings, Minor Swings, OB Major, OB Minor, OTE, Prem/Disc, FVG, IFVG, BPR, EQH/EQL, Sweeps, Breakers, H/L MTF, Sessions, Killzones, MTF and Alerts. 🎛️
Three things that surprise people 🤔
1️⃣ Your button choices are remembered
Turn something off and it stays off — on every chart, and after you restart MetaTrader. 💾
The Show ... on load settings are only used the very first time. After that, your clicks win.
Want to start fresh? Press F3 in MetaTrader, find the entries starting with SSB_TG_ and delete them. 🔄
2️⃣ Hidden features still send alerts 🔔
The indicator keeps watching the market even when a feature is switched off. That means:
✅ Turning a feature on shows its full history straight away ⚠️ But a hidden feature can still alert you
Only the Alerts button stops alerts completely.
3️⃣ One copy per chart 1️⃣
If you drop a second copy onto the same chart, the first quietly steps aside instead of fighting over the drawings. Tidy up the old one with Ctrl+I.
⏳ While the chart is loading
On a symbol you have not opened before, a small card appears in the middle of the chart reading Preparing chart, with a count of how many timeframes are ready. 📥
That is normal. The indicator is waiting for MetaTrader to deliver the price history and building its engines. Nothing is drawn until everything is ready, so you never see lines land in the wrong place and then jump. The card disappears on its own. ✅
🎨 CHART COLOURS
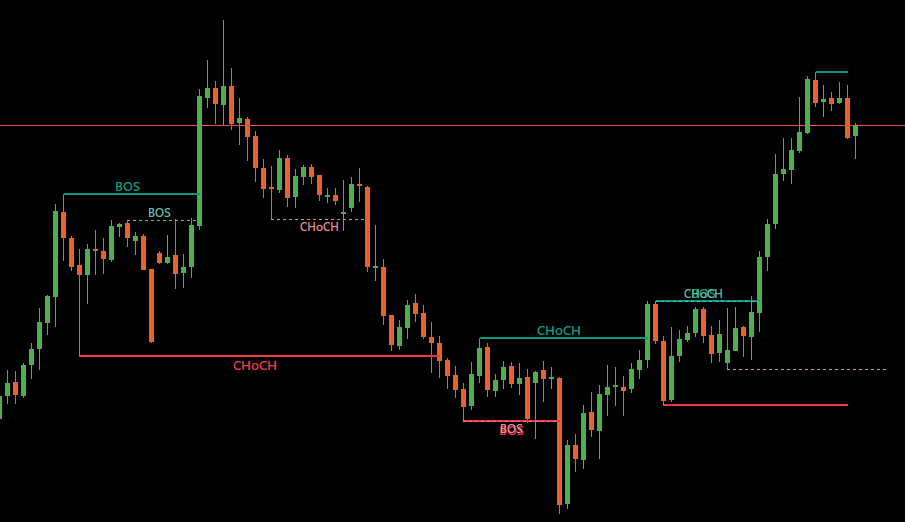
Changes the look of your chart itself — candles, background, grid.
| Setting | Default | What it does |
|---|---|---|
| 🎚️ Apply chart colour scheme on load | ✅ On | Master switch for this section |
| 🟢 Bullish candle | Green | |
| 🔴 Bearish candle | Orange-red | |
| ⬛ Chart background | Black | |
| 🔤 Axes, scale and grid text | Light grey | |
| ▦ Show grid | ❌ Off |
⚠️ Important: your original chart colours are not put back when you remove the indicator. If you would rather keep your own look, switch the master setting off. 🙅
📈 STRUCTURE - MAJOR
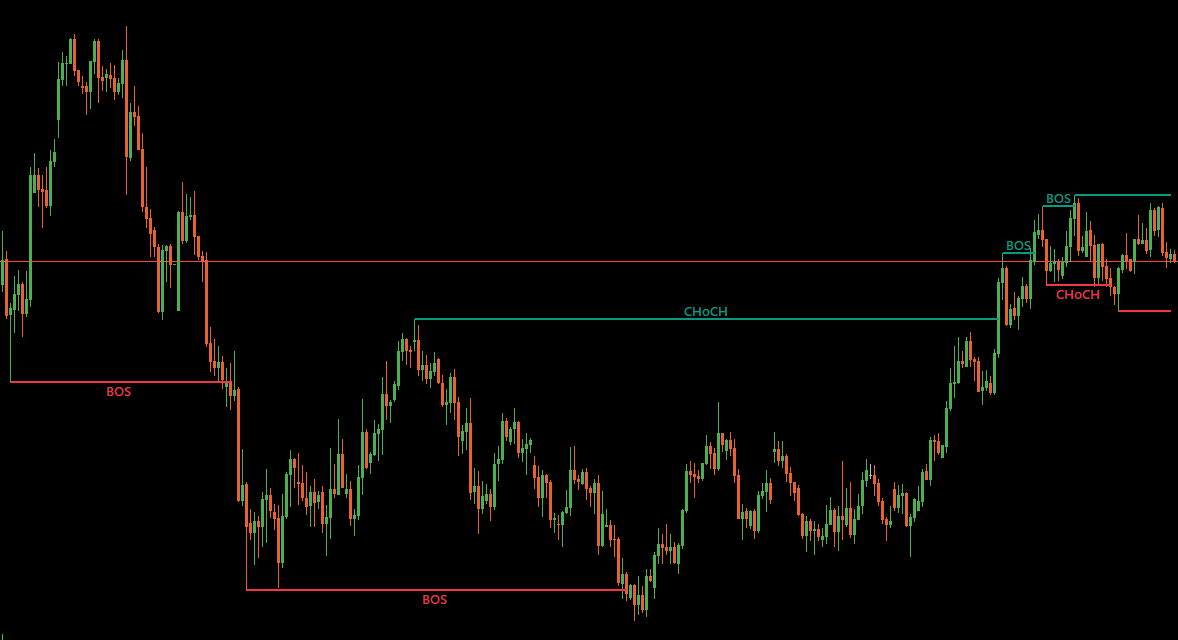
The main trend engine. Draws lines showing where the market broke structure, labelled BOS or CHoCH.
| Setting | Default | What it does |
|---|---|---|
| 👁️ Show major structure on load | ✅ On | |
| 🔢 How many bars confirm a swing | 3 | Higher = fewer, bigger swings |
| ✔️ What counts as a break | Close | Candle closes past it, or just touches |
| 🕯️ Use candle body instead of high / low | ❌ Off | Ignores wick spikes |
| 👀 Which lines to show | Broken + current | Four choices |
| 🟩 Bullish line | Teal | |
| 🟥 Bearish line | Red | |
| 📏 Line width | 2 | |
| 🏷️ Write BOS / CHoCH on the lines | ✅ On | |
| 🔠 Label size | 8 | |
| 🗂️ How many lines to keep | 20 | Oldest disappear |
💡 The one setting to know
How many bars confirm a swing controls sensitivity. A swing needs the market to actually pull back, not just drift sideways.
📉 Lower number (2–3) → more swings, more signals 📈 Higher number (5–8) → fewer swings, only the big turns
❓ BOS or CHoCH — what's the difference?
🔵 BOS (Break of Structure) — the trend carried on in the same direction 🟠 CHoCH (Change of Character) — the trend flipped
Same line, different label. The indicator works it out for you. 🤖
📉 STRUCTURE - MINOR
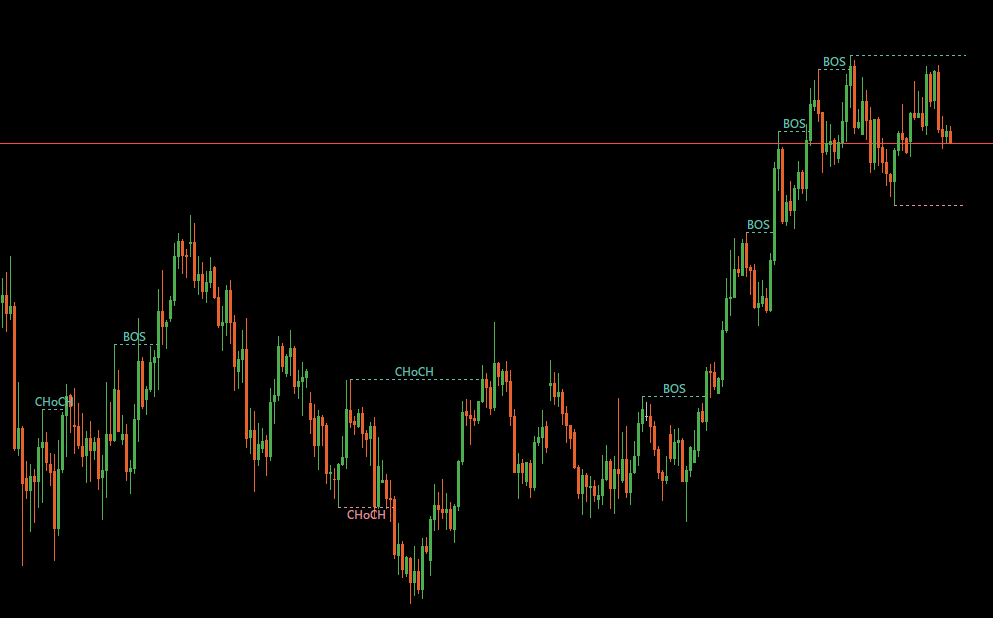
A second engine watching the smaller moves inside each big one. Draws dotted lines so you can tell them apart. ┈┈┈
| Setting | Default | What it does |
|---|---|---|
| 👁️ Show minor structure on load | ✅ On | |
| 🔢 Bars either side of a high or low | 5 | Lower = more sensitive |
| 🟩 Bullish line | Soft teal | |
| 🟥 Bearish line | Rose | |
| 📏 Line width | 1 | |
| 🏷️ Write BOS / CHoCH on the lines | ✅ On | |
| 🔠 Label size | 7 | |
| 🙈 Hide minor breaks that repeat a major one | ❌ Off | |
| 🗂️ How many lines to keep | 20 |
💡 On a noisy pair, try raising bars either side for less clutter.
👉 A short dotted stub reaches a few bars past the current candle. That marks a level the market has not broken yet — one to watch. 👀
🖥️ TREND TABLE
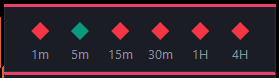
The panel at the top showing trend direction across six timeframes at once. Perfect for checking whether the bigger picture agrees with your entry. 🎯
| Setting | Default | What it does |
|---|---|---|
| 👁️ Show MTF panel on load | ✅ On | |
| 🎨 Panel layout | Strip | Row of dots, or a list |
| 🔤 Value shown (list layout only) | Numeric | Numbers, words or arrows |
| 1️⃣ Slot 1 enabled + timeframe | ✅ M1 | Pick any timeframe |
| 2️⃣ Slot 2 enabled + timeframe | ✅ M5 | |
| 3️⃣ Slot 3 enabled + timeframe | ✅ M15 | |
| 4️⃣ Slot 4 enabled + timeframe | ✅ M30 | |
| 5️⃣ Slot 5 enabled + timeframe | ✅ H1 | |
| 6️⃣ Slot 6 enabled + timeframe | ✅ H4 | |
| 📚 History used per timeframe | 400 |
🟢 Green = uptrend 🔴 Red = downtrend ⚪ Grey = no trend yet, or still loading
⚡ Speed tip: each enabled slot runs its own engine. Switching off timeframes you never look at is the quickest way to lighten the load. 🪶
ℹ️ These dots update live rather than waiting for the candle to close — a higher-timeframe dot flips the moment price takes that level, instead of leaving you hours behind.
📝 The panel keeps its width whichever timeframes you switch off, so it always lines up with the buttons underneath.
🎯 OPTIMAL TRADE ENTRY
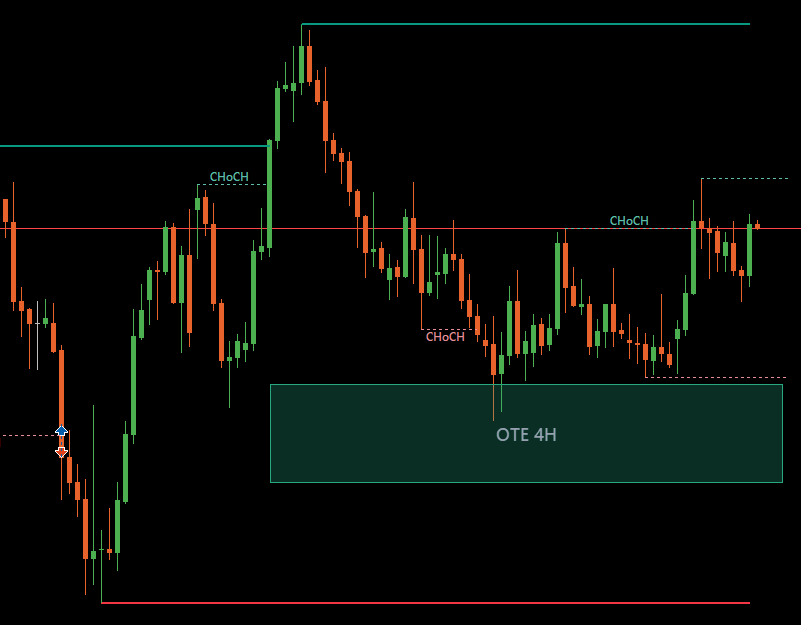
Draws the classic retracement band where price often returns before continuing. 📐
| Setting | Default | What it does |
|---|---|---|
| 👁️ Show OTE zone on load | ✅ On | |
| ⏱️ Timeframe the zone is based on | H4 | Any timeframe you like |
| 📊 Zone near edge | 0.62 | |
| 📊 Zone far edge | 0.79 | |
| 🟢 Bullish zone | Green | |
| 🔴 Bearish zone | Red | |
| 🔤 Label text colour | Grey | |
| 🔠 Label size | 11 |
⚖️ PREMIUM AND DISCOUNT
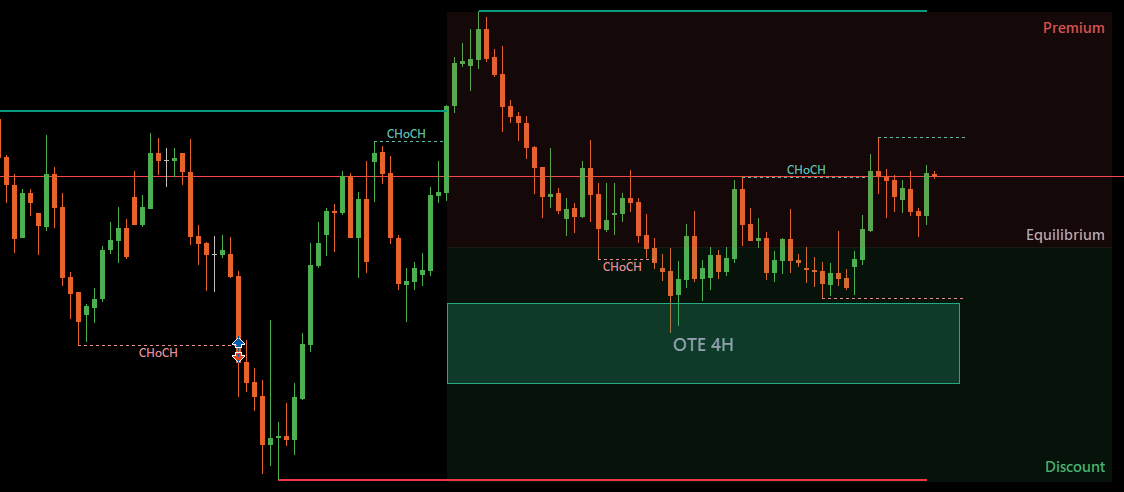
Splits the current dealing range in half. The upper half is premium — expensive, where you would rather be selling. The lower half is discount — cheap, where you would rather be buying. The line between them is equilibrium. 📊
| Setting | Default | What it does |
|---|---|---|
| 👁️ Show premium / discount on load | ❌ Off | |
| ⏱️ Timeframe the range is based on | H4 | Any timeframe you like |
| ➡️ Draw past the last candle | 22 bars | |
| 🏷️ Show the labels | ✅ On | |
| 🔠 Label size | 9 | |
| 🌗 How solid the halves look | 26 | Deliberately faint |
| 🔴 Premium half | Red | |
| 🟢 Discount half | Green | |
| ⬜ Equilibrium line | Grey |
📝 This reads the same range as the OTE zone, so the two always agree — the OTE band sits inside the discount half in an uptrend, and inside the premium half in a downtrend.
💡 Note the colours are about where price is, not which way it is going: premium carries the bearish colour whatever the trend, because that is the expensive end of the range.
✨ Like OTE, it can follow a higher timeframe than your chart.
🕳️ FAIR VALUE GAPS
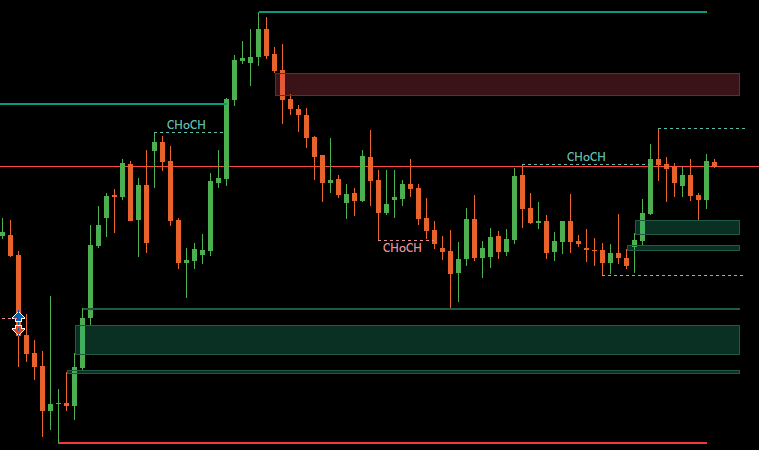
Gaps left behind when price moves too fast for the candles to overlap. Price often comes back to fill them. 🔙
| Setting | Default | What it does |
|---|---|---|
| 👁️ Show gaps on load | ❌ Off | |
| 🔄 When price fills the gap | Shrink | Keep, shrink or remove |
| 📏 Ignore gaps thinner than | 0 | 0 = show them all |
| 🗂️ How many gaps to keep | 20 | |
| ➡️ Draw past the last candle | 3 bars | |
| 🎨 Shade the gap | ✅ On | Off = outline only |
| 🟩 Bullish fill and border | Green | |
| 🟥 Bearish fill and border | Red |
🔄 What the three fill options do
🟰 Keep — the gap stays exactly as it was, filled or not ✂️ Shrink — trims to the part still unfilled (recommended 👍) 🗑️ Remove — vanishes as soon as price touches it
💡 On fast pairs, set ignore gaps thinner than to a few points. Otherwise almost every candle leaves a tiny gap and the chart fills with noise. 🧹
🔄 INVERSE FVG
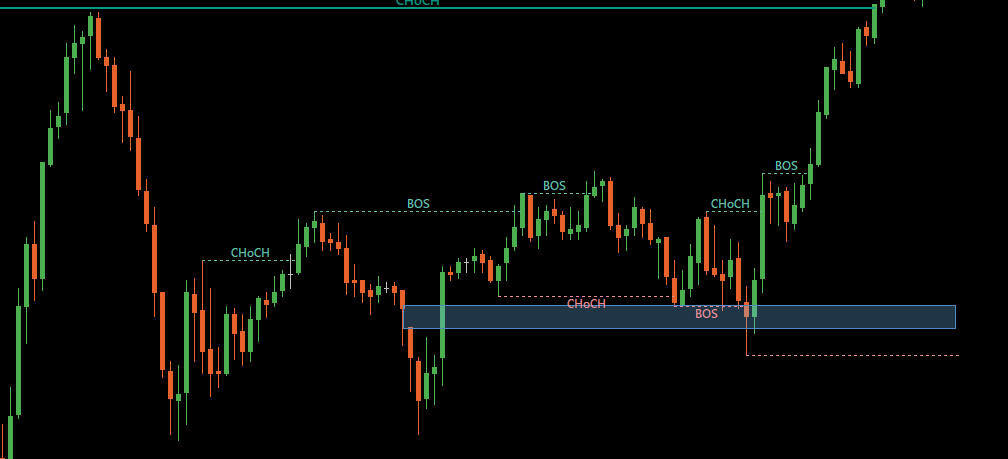
A gap that failed. Price blew straight through it instead of respecting it.
The idea: a level that failed as support often becomes resistance. So the indicator keeps it, the other way round. ↕️
| Setting | Default | What it does |
|---|---|---|
| 👁️ Show inverse FVGs on load | ❌ Off | |
| 🔄 When price trades back through | Remove | |
| 🗂️ How many zones to keep | 12 | |
| ➡️ Draw past the last candle | 3 bars | |
| 🎨 Shade the zone | ✅ On | |
| 🟦 Bullish fill and border | Blue | |
| 🟧 Bearish fill and border | Orange |
📝 A broken bullish gap becomes a bearish zone — and the other way round. That flip is the whole point. 🔃
⚖️ BALANCED PRICE RANGE
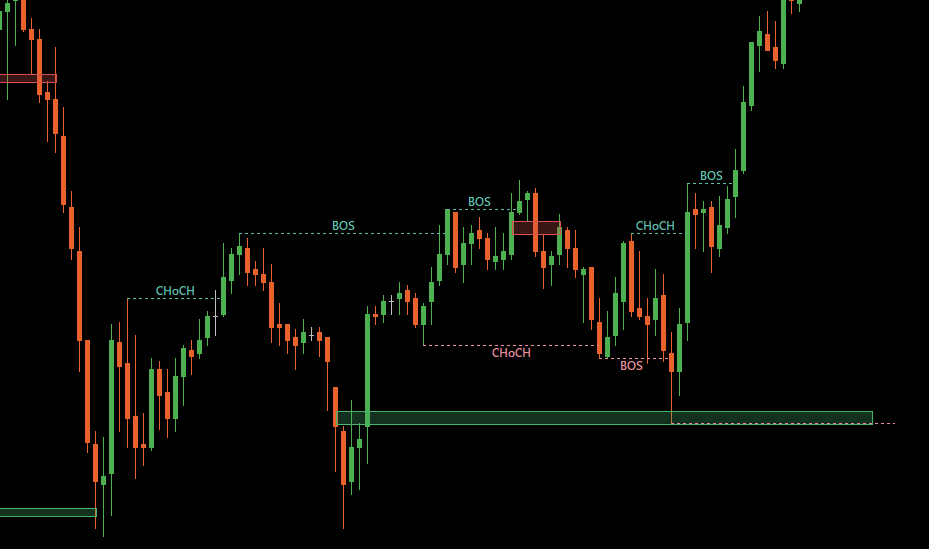
Where two gaps in opposite directions overlap. The market left that area untraded going both ways, which makes it a stronger level than either gap alone. 💪
| Setting | Default | What it does |
|---|---|---|
| 👁️ Show BPRs on load | ❌ Off | |
| 📏 Ignore zones thinner than | 0 | |
| ↔️ How far apart the two gaps may be | 10 bars | |
| ✨ Only if price stayed clear until it formed | ❌ Off | Stricter, cleaner zones |
| 🗑️ Remove zones once they stop working | ❌ Off | Off = keeps the history |
| 🗂️ How many zones to keep | 10 | |
| ➡️ Draw past the last candle | 1 bar | |
| 🎨 Shade the zone | ✅ On | |
| 🟩 Bullish fill and border | Green | |
| 🟥 Bearish fill and border | Red |
⚠️ How far apart the two gaps may be is the important one. Without a limit, two unrelated gaps that happen to share a price would pair up and create a zone stretching across your whole chart. 😬
📏 EQUAL HIGHS / LOWS
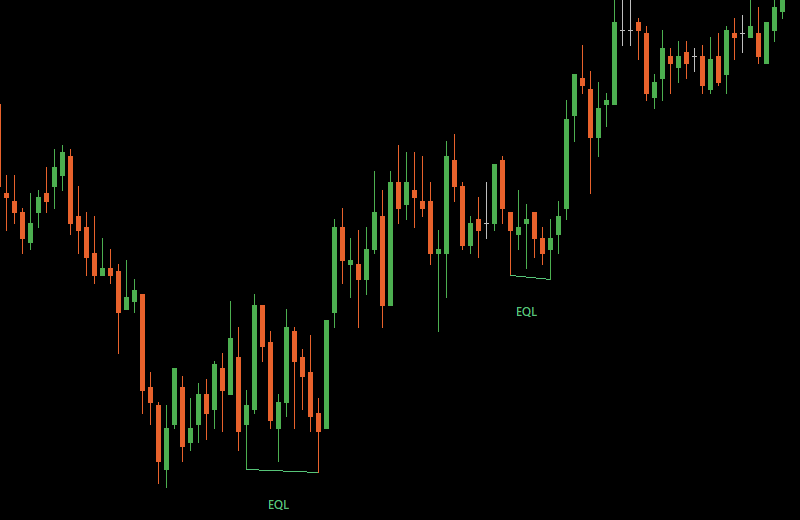
Marks where the market made two highs (or two lows) at almost the same price. Those levels attract price. 🧲
| Setting | Default | What it does |
|---|---|---|
| 👁️ Show EQH / EQL on load | ❌ Off | |
| 🔢 Bars either side of a high or low | 4 | |
| ⏳ Wait for the swing to be confirmed | ✅ On | Safer, slightly slower |
| 📊 Volatility period used for tolerance | 200 | |
| 🎯 How close counts as equal | 0.10 | 10% of normal movement |
| 🗂️ How many pairs to keep | 20 | |
| 🏷️ Write EQH / EQL on the lines | ✅ On | |
| 🔠 Label size | 7 | |
| 🔴 Equal highs | Red | |
| 🟢 Equal lows | Green | |
| 📏 Line width | 1 |
✨ Why it works everywhere: "equal" is measured against how much the market normally moves, not a fixed pip count. The same setting works on gold, indices and forex — no adjusting needed when you switch instrument. 🌍
Want more matches? Raise it to 0.15 or 0.20. Want only near-perfect pairs? Drop to 0.05. 🎚️
💧 LIQUIDITY SWEEPS
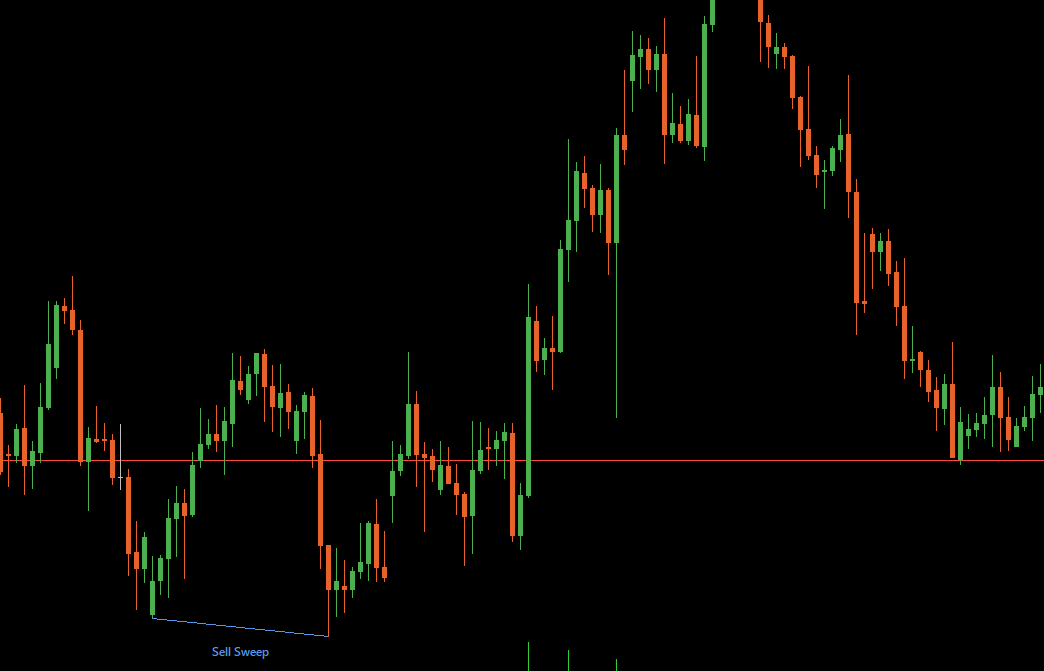
Marks the moment price spikes past a level and snaps straight back. Classic stop hunt behaviour. 🎣
| Setting | Default | What it does |
|---|---|---|
| 👁️ Show sweeps on load | ❌ Off | |
| 🔢 Bars either side of a high or low | 20 | |
| 👀 How many levels to watch at once | 3 | Per side |
| 🗂️ How many past sweeps to keep | 20 | |
| 📊 Volatility period for label spacing | 14 | |
| 🔍 Also show the levels being watched | ❌ Off | |
| 📏 Level line width | 2 | |
| 🔴 Resistance level | Red | |
| 🟢 Support level | Green | |
| 🟣 High sweep | Purple | |
| 🔵 Low sweep | Blue | |
| 🏷️ Write Buy / Sell Sweep on the chart | ✅ On | |
| 🔠 Label size | 7 |
🎣 Sweep or break?
⚡ Sweep — price pushed past the level but closed back inside → marked and labelled 💥 Break — price closed beyond it → the level is simply gone, no mark
📝 Naming: a sweep of a resistance is called a Buy Sweep 🟣 — because the buy orders sitting above old highs are what got taken.
👀 By default you only see completed sweeps. Turn on also show the levels being watched to see what the indicator is tracking.
🧱 BREAKER BLOCKS
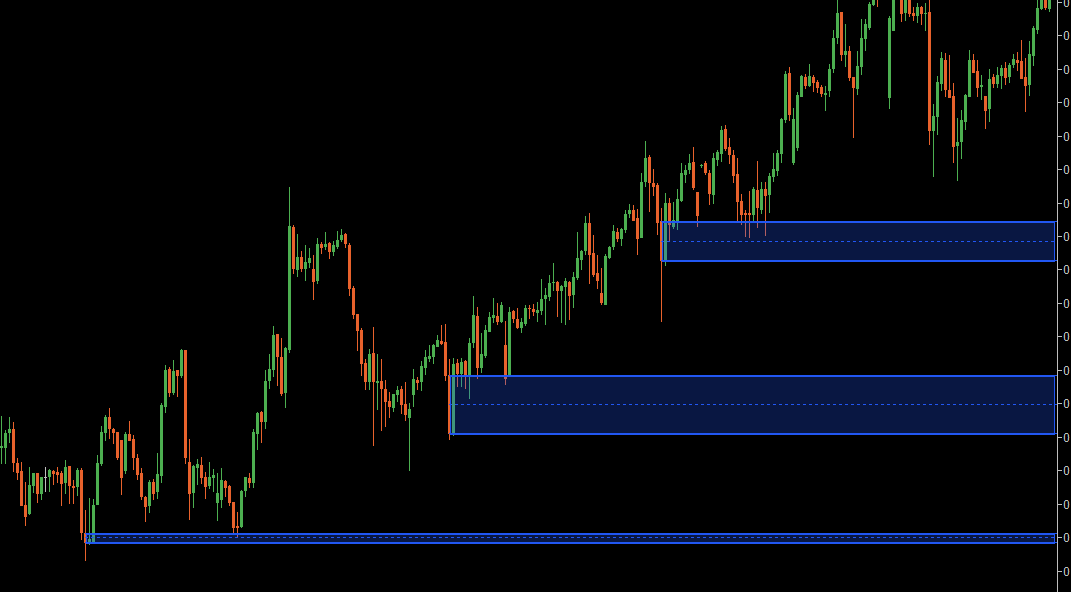
Order blocks that got broken and flipped sides. What was support becomes resistance. ↕️
| Setting | Default | What it does |
|---|---|---|
| 👁️ Show breaker blocks on load | ❌ Off | |
| 🎚️ How strict the detection is | Strict | Sensitive / balanced / strict |
| 🔢 How many bullish blocks to show | 3 | |
| 🔢 How many bearish blocks to show | 3 | |
| 🕯️ Use candle body instead of high / low | ✅ On | |
| 🔺 Mark where blocks flipped direction | ✅ On | Small arrows |
| 🔵 Bullish block | Blue | |
| 🔴 Bullish block after it breaks | Red | |
| 🟠 Bearish block | Orange | |
| 🟢 Bearish block after it breaks | Green |
🎚️ Choosing the strictness
🔍 Sensitive — lots of blocks, including small ones ⚖️ Balanced — a middle ground 🎯 Strict — only the significant blocks (default)
📝 The box stops at the candle that broke it, and the lines carry on to the right in a new colour — so you can see exactly where it flipped. A dotted line through the middle marks its centre. ➖
🟦 ORDER BLOCKS — MAJOR & MINOR
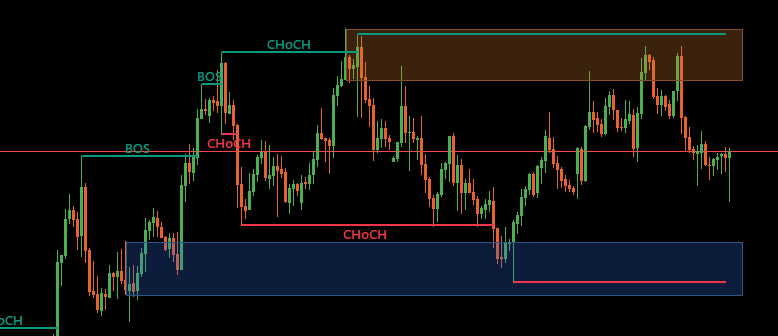
The last opposing candle before a move that broke structure. Price often returns to these. 🔙
Two separate sets: 🔷 Major follows the big structure, 🔹 Minor the small structure. Each has its own button and its own settings.
| Setting | Major | Minor |
|---|---|---|
| 👁️ Show blocks on load | ❌ Off | ❌ Off |
| 🔄 When price trades back through | Remove | Remove |
| 🕯️ Use candle body instead of high / low | ❌ Off | ❌ Off |
| 🔍 How far back to look | 20 bars | 10 bars |
| 🗂️ How many blocks to keep | 12 | 10 |
| ➡️ Draw past the last candle | 3 bars | 3 bars |
| 🎨 Shade the block | ✅ On | ✅ On |
| 🎨 Fill and border colours | Blue / amber | Lighter tints |
📍 Where the block is placed
The indicator looks only inside the move that broke structure — from the swing it started at, to the candle that broke it. Within that stretch it finds the turning point and takes the last opposing candle.
👉 That means a block always sits underneath its own structure line, never floating somewhere unrelated. ✅
🕯️ Wicks don't count
A block is only removed when a candle closes past it. A wick poking through is a rejection, not a failure — the level did its job. 💪
📊 ZONE VOLUME
Splits every order block and gap by the buying and selling that happened inside it. 🔍
| Setting | Default | What it does |
|---|---|---|
| 👁️ Show volume split on major blocks | ✅ On | |
| 👁️ Show volume split on minor blocks | ✅ On | |
| 👁️ Show volume split on fair value gaps | ✅ On | |
| 🔢 Also print the total | ✅ On | Sits outside the right edge |
| 🔤 Percentage text colour | White | |
| 🟦 Total volume colour | Teal | |
| 🔠 Text size | 7 |
The zone is shaded left to right in proportion — a block that was 70% buying shows a green portion twice the width of the red. The percentages are written in each half. 📐
💡 What this tells you: a bullish block built almost entirely of selling volume is a weaker level than one built on buying. The split makes that visible without leaving the chart. 👀
⚠️ Read this before trusting the numbers
On forex this is tick volume, not real traded volume — most brokers don't publish the real thing. It counts how many times price changed, not how much money moved. 📉
It is still a fair guide to which side was more active, and on indices and futures where real volume is available it is exactly that. But it is not institutional order flow, and no one should treat it as such. 🙂
📅 HIGHS AND LOWS MTF
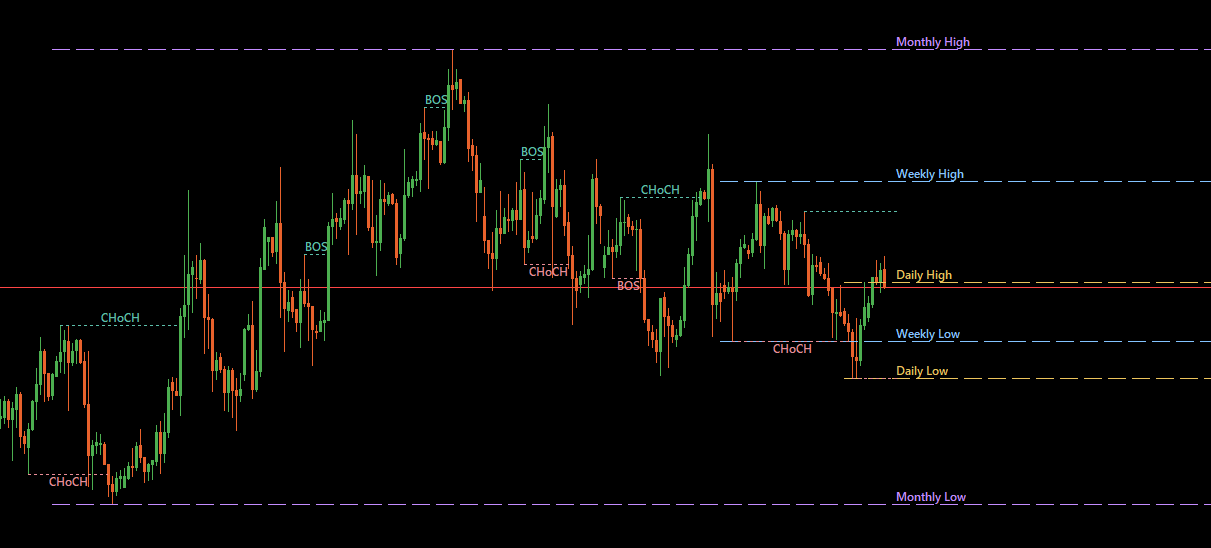
Draws the previous day's, week's and month's high and low as dashed lines across your chart. Simple levels, and among the most watched in the market. 🎯
| Setting | Default | What it does |
|---|---|---|
| 👁️ Show highs and lows on load | ❌ Off | |
| 📆 Daily | ✅ On | Previous day's high and low |
| 🗓️ Weekly | ✅ On | Previous week's |
| 📅 Monthly | ✅ On | Previous month's |
| 🔢 How many periods back to show | 1 | Raise for more history |
| 🟡 Daily lines | Gold | |
| 🔵 Weekly lines | Light blue | |
| 🟣 Monthly lines | Violet | |
| ┈ Line style | Dashed | |
| 📏 Line width | 1 | |
| 🏷️ Show the level name | ✅ On | |
| 🔠 Label size | 7 |
💡 These work well with liquidity sweeps — a spike through yesterday's high that closes back below is a textbook stop hunt. 🎣
📝 Raising how many periods back to show adds the day before that, and so on. Two or three is usually plenty before the chart gets busy.
🕐 SESSIONS
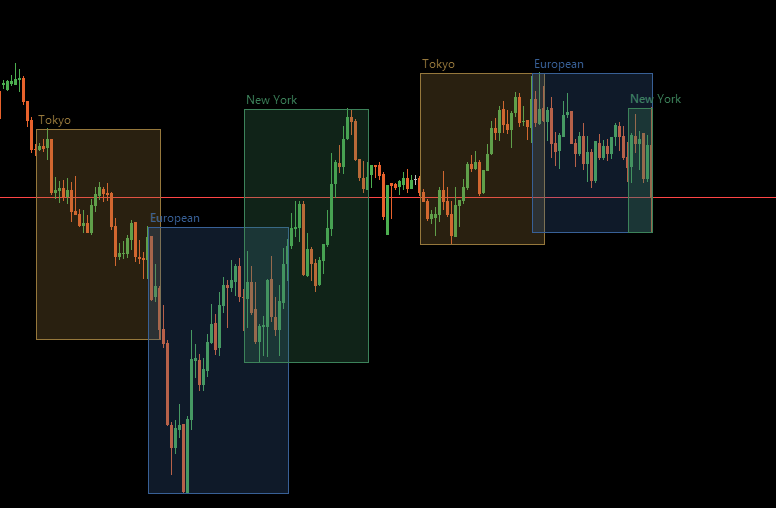
Shades the trading day into its four regional sessions, so you can see at a glance which part of the world was driving the move. 🌍
| Setting | Default | Times (server) |
|---|---|---|
| 👁️ Show sessions on load | ❌ Off | |
| 🇦🇺 Session 1 — Sydney | ❌ Off | 01:00 – 09:00 |
| 🇯🇵 Session 2 — Tokyo | ✅ On | 02:00 – 10:00 |
| 🇪🇺 Session 3 — European | ✅ On | 09:00 – 18:00 |
| 🇺🇸 Session 4 — New York | ✅ On | 15:00 – 23:00 |
Each session has its own name, start time, end time and colour — all editable. Rename them, move them, or repurpose a spare slot for any window you care about. ✏️
⏰ KILLZONES
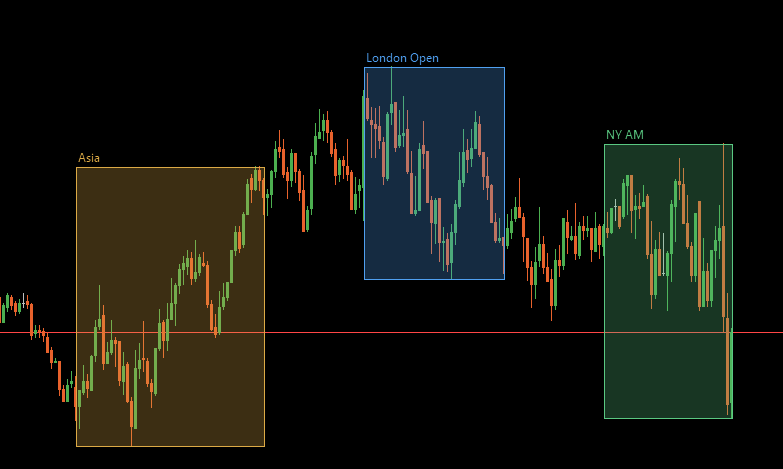
The narrower high-activity windows inside those sessions, where the moves that matter tend to begin. ⚡
| Setting | Default | Times (server) |
|---|---|---|
| 👁️ Show killzones on load | ❌ Off | |
| 🌏 Killzone 1 — Asia | ✅ On | 03:00 – 07:00 |
| 🇬🇧 Killzone 2 — London Open | ✅ On | 09:00 – 12:00 |
| 🗽 Killzone 3 — NY AM | ✅ On | 14:00 – 17:00 |
| 🌆 Killzone 4 — NY PM | ❌ Off | 20:00 – 23:00 |
As with sessions, every name, time and colour can be changed. 🎨
🕰️ SESSIONS AND KILLZONES — DISPLAY
Shared settings for both of the above.
| Setting | Default | What it does |
|---|---|---|
| 🌐 Detect the broker time zone automatically | ✅ On | |
| 🕓 Times above are written for GMT+ | 3 | The zone the defaults assume |
| 🔧 Manual shift if not detecting (hours) | 0 | |
| 📆 How many days back to show | 5 | |
| 🎨 Shade the box | ✅ On | Off = outline only |
| 🏷️ Show the name | ✅ On | |
| 🔠 Label size | 7 |
🔗 SMT DIVERGENCE
Two markets that normally move together, disagreeing. 🤝➡️💔
When EURUSD makes a higher high and GBPUSD doesn't, the second market is refusing to confirm the first. That refusal often comes right before the turn.
| Setting | Default | What it does |
|---|---|---|
| 👁️ Show on load | ✅ On | |
| 🔤 Comparison symbol | (blank) | Type it exactly as your broker names it |
| 🔢 Pivot lookback | 5 | Higher = fewer, bigger swings |
| 🔴 Swing high divergence | Red | |
| 🔵 Swing low divergence | Blue | |
| 📏 Line width | 1 | |
| 🏷️ Label with the comparison symbol | ✅ On | |
| 🔠 Label size | 7 | |
| 🗂️ How many divergences to keep | 20 |
⚙️ You have to name the symbol first.
Nothing is drawn until you do. Type it exactly as it appears in Market Watch — EURUSD.raw, XAUUSD-ECN, whatever your broker uses. Get it wrong and the indicator tells you in the Experts tab rather than sitting there silently. 📋
The label shows the tidy version, so EURUSD.raw reads as EURUSD. ✂️
🤝 Which pairs?
Anything that normally moves together. EURUSD and GBPUSD. Gold and silver. 🥇🥈
Inverse pairs work too, with no setting to change — EURUSD against USDCHF diverges on exactly the bars a correlated pair would agree. 🔀
📐 How it decides
Both markets must turn on the same candle. Then one went up while the other went down — that's the divergence, and a line is drawn back to the previous swing with the other symbol's name on it. 🏷️
If only one of them turns, nothing is marked and the indicator re-anchors. It would rather stay quiet than compare two swings that happened at different moments. 🤐
⏳ Divergences appear five candles after the swing that caused them — that's the pivot being confirmed, same as Equal Highs / Lows.
💨 BREAKAWAY FVG
A gap the market is not expected to come back to. 🚀
An ordinary fair value gap is an invitation: price left something behind and usually returns for it. A breakaway gap is the opposite — the move is still running, and waiting for a retracement means watching it leave without you. 🏃
| Setting | Default | What it does |
|---|---|---|
| 👁️ Show on load | ✅ On | |
| 💨 Breakaway FVGs | ✅ On | |
| 🐌 Weak 3rd candle FVGs | ✅ On | |
| 🟡 Breakaway FVG | Yellow | |
| 🟢 Weak 3rd candle FVG | Lime | |
| 🔵 Mitigated part | Aqua | |
| 🌗 Mitigated part opacity | 0 | 0 = don't show it |
| 🗂️ How many zones to keep | 20 | |
| ➡️ Extend boxes to the current bar | ✅ On | Off = a short stub at the gap |
| 📐 ...and this many bars past it | 3 | |
| ➖ Plot midlines | ❌ Off | The 50% of each gap |
| ⬜ Midline colour | Silver | |
| 📏 Midline width | 2 |
🕯️ The third candle decides
Three candles make the gap. The third one tells you which kind it is: 🔍
💨 Breakaway 🟡 — the third candle closes past the big candle's own high (or low). The move is still going. Price is not expected back.
🐌 Weak 3rd candle 🟢 — it doesn't. The move is running out of steam, and the gap is the ordinary sort you can trade back into.
Both are drawn, each with its own colour and its own switch. Seeing which kind formed is the whole point. 👀
💪 These are stricter than the FVG section
A gap only appears here if the big candle's body covers the whole gap — not just its wicks. A gap held open by a long shadow doesn't count. 🚫
So you get fewer of them, and they sit on top of gaps the FVG section is already drawing. Switch the FVG button off to see these on their own. 🎛️
🔄 The zones shrink as price eats into them and disappear once it passes through. Turn mitigated part opacity up if you want to see how much has already been taken.
🔔 ALERTS
Thirty-seven alert types, grouped by feature so you can switch on only what you trade. 🎛️
| Section | Alerts available |
|---|---|
| 📈 Major structure | Bullish BOS, Bullish CHoCH, Bearish BOS, Bearish CHoCH |
| 📉 Minor structure | Bullish BOS, Bullish CHoCH, Bearish BOS, Bearish CHoCH |
| 🟦 Order blocks | Major bullish touched, Major bearish touched, Minor bullish touched, Minor bearish touched |
| 🎯 Optimal trade entry | OTE zone touched |
| 🕳️ Fair value gaps | Bullish formed, Bearish formed, Bullish touched, Bearish touched |
| 🔄 Inverse FVG | Bullish formed, Bearish formed, Bullish touched, Bearish touched |
| ⚖️ Balanced price range | Bullish formed, Bearish formed, Bullish touched, Bearish touched |
| 📏 Equal highs / lows | Equal highs formed, Equal lows formed |
| 💧 Liquidity sweeps | Buy liquidity sweep, Sell liquidity sweep |
| 🧱 Breaker blocks | Bullish breaker touched, Bearish breaker touched |
| 📅 Highs and lows MTF | Daily high, Daily low, Weekly high, Weekly low, Monthly high, Monthly low |
Delivery
| Setting | Default | What it does |
|---|---|---|
| 💻 Terminal popup | ✅ On | Alert window in MetaTrader |
| 📱 Push notification | ❌ Off | To the MetaTrader mobile app |
✅ Good to know
⏱️ Alerts fire when the candle closes — no false alarms from wicks that reverse 1️⃣ Touch alerts fire once per zone, so price sitting inside won't spam you 🤫 No burst on startup — attaching the indicator won't replay old events 🔘 The Alerts button silences everything at once, and remembers your individual choices for when you turn it back on
📱 For push notifications, set your MetaQuotes ID in MetaTrader under Tools → Options → Notifications first.
🎯 TRADE SETUP ⭐ PRO
The indicator watching all its own signals and telling you when they line up. 🤝
Instead of reading six features and deciding yourself, this waits for one specific sequence and draws the entry, stop and target when it happens. 📍
📋 The four rules
1️⃣ Both higher timeframes agree — H1 and H4 pointing the same way. No trades against the bigger picture.
2️⃣ Liquidity was taken — a sweep on the opposite side, on your chart or on either higher timeframe. The stop hunt comes first. 🎣
3️⃣ Minor structure breaks — a CHoCH or BOS in the direction of the higher timeframes. This is the confirmation.
4️⃣ Entry at the block — the order block that break produced becomes the entry zone. 🟦
All four, in that order. Miss one and there is no setup. ❌
| Setting | Default | What it does |
|---|---|---|
| 🎚️ Enable | ✅ On | Master switch |
| ⏱️ Trend timeframe 1 | 1 Hour | First agreement check |
| ⏱️ Trend timeframe 2 + Premium / Discount | 4 Hours | Second, and the range source |
| 💧 Sweep timeframe 1 | 1 Hour | Where sweeps also count |
| 💧 Sweep timeframe 2 | 4 Hours | |
| ⚖️ Premium / discount filter | ❌ Off | Only buy in discount, sell in premium |
| 🕳️ Sweep must touch FVG | ❌ Off | Extra confluence |
| ⏱️ FVG timeframe | 1 Hour | |
| 📊 Add spread to entry | ✅ On | Entry you can actually get filled at |
| 📏 Entry offset (pips) | 1.0 | |
| 🛑 Stop placement | Structure break | Or beyond the sweep |
| 📏 Stop buffer (pips) | 2.0 | |
| 🎯 Target (reward : risk) | 2.0 | 1:2 by default |
| 🗂️ Setups to keep | 5 | |
| ⏳ Setup lifetime (hours) | 24 | Counted in bars, so weekends don't burn it |
🎨 TRADE SETUP — STYLE
| Setting | Default |
|---|---|
| 🟩 Reward shading | Green |
| 🟥 Risk shading | Red |
| 🎯 Target line | Teal |
| 🛑 Stop line | Red |
| ⬜ Entry line | White |
| 🌫️ Pre-break shading | Near-black |
| 🌗 ...how strong (%) | 55 |
| 🔠 Label size | 8 |
📖 Reading the box
The green half is what you stand to make, the red half what you risk. Entry, SL and TP are labelled with their prices on the right. 🏷️
🌫️ The dimmed left portion runs from the sweep to the structure break. The setup does not exist yet in that stretch — its clock has not started. The full-strength part is the live window, so you can see how much of it is left without counting bars. ⏳
▲ A small arrow appears under the candle that reached the entry. ✓ A tick appears next to TP or SL when the trade finishes.
📋 The Last Trade Setup table
Sits under the buttons and reads out the current setup in words: both trend readings, where the sweep came from, which way structure broke, the three prices, and the status. 📊
Status tells you where things stand: Waiting For Entry, In Trade, Target Reached, Stopped Out or Expired Unfilled.
💡 When both trend timeframes are set the same, the table shows one row instead of two — because that is one check, not two. ✅
🔘 The Trade Signal button
An eighteenth button, alongside Alerts at the bottom of the block. Both take a full row of their own — they are not feature toggles like the sixteen above, and the extra width lets them say what state they are in. 📐
⭐ PRO — reads Trade Signal (ON) or (OFF). Switching it off hides the setup boxes so you can see the price action underneath, but the model keeps running. Setups formed while hidden are still there when you switch back, and the Last Trade Setup table stays up so the numbers are still readable. 👀
🆓 Free — reads Trade Signal (Upgrade) and opens a card showing what the feature does.
💧 Higher-timeframe sweep alerts
Sweeps happening on timeframes you are not looking at. ⏰
| Setting | Default |
|---|---|
| ⏱️ Higher timeframe 1 | 1 Hour |
| 🔔 Sweep on higher timeframe 1 | ❌ Off |
| ⏱️ Higher timeframe 2 | 4 Hours |
| 🔔 Sweep on higher timeframe 2 | ❌ Off |
💡 Trade an M5 chart and get told the moment H4 liquidity is taken — without an H4 chart open. 🎯
🟦 Order blocks — new setting
| Setting | Default | What it does |
|---|---|---|
| 🕳️ Only blocks joined to a gap | ❌ Off | Both major and minor |
Only creates a block when a fair value gap sits directly against it. Far fewer blocks, and the ones you get are the ones with an imbalance behind them. 💪
🔔 Trade setup alerts ⭐ PRO
| Alert | Fires when |
|---|---|
| 🎯 Setup Formed | All four rules line up |
| ▶️ Entry Touched | Price reaches the entry |
| ✅ Target Reached | The trade wins |
| 🛑 Stop Reached | The trade loses |
⚙️ GENERAL
| Setting | Default | What it does |
|---|---|---|
| 🌗 How solid the zones look | 70 | 0 = invisible, 255 = solid |
| 📚 History to scan | 5000 bars | 0 = everything loaded |
🎨 Zone opacity also controls how much overlapping zones darken each other — handy for spotting where several levels stack up. 🔍
⚡ Speed tip: if MetaTrader feels sluggish, lower history to scan to around 1500. Every feature reads every bar, so this is the biggest single lever. 🪶



