
Funded Titan: First Trading Month Review on EURUSD H1 — 2% and 4% Risk Models

Funded Titan: First Trading Month Review on EURUSD H1 — 2% and 4% Risk Models
A good Expert Advisor should not be judged only by a beautiful balance curve. It is important to look deeper: how many trades were opened, how the system handles losing trades, how controlled the drawdown remains, and whether the result is built on repeatable logic, not on one random lucky trade.
In this review, I am not looking at a general long-term backtest. Instead, I am focusing on a more specific period — the first trading month of Funded Titan. This type of review is useful because it shows how the EA behaves during a concentrated market period: how often trades appear, how evenly the result is formed, how drawdown develops, and whether the system keeps its logic after losing trades.
For comparison, I used two risk models — 2% and 4%. This allows us to see not only the difference in final profit, but also how the pressure on the account changes while the trading logic remains the same.
In the future, I plan to publish these reviews regularly — in the form of weekly reports. This will make it possible to track Funded Titan not only through long-term tests, but also through separate market periods, where it is easier to see how the EA behaves under current conditions.
Test Conditions
Symbol: EURUSD
Timeframe: H1
Platform: MetaTrader 5
Initial Deposit: $100,000
History Quality: 100%
Total Trades: 37
Both tests use the same Funded Titan trading logic. The only difference is the risk level per trade. This is an important point because the comparison shows not two different strategies, but one system operating under two different risk management modes.
The purpose of this review is not to show a guaranteed future result. The purpose is to show how Funded Titan behaved during a specific trading month and to give users more information before they test the demo version themselves.
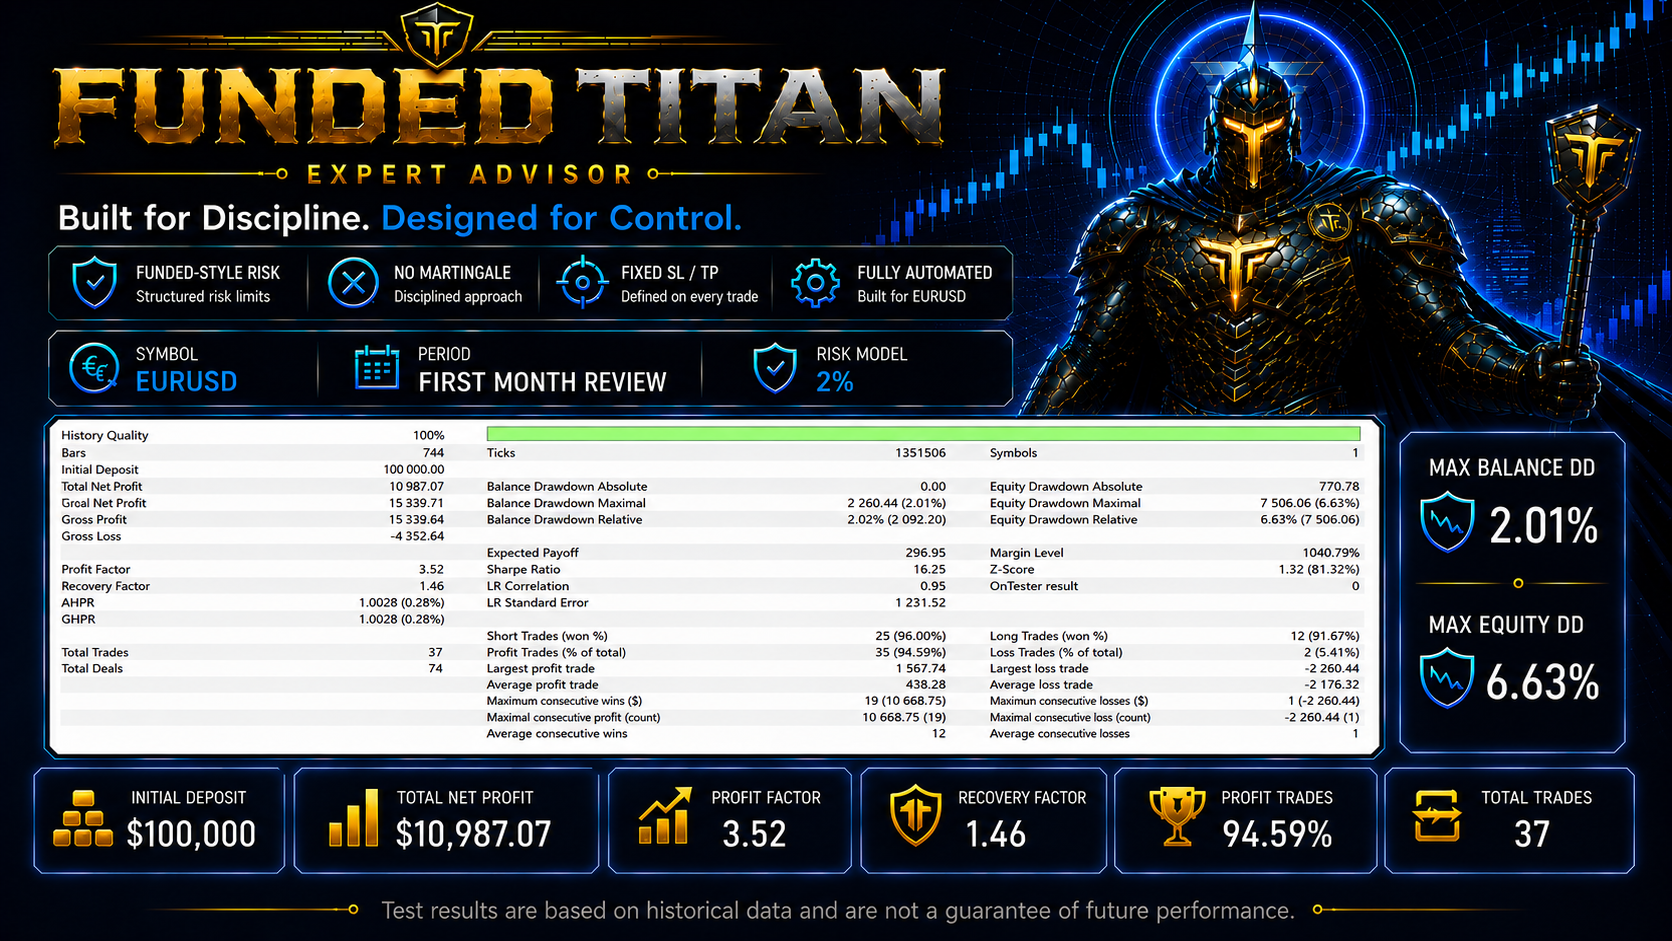
2% Risk Model — More Conservative Mode
The first test was performed with a 2% risk per trade model. This is a more conservative option that may be interesting for users who prefer to first study the EA’s behavior with lower pressure on the account.
Key Results of the 2% Test
Total Net Profit: $10,987.07
Gross Profit: $15,339.71
Gross Loss: -$4,352.64
Profit Factor: 3.52
Recovery Factor: 1.46
Total Trades: 37
Profit Trades: 35
Loss Trades: 2
Profit Trades: 94.59%
Balance Drawdown Maximal: 2.01%
Equity Drawdown Maximal: 6.63%
What can be noted from this test?
First, the EA did not open an excessive number of trades. During the monthly period, 37 trades were opened. This is an active enough mode to evaluate the system, but it does not look like chaotic trading or constant market exposure.
Second, the number of losing trades remained limited — 2 trades out of 37. However, it is important to look not only at the percentage of profitable trades, but also at drawdown, because drawdown shows the real pressure on the account during the test.
In the 2% model, the maximum balance drawdown was 2.01%, while the maximum equity drawdown was 6.63%. For a monthly test, this shows relatively controlled system behavior within the selected risk level.
This mode may be more suitable for users who want to test the EA more calmly: to study trade frequency, market reaction, drawdown behavior and the overall structure of the result.
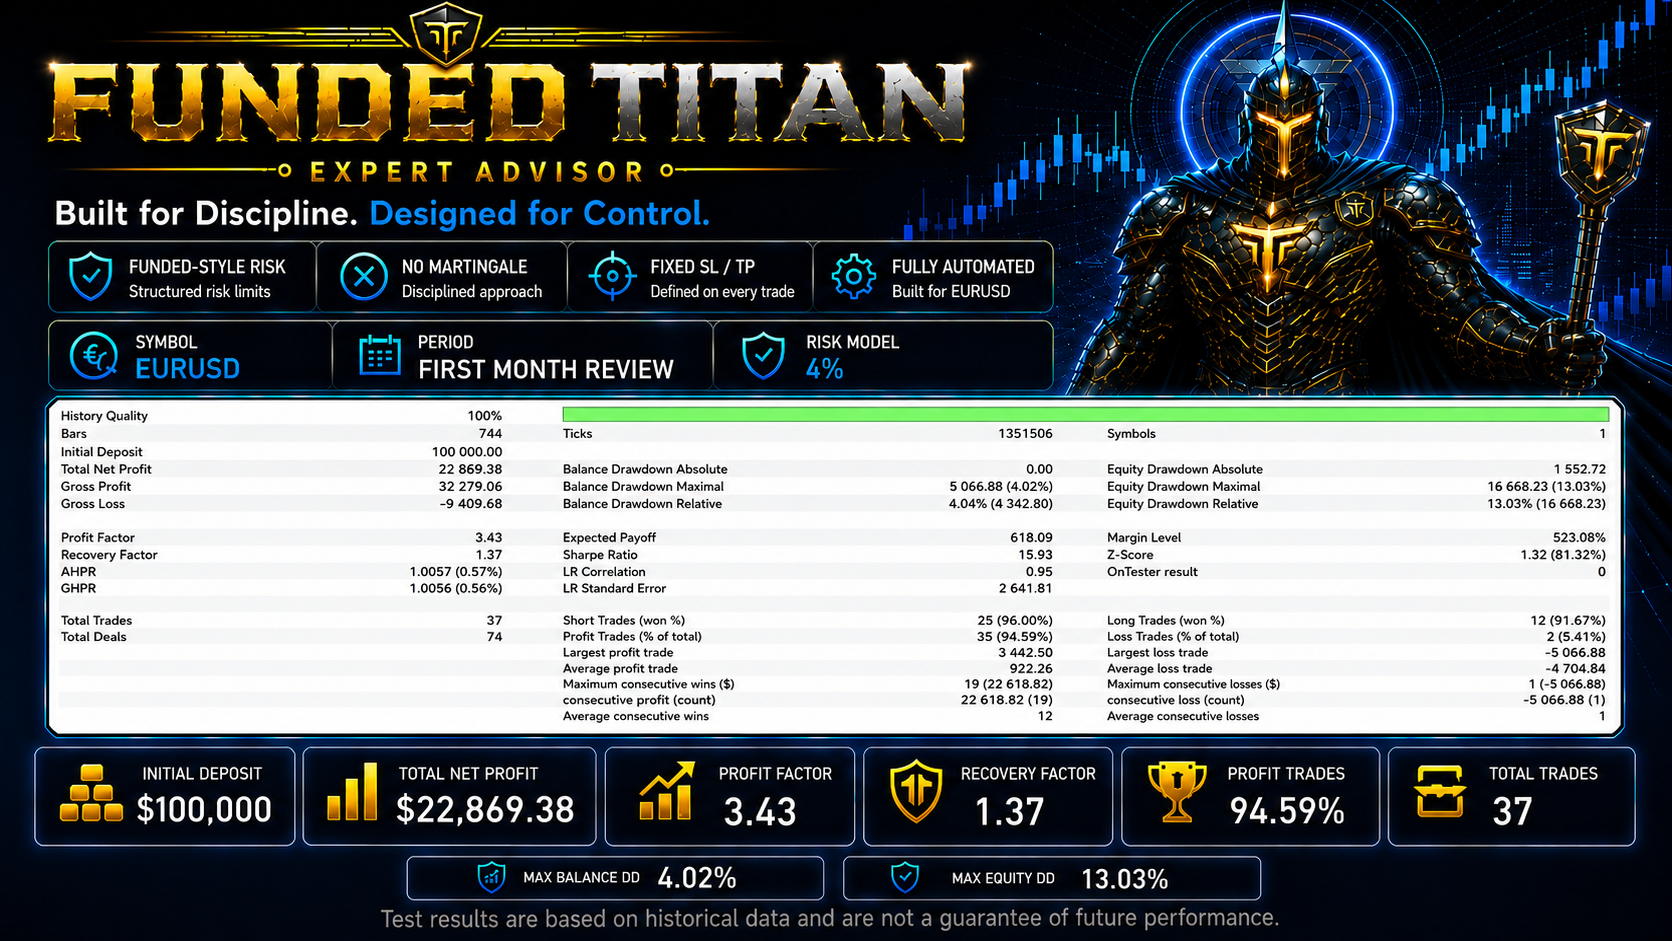
4% Risk Model — More Aggressive Mode
The second test was performed with a 4% risk per trade model. The trading logic remains the same, but the risk size is higher. As a result, the final result becomes stronger, while the pressure on the account also increases.
Key Results of the 4% Test
Total Net Profit: $22,869.38
Gross Profit: $32,279.06
Gross Loss: -$9,409.68
Profit Factor: 3.43
Recovery Factor: 1.37
Total Trades: 37
Profit Trades: 35
Loss Trades: 2
Profit Trades: 94.59%
Balance Drawdown Maximal: 4.02%
Equity Drawdown Maximal: 13.03%
This test shows the expected difference between a conservative and a more aggressive approach. With 4% risk, the final profit is higher, but the equity drawdown also increases. This is a normal trade-off: the higher the risk, the stronger the potential result, but the larger the account movement during trading.
At the same time, it is important that the number of trades remained the same — 37. The number of profitable and losing trades also stayed unchanged: 35 profitable trades and 2 losing trades. This means the difference between the two tests is not caused by different trading signals, but by position sizing and risk level.
In other words, Funded Titan did not change its trading logic, did not increase trade frequency and did not try to “recover” after losing trades. The difference between the two results appeared because of different risk settings.
2% vs 4% Comparison
Comparing the two risk models is useful because it helps the user look beyond the final profit and evaluate which mode better fits their capital management style.
The 2% model showed a calmer result. The final profit was lower, but the drawdown was also lower. This option may be interesting for users who prefer a more cautious approach and want to study the EA with less pressure on the account.
The 4% model showed a stronger final result, but with higher equity drawdown. This mode may be suitable for users who are ready to accept more active account movement in exchange for higher potential performance.
The key point in the comparison is that the trade structure remained the same:
Total Trades: 37
Winning Trades: 35
Losing Trades: 2
This makes the comparison cleaner. We are not looking at two different versions of the system, but at the same Funded Titan logic under different risk levels.
Why a Monthly Review Matters
A long-term backtest shows how an EA behaves over a large historical period. However, shorter regular reviews are also important because they allow us to observe the system during specific market phases.
A monthly review helps evaluate:
how often the EA opens trades;
how quickly the result is formed;
what drawdown appears inside the period;
how the system behaves after losing trades;
whether the result looks structured rather than random;
how account pressure changes under different risk settings.
For me, the final profit is not the only important part of such reviews. The structure of the result is much more important: the number of trades, the ratio between winning and losing trades, drawdown, stability of logic, and the ability for users to verify the EA in the Strategy Tester.
This is why I plan to publish these reports regularly. Over time, this will help build a more transparent picture of Funded Titan’s behavior: not only through large historical tests, but also through individual weeks and months.
Demo Version Available on MQL5
Funded Titan is available on MQL5 Market, and the EA has a demo version. This means users do not need to rely only on screenshots or my reviews.
The best way to evaluate the EA is to download the demo version and test Funded Titan yourself in the MetaTrader 5 Strategy Tester.
This approach allows users to check the EA under their own conditions: with their preferred testing period, selected settings and personal understanding of acceptable risk.
Funded Titan MT5 — product page and demo:
https://www.mql5.com/en/market/product/180776?source=Site+Market+My+Products+Page
Official Funded Titan Channel
Updates, new test reports, setup explanations and additional product materials are published in the official Funded Titan MQL5 channel:
https://www.mql5.com/ru/channels/titan
Final Thoughts
The first trading month of Funded Titan showed a strong result in both risk models.
The 2% model delivered a calmer result with lower drawdown pressure. The 4% model produced a higher final result, but required more tolerance for equity movement.
In both cases, the EA kept the same trade structure: 37 trades, 35 profitable trades and 2 losing trades. This makes the comparison between 2% and 4% especially useful because it shows the effect of risk, not a change in trading logic.
However, any test remains only a historical result. It does not guarantee future performance. Real trading may differ due to spread, commission, slippage, execution speed, broker settings and current market conditions.
That is why the best way to evaluate Funded Titan is not just to look at an article or screenshots, but to download the demo version, run your own Strategy Tester report and make a decision based on your own data.


")
