You'll Get Banned for Copy Trading You Never Knew About. A Walkthrough of the New Section in Prop Firm Vertical

The Email Nobody Expects
Mark cleared phase one in nine trading days. Not by hand — with an Expert Advisor he'd bought on a marketplace for a couple of hundred dollars. The usual story: checked the stats, checked the reviews, bought it, attached it to a challenge, got a result.
He closed phase two even faster. Received a funded account, traded it for six weeks, requested his first payout — around $4,200.
Instead of the payout an email arrived. Account closed. Reason: copy trading / account correlation. Profits confiscated, fee non-refundable, appeal reviewed and denied.
Mark hadn't copied anyone's trades. He didn't know a single one of the people he'd been "linked" to. He honestly bought an EA from a public store and ran a single instance of it on a single account.
The problem was that several hundred other people had bought the same EA. And, at a rough guess, roughly a third of them attached it to a challenge — because that's mostly what products like that get bought for. The firm saw a cluster of accounts trading the same trades, in the same seconds, at the same prices, and dealt with the cluster as a whole. Who copied whom, or whether anyone copied at all, is a secondary question from the firm's point of view: the rule prohibits an outcome, not an intention.
Mark had no way of finding this out in advance. None. He could see his own account and nothing else.
That asymmetry is exactly what the new section in FX Monitor's prop firm vertical closes — Copy Trading Risk.
The Asymmetry Behind All of It
Let's break the situation down by participant.
The firm sees all of its own accounts. It can take any two and compare them trade by trade: entry time, price, stop, take profit, exit time. That's a cheap computation, and firms do run it — regularly and automatically.
The trader sees nothing beyond his own account. He has no access to anyone else's trades and never will. He doesn't know how many people bought the same product, how many of them trade at his firm, or how similar his trades are to theirs.
We see both sides at once — within the population of FX Monitor users who have connected their accounts. Which means we can compute the exact metric the firm will compute and show it before the decision rather than after it.
That's the whole idea of the section in one paragraph.
Two Scenarios That Account for Most Bans
Scenario one — a purchased EA. The most common and the most unfair. You buy a product on a marketplace, attach it to a challenge, and physically cannot learn that the same product is running on two hundred other accounts at your firm. The more popular and better-performing the EA looks in its statistics, the more people bought it and the denser the cluster you're joining.
Scenario two — your own accounts. A trader runs one EA across three of his own challenges at the same firm. By most firms' definitions that already counts as copying — and, tellingly, in most cases the person genuinely has no idea. In his head it's "I'm scaling my strategy"; in the firm's rulebook it's "identical trades on linked accounts".
Neither can be established on your own. That's the reason the section exists at all.
Four Tools in One Section
The section is split into four tabs. The first three compute automatically and simply show you the picture; the fourth is run manually.
1. Other Traders — How Many Outside Accounts Match Yours
The section's headline answer. For every pair of "your account — someone else's account", the share of matched trades is computed and a risk band is drawn. It reads as a line like "67% match — elevated risk" with the firm named.
A constraint built into the architecture: the other party's identity is never revealed, in any form — no identifier, no pseudonym, no hint. Only numbers and the firm's name leave the system. You learn that there's an account at your firm matching yours at 67%; you don't learn whose it is. And rightly so: you need to make a decision about your own risk, not to find a culprit.
Settings: match strictness, comparison scope (within a single firm or across all accounts), and whether to include your own accounts. One detail for those who like turning knobs — no toggle triggers a recalculation. Everything is precomputed; switching is instant.
2. Your Own Accounts — Will the Firm See Two Indistinguishable Ones
Two independent detectors work here, and the difference between them matters more than it looks.
Declared reads your EA groups. If one EA is registered across several accounts, you declared it yourself — there's nothing to compute, only to read.
Observed goes into the trades themselves and finds the same magic number actually trading on two accounts. This works for people who never set up EA groups — which is to say, for most people.
The second detector doesn't duplicate the first, but it will always break through when it's broader than your declaration. Registered two accounts out of three? The third surfaces anyway. The logic is simple: the firm looks at trades, not at your entries in a third-party service — so we look at trades too.
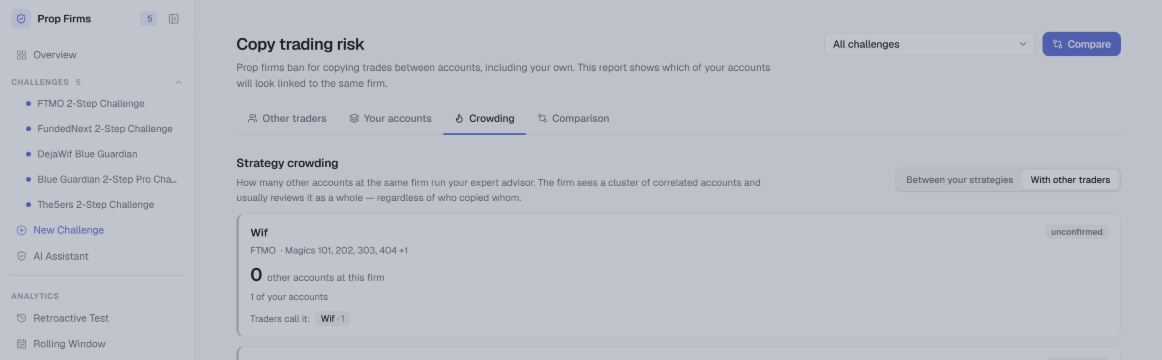
3. Strategy Crowding — How Busy It Is Inside Your EA
A tab with a two-mode switch.
With other users: how many other accounts at the same firm run the same EA, and how many distinct traders stand behind them. Plus the platform-wide scale — how mass-market the EA is in general. This is precisely the question Mark had no answer to: how many of us are there.
Across your own strategies: an inventory — which of your strategies are replicated across more than one account.
This tab also carries what I consider the most elegant mechanic in the section — crowd-sourced identification. A magic number is anonymous on its own: 778812 tells you nothing. But FX Monitor users name their EA groups in human language, and those names are used to label the anonymous number with the name traders actually know it by, with variant frequencies:
magic 778812 → "Gold Scalper · 61", "GoldBot · 22"
Sixty-one people called this EA Gold Scalper, another twenty-two called it GoldBot. No personal data, just name statistics — but you finally know which product is being discussed.
4. Comparison — a Calculator for Two of Your Own Accounts
The only tab you launch manually. It reproduces the firm's algorithm across four axes — entry time, entry price, SL/TP and exit — for two of your accounts at a chosen strictness. The output is two numbers side by side:
Exact matches: 12.4% · Within tolerance: 68.1%
The gap between those two numbers is diagnostic in itself.
If they're close, it's either natural coincidence or straightforward, unmodified copying.
If they've diverged widely, something is injecting jitter between the accounts: there's always a discrepancy in time and price, but it's always small. More on that below, because the conclusion there is the opposite of what many people expect.
Below the numbers sits a sample of matched trades, timestamp against timestamp, with the discrepancy on each axis. This is what the firm would show you if it chose to explain its decision — and what an appeal is worth building on.
How Trade Comparison Works
A section worth reading even if you don't need the tool itself, because it explains how the firm does it.
Comparison runs across four axes, each with its own tolerance. Matching is not binary: a density is computed on each axis, so "tick for tick" and "with randomisation" differ by a number rather than by a flag.
Three strictness levels:
| Profile | Time | Price | Meaning |
|---|---|---|---|
| Exact | 1 s | 1 point | the firm's literal algorithm |
| Strict | 5 s | 10 points | allowance for slippage |
| With randomisation | 30 s | 50 points | catches deliberate jitter |
There is deliberately no broader profile. Over minutes and hundreds of points, the base rate of random hits is such that the number turns into noise: two gold scalpers would "match" at 90% simply because they both trade gold.
Three technical decisions without which the numbers would be wrong:
SL and TP are compared by distance from entry, not by absolute price. Quotes drift between brokers, and entry and stop shift together. Comparing absolute prices would miss on fully identical trades — exactly where a detector is obliged to fire.
Matching is strictly one-to-one. Otherwise a scalper with fifty EURUSD trades would "match" a single outside trade fifty times, and the share would run past a hundred percent. Each trade can be matched to only one trade on the other side.
Broker quote differences are compensated for. The systematic offset between brokers is estimated from pairs selected by time and symbol only — that is, before price participates in the selection. Otherwise the estimate would be circular: we'd be selecting price-similar pairs in order to measure a price correction from them.
Three Things That Make the Numbers Honest
This is what separates the section from "a scary number on a screen". Anyone can display 68%. Explaining how much of that 68% means nothing is harder and more useful.
The Randomness Correction
A raw "68% match" proves nothing if both accounts trade the London open on gold. Two independent traders with a similar idea will enter in the same minutes simply because they're reacting to the same event.
So the second account's timeline is cyclically shifted by whole days, the comparison is recomputed a hundred times, and the section reports the excess over chance.
Shifting by whole days specifically is not an arbitrary choice. It preserves the time-of-day distribution: if both accounts are active at 10:00 London, they remain active at 10:00 after the shift. Which means the result has exactly the "both in the same session" effect subtracted out — the effect that would otherwise be presented as evidence.
If the observed value doesn't stand out from the random spread, the risk band is forcibly lowered and the user reads it in plain words: "does not exceed the random spread — the accounts simply trade in the same sessions."
That's probably the strongest reason to trust the section's numbers: it's capable of saying "there's nothing here", not only "this looks dangerous".
Protection Against Magic Number Collisions
12345 , 100 , 1 — factory defaults for the magic number in a great many entirely different EAs. Eighty accounts sharing one number don't mean eighty copies of one strategy; they may mean eighty different products whose authors never changed the default.
So crowding always travels together with a confidence figure, computed from the consistency of trade comments. Comments line up — it's one product. Comments are all over the place — it's a collision of defaults, and the risk band is forcibly lowered to a note with an explanation.
The Signature of Deliberate Randomisation — and Why the Conclusion Is the Opposite
This needs saying plainly, because the topic invites the wrong reading.
Natural coincidence produces a spread centred on zero: sometimes trades line up tick for tick, sometimes they miss badly, and the distribution is symmetric. Artificial jitter leaves a hole at zero — there's always a discrepancy, but it's always small. Suspiciously few exact matches, suspiciously many near ones.
The section recognises that signature and states it directly — not as a loophole but as a risk. Firms run the same test with tolerance. A pattern of "always off, but always just barely" doesn't hide accounts; it draws attention to them, because randomness doesn't behave that way.
This is a matter of principle for the section and for the product as a whole: we warn about risk and help explain a ban that has already happened, but we don't suggest what to tweak. The tool answers "how similar are you to others", not "how do I become less similar".
Privacy: What Enters the Calculation and What Doesn't
Since this involves cross-user comparison, the data question has to be addressed explicitly.
Cross-user computations run only on data from users who have given permission. The "Share anonymised data" toggle sits in your profile and is on by default.
The setting is symmetric. Turn it off and your data stops participating in other people's calculations — and cross-user numbers stop being shown to you. No taking without giving. Analysis of your own accounts works independently of the toggle: you can always compare your accounts to your accounts.
Only anonymised trading data enters the calculation: symbol, direction, volume, time and price of the operation, algorithm identifier and trade comment. Personal data, account numbers, broker names and financial results do not.
Results are returned strictly as quantities. Who the matched accounts belong to is never disclosed under any circumstances — that isn't a privacy setting that can be relaxed, it's a property of the architecture.
Firm Boundaries: Why Risk Is Computed Within a Single Firm
FTMO cannot see your account at MyForexFunds. There is no shared trade registry between firms — at best they exchange lists of violators, not trading history.
From which follows something simple: linkage risk exists only within a single firm, and that's how the section computes it by default. Accounts at different firms are shown separately and for reference — as food for thought, not as risk.
By the same logic, shadow-mode accounts don't count toward the risk assessment: the firm can't see them, so it can't link them. If you're testing an EA on demo under a firm's rules (see Prop Firm Vertical's shadow modes), that creates no correlation risk for you.
What to Do With the Result
The section's recommendations lie strictly in the domain of compliance, not evasion:
- don't run one EA on two accounts at the same firm — the most common and most easily removed source of risk;
- spread challenges across different firms — linkage risk doesn't cross a firm boundary;
- ask the firm — many permit multiple accounts if they're declared in advance; declared is not the same as discovered;
- don't take a mass-market marketplace EA to a challenge — the more popular the product, the denser the cluster you join.
A separate scenario is when the ban has already happened. A saved report with a sample of matched trades and the randomness correction is material for an appeal. Not a guarantee of the outcome, but a substantive argument instead of "I didn't copy anything": here is the measured share of matches, and here is how much of it is explained by the fact that we both trade the London session.
Reports are frozen along with their trade sample and survive routine data cleanup — a ban can still be explained months later.
A Few Details People Usually Miss
One EA, several magic numbers. Most EAs assign a magic number per symbol. The section understands this and consolidates four numbers into one strategy rather than showing four identical cards.
Activity periods have to overlap. An EA that ran on one account in January and on another in March isn't simultaneous copying, and the section accounts for that. Otherwise any trader who switched accounts would end up in his own risk statistics.
Multipliers from EA groups are read directly. If you registered one EA across three accounts with different volume multipliers, you declared the replication yourself — the section simply reads your declaration instead of guessing.
What the Section Doesn't Do
The section without which this article would be dishonest.
This is not a probability of being banned. No calibrated model exists: we have no labelled outcomes and we don't know any particular firm's thresholds. The section shows a measured share of matches and a risk band whose thresholds are our estimate, not the firm's rule. Phrasing like "73% chance of a ban" would be invention.
Low risk does not mean "safe". A firm looks at more than trade correlation: there's also IP, device fingerprint, KYC and payment method. We measure one line out of several, and the interface says so in plain text.
Coverage is not complete. Only accounts of FX Monitor users who agreed to share anonymised data are compared. The firm sees more than we do. "Zero matches" means "nobody in our population", not "you're clean". As the number of connected accounts grows the picture becomes fuller — this is a case where the tool's accuracy grows with its base.
The section doesn't protect or prevent. It blocks nothing and intervenes in nothing — it measures and displays. The decision stays with you.
This is not a way to evade detection. We warn about risk and help explain a ban that already happened. Suggestions along the lines of "make your trades less similar" are not in the product and never will be.
The calculation isn't instant. Cross-user comparison runs on a schedule: a newly connected account appears in the picture within a day.
This is not legal advice, and nobody can guarantee the outcome of an appeal.
The Bottom Line
Back to Mark. What would have been different with this section.
He would have seen that the EA he bought was running on several dozen other accounts at his firm. He would have seen the share of matches with those accounts — and, more importantly, the part of it not explained by chance. He would have understood he was sitting in a dense cluster two months before he requested a payout.
And he would have had a choice he never had: move the EA to a different firm, spread strategies across accounts, or simply write to support in advance and ask.
A copy trading ban almost never comes from bad intent. It comes from informational asymmetry: the firm sees the whole picture, the trader sees only his slice. The Copy Trading Risk section doesn't overturn firms' rules or argue with them. It simply shows the trader the same picture the firm sees — before a decision is made on it.
The Copy Trading Risk section is part of FX Monitor's prop firm vertical. Cross-user computations run only on data from users who have enabled anonymised data sharing; the setting is symmetric and lives in your profile. MT4 and MT5 are both supported.




